How to Set Up TeamCity for Load Testing
Learn how to install and configure the TeamCity CI and build server to carry out load testing as part of your continuous integration process.
Join the DZone community and get the full member experience.
Join For FreeTesting, in general, is an indispensable part of the continuous delivery process, and load testing should not be an exception. Let’s take a look at how to set it up in TeamCity.
TeamCity is a continuous integration and build server from JetBrains. Although it is capable of running JMeter load tests out of the box, you still must analyze the results manually. That’s not very useful as the concept of CI is based on automation. That’s where the SmartMeter.io tool comes in. Let's dive in.
1: Installation
You need to download and install SmartMeter.io to be able to run the load tests (here’s an installation guide in case you need any help).
Let’s assume you have TeamCity already functional and your TeamCity user has proper permissions to run the SmartMeter.io installation.
2: Basic Information
Before we begin, you have to gather some information about your SmartMeter installation:
SmartMeter.io installation directory - TeamCity’s agent need to have access to this directory and to run SmartMeter.sh in it. Example: /usr/local/bin/smartmeter/
Test directory - directory, that contains prepared .jmx scripts. This is usually pulled from Version Controll System (VCS). Example: /home/teamcity/tests
Reports directory - directory to store reports from SmartMeter.io. These reports will be artifacts for your build runs. Example: /home/teamcity/reports in our setup.
3: Running SmartMeter.io Tests From TeamCity
3.1: Configuring Build Parameters
1) Add new parameters to your build configuration. Go to Parameters section of your build configuration. Click the button Add new parameter.

2) Add ReportIndex to parameters. Create parameter with this configuration:
Name - ReportIndex
Kind - Configuration parameter
Value - index.html
Spec - text validationMode='not_empty' label='Perf Report' display='normal'

3) Add TrendsIndex to parameters. Almost the same as in the previous step:
Name - TrendsIndex
Kind - Configuration parameter
Value - trends.html
Spec - text validationMode='not_empty' label='Trends' display='normal'

4) Add ReportUrl to parameters. This will be the URL where you find report of the build. We will use predefined build parameters: teamcity.serverUrl, system.teamcity.buildType.id, build.number
Name - Reporturl
Kind - Configuration parameter
Value - http://%teamcity.serverUrl%/repository/download/%system.teamcity.buildType.id%/%build.number%/
Spec - text validationMode='not_empty' label='Report Url' display='normal'

5) Now we have these three parameters configured.

3.2: Configuring Artifacts
1) Go back to General settings of the Build configuration settings of your project.

2) Add parameters to Artifacts paths.
%ReportIndex%
%Reporturl%
%TrendsIndex%
/home/teamcity/reports/report-%build.number%

3.3: Configuring Build Steps
1) Go to the build configuration of your project and add a new build step. Set up:
Runner type: Command Line
Step name: Run Smartmeter test (or whatever you like)
Run: Executable with parameters
Command executable: path to SmartMeter /usr/local/bin/smartmeter/SmartMeter.sh
Command parameters: runTestNonGui <path/to/tests/dir>/test.jmx -Jetn_report_name=%build.counter% -Jetn_reports_path=<path/to/reports/dir>
where <path/to/tests/dir> is a directory where you store or download your test scripts and <path/to/reports/dir> is a directory where you want to store reports

2) Next we want to create report page. Add a second build step with this config:
Runner type: Command Line
Step name: Create report page (or whatever you like)
Run: Custom script
Custom script:
echo '<script>location="%Reporturl%%ReportIndex%"</script>' > %ReportIndex%

3) And a final build step is for creating trends page.
Runner type: Command Line
Step name: Create trends page (or whatever you like)
Run: Custom script
Custom script:
echo '<script>location="%Reporturl%%TrendsIndex%"</script>' > %TrendsIndex%

3.4: Configuring Report Tabs
We have set up parameters and configured build steps. Now we want to set up reports to appear right in the build view or project view.
1) Go to your TeamCity project settings.

2) Open Report tabs section. You will see Create new project report tab button and Create new build report tab button.

3) By using these buttons we will add reports to our project or build view. Let’s start with build report. Click on Create new build report tab button. Configuring it is very easy. Just type the name of the tab to Tab Title, e.g. “Perf test report.” Leave Start page unchanged - it should contain value “index.html.”

4) Now click Create new project report tab button and set these values:
Tab Title: Perf trends
Get artifacts from: choose the name of your project’s build configuration. In the second combobox, choose Last successful build.
Start page: trends.html

5) You should see the tabs in the configuration.

3.5: First Trial Run
If everything is configured, you can try the first run of a test.
1) Go to your project home and click the Run button.
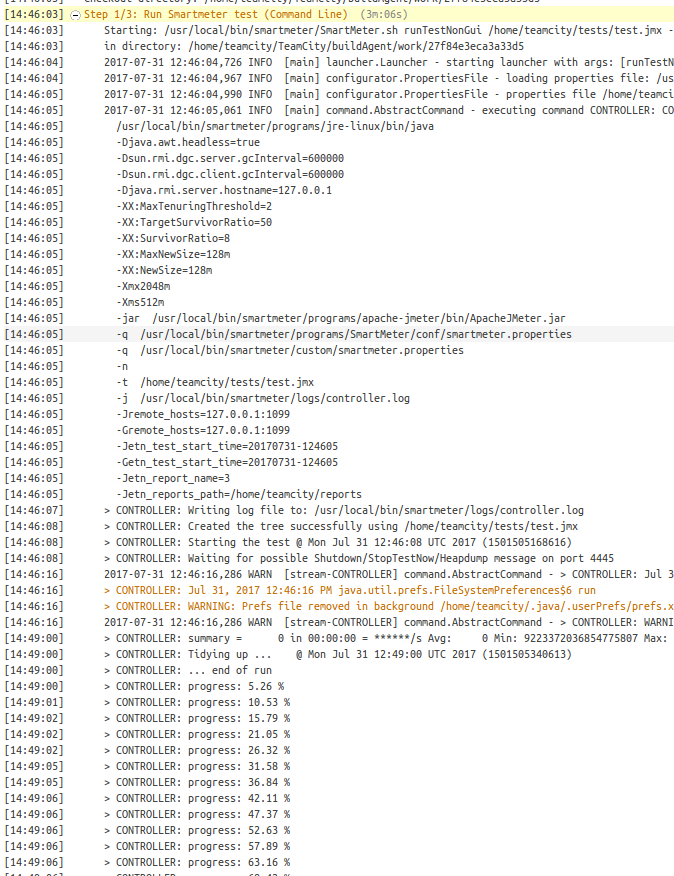
2) After a few moments, the SmartMeter test will start. You can see the progress in the build log.
3) After finishing the test, SmartMeter will generate a report and TeamCity will add it to the Report Tabs. You can see a result analysis in the Build detail.

4) Trends analysis can be seen in Project home view in tab Perf trends. Run your test multiple times, and you will see how tables and charts will change.

4: Next Steps
You should now be able to run a load test in TeamCity with SmartMeter.io. If you’re not familiar with the tool and want to learn more about test creation and other features, visit the learn section. You can also follow tutorials for Jenkins and Bamboo.
Published at DZone with permission of Martin Krutak. See the original article here.
Opinions expressed by DZone contributors are their own.
Comments