How to Solve OutOfMemoryError: Java Heap Space
Delve into the root causes behind this error, explore potential solutions, and discuss effective diagnostic methods to troubleshoot this problem.
Join the DZone community and get the full member experience.
Join For FreeThere are 9 types of java.lang.OutOfMemoryError, each signaling a unique memory-related issue within Java applications. Among these, java.lang.OutOfMemoryError: Java heap space stands out as one of the most prevalent and challenging errors developers encounter. In this post, we’ll delve into the root causes behind this error, explore potential solutions, and discuss effective diagnostic methods to troubleshoot this problem. Let’s equip ourselves with the knowledge and tools to conquer this common adversary.
JVM Memory Regions
To better understand OutOfMemoryError, we first need to understand different JVM Memory regions (see this video clip that gives a good introduction to different JVM memory regions). But in a nutshell, JVM has the following memory regions:
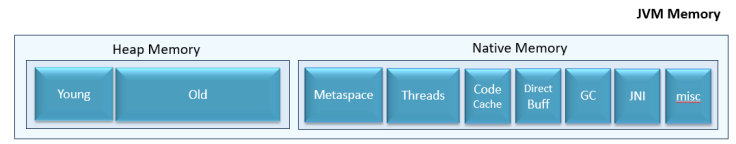
Figure 1: JVM Memory Regions
- Young generation: Newly created application objects are stored in this region.
- Old generation: Application objects that are living for a longer duration are promoted from the young generation to the old generation. Basically, this region holds long-lived objects.
- Metaspace: Class definitions, method definitions, and other metadata that are required to execute your program are stored in the Metaspace region. This region was added in Java 8. Before that, metadata definitions were stored in the PermGen. Since Java 8, PermGen was replaced by Metaspace.
- Threads: Each application thread requires a thread stack. Space allocated for thread stacks, which contain method call information and local variables are stored in this region.
- Code cache: Memory areas where compiled native code (machine code) of methods is stored for efficient execution are stored in this region.
- Direct buffer: ByteBuffer objects are used by modern frameworks (i.e., Spring WebClient) for efficient I/O operations. They are stored in this region.
- GC (Garbage Collection): Memory required for automatic garbage collection to work is stored in this region.
- JNI (Java Native Interface): Memory for interacting with native libraries and code written in other languages are stored in this region.
- Misc: There are areas specific to certain JVM implementations or configurations, such as the internal JVM structures or reserved memory spaces, they are classified as "misc" regions.
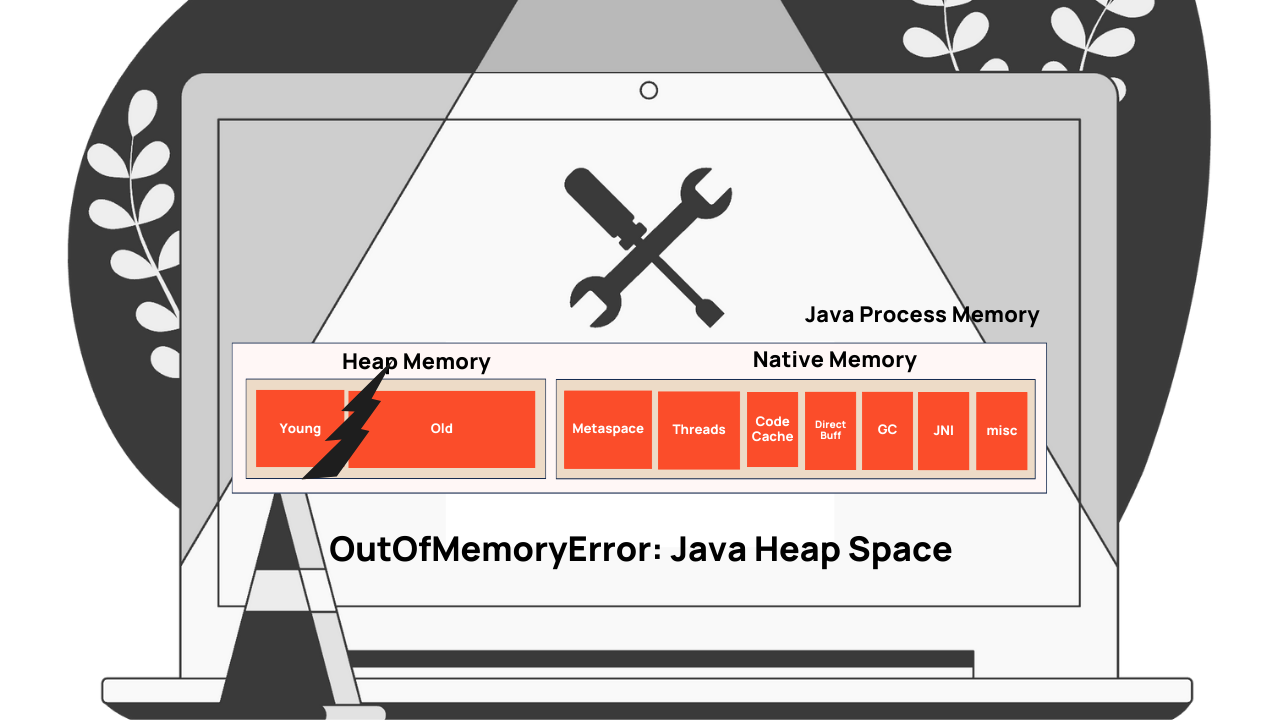
What Is ‘java.lang.OutOfMemoryError: Java heap space’?
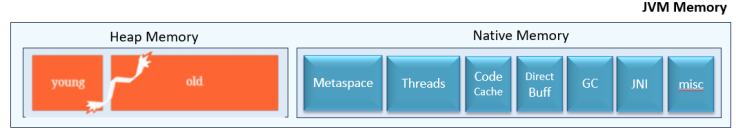
Figure 2: ‘java.lang.OutOfMemoryError: Java heap space’
When more objects are created in the "Heap" (i.e., young and Ood) region than the allocated memory limit (i.e., -Xmx), then JVM will throw java.lang.OutOfMemoryError: Java heap space.
What Causes ‘java.lang.OutOfMemoryError: Java heap space’?
java.lang.OutOfMemoryError: Java heap space is triggered by the JVM under the following circumstances:
1. Increase in Traffic Volume
When there is a spike in the traffic volume, more objects will be created in the memory. When more objects are created than the allocated Memory limit, JVM will throw ‘OutOfMemoryError: Java heap space’.
2. Memory Leak Due to Buggy Code
Due to the bug in the code, an application can inadvertently retain references to objects that are no longer needed. It can lead to the buildup of unused objects in memory, eventually exhausting the available heap space, resulting in OutOfMemoryError.
Solutions for ‘OutOfMemoryError: Java heap space’
The following are the potential solutions to fix this error:
1. Fix Memory Leak
Analyze memory leaks or inefficient memory usage patterns using the approach given in this post. Ensure that objects are properly dereferenced when they are no longer needed to allow them to be garbage collected.
2. Increase Heap Size
If OutOfMemoryError surfaced due the increase in the traffic volume, then increase the JVM heap size (-Xmx) to allocate more memory to the JVM. However, be cautious not to allocate too much memory, as it can lead to longer garbage collection pauses and potential performance issues.
Sample Program Generating ‘OutOfMemoryError: Java heap space’
To better understand java.lang.OutOfMemoryError: Java heap space, let’s try to simulate it. Let’s leverage BuggyApp, a simple open-source chaos engineering project. BuggyApp can generate various sorts of performance problems such as Memory Leak, Thread Leak, Deadlock, and multiple BLOCKED threads. Below is the program from the BuggyApp project that can simulate java.lang.OutOfMemoryError: Java heap space when executed.
public class MapManager {private static HashMap<Object, Object> myMap = new HashMap<>();public void grow() {long counter = 0;while (true) {if (counter % 1000 == 0) {System.out.println("Inserted 1000 Records to map!");}myMap.put("key" + counter, "Large stringgggggggggggggggggggggggg" + counter);++counter;}}}
The above program has a MapManager class that internally contains a HashMap object that is assigned to the myMap variable. Within the grow() method, there is an infinite while (true) loop that keeps populating the HashMap object. On every iteration, a new key and value (i.e., key-0 and Large stringgggggggggggggggggggggggg-0) is added to the HashMap. Since it’s an infinite loop, myMap object will get continuously populated until heap capacity is saturated. Once the heap capacity limit is exceeded, the application will result in java.lang.OutOfMemoryError: Java heap space.
How to Troubleshoot ‘OutOfMemoryError: Java heap space’
It’s a two-step process:
1. Capture Heap Dump
You need to capture the heap dump from the application, right before JVM throws OutOfMemoryError. In this post, 8 options to capture the heap dump are discussed. You might choose the option that fits your needs. My favorite option is to pass the -XX:+HeapDumpOnOutOfMemoryError -XX:HeapDumpPath=<FILE_PATH_LOCATION> JVM arguments to your application at the time of startup.
Example:
-XX:+HeapDumpOnOutOfMemoryError -XX:HeapDumpPath=/opt/tmp/heapdump.binWhen you pass the above arguments, JVM will generate a heap dump and write it to /opt/tmp/heapdump.bin whenever OutOfMemoryError is thrown.
What is Heap Dump?

Heap Dump is a snapshot of your application memory. It contains detailed information
about the objects and data structures present in the memory. It will tell what
objects are present in the memory, whom they are referencing, who are referencing,
what is the actual customer data stored in them, what size of they occupy, are
they eligible for garbage collection… They provide valuable insights into the memory
usage patterns of an application, helping developers identify and resolve memory-related
issues.
2. Analyze Heap Dump
Once a heap dump is captured, you need to use tools like HeapHero, JHat, etc. to analyze the dumps.
How to Analyze Heap Dump?
In this section let’s discuss how to analyze heap dump using the HeapHero tool.
HeapHero is available in two modes:
- Cloud: You can upload the dump to the HeapHero cloud and see the results.
- On-Prem: You can register to get the HeapHero installed on your local machine and then do the analysis.
Note: I prefer using the on-prem installation of the tool instead of using the cloud edition because heap dump tends to contain sensitive information (such as SSN, Credit Card Numbers, VAT, etc.), and don’t want the dump to be analyzed in external locations.
Once the tool is installed, upload your heap dump to the HeapHero tool. The tool will analyze the dump and generate a report. Let’s review the report generated by the tool for the above program.
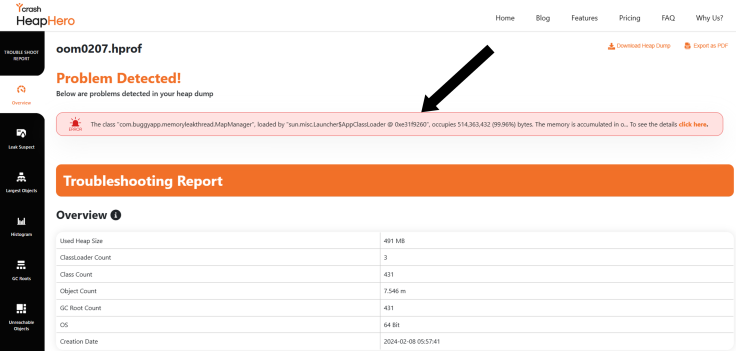
Figure 3: HeapHero reporting Memory problem detected
From the above screenshot, you can see HeapHero reporting that a problem has been detected in the application and it points out that the MapManager class is occupying 99.96% of overall memory. The tool also provides an overall overview of the memory (Heap Size, Class count, Object Count, etc.).
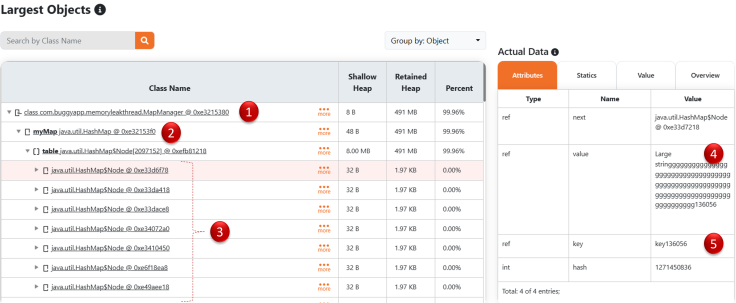
Figure 4: Largest objects in the application
Above is the "Largest Objects" section screenshot from the HeapHero’s heap dump analysis report. This section shows the largest objects that are present in the application. In the majority of cases, the top 2–3 largest objects in the application are responsible for Memory Leak in the application. Let’s see what are the important information provided in this "Largest Objects" section.
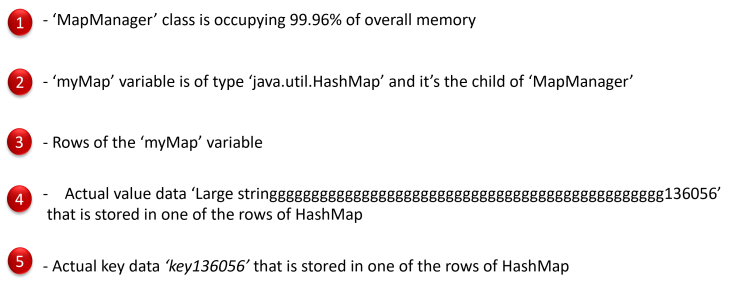
Figure 5: Largest Objects Breakdown
If you notice in #4 and #5, you can see the actual data is present in the memory. Equipped with this information, you can know the largest objects in the application and the values present in the application. If you want to see who created or holding on to the reference of the largest objects, you can use the "Incoming References" feature of the tool. When this option is selected, it will display all the objects that are referencing the MapManager class.
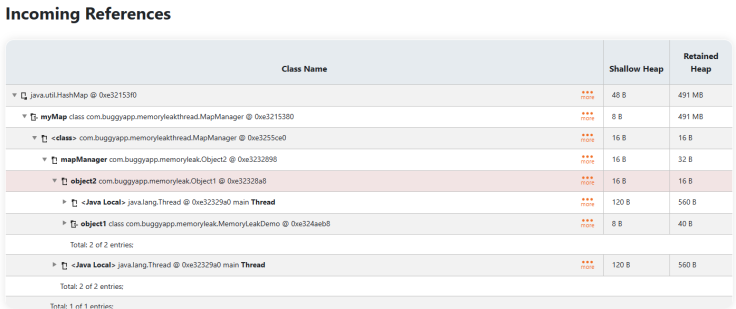
Figure 6: Incoming references of the Selected Object
From this report you can notice that MapManager is referenced by Object2, which is in turn referenced by Object1, which in turn is referenced by MemoryLeakDemo.
Video
Here’s a video summary of this article:
Conclusion
In this post, we’ve covered a range of topics, from understanding JVM memory regions to diagnosing and resolving java.lang.OutOfMemoryError: Java heap space. We hope you’ve found the information useful and insightful. But our conversation doesn’t end here. Your experiences and insights are invaluable to us and to your fellow readers. We encourage you to share your encounters with java.lang.OutOfMemoryError: Java heap space in the comments below. Whether it’s a unique solution you’ve discovered, a best practice you swear by, or even just a personal anecdote, your contributions can enrich the learning experience for everyone.
Published at DZone with permission of Ram Lakshmanan. See the original article here.
Opinions expressed by DZone contributors are their own.
Comments