How to Solve OutOfMemoryError: Metaspace
java.lang.OutOfMemoryError: Metaspace is a challenging error to diagnose. Delve into its root causes, potential solutions, and effective diagnostic methods.
Join the DZone community and get the full member experience.
Join For Freejava.lang.OutOfMemoryError: Metaspace is a challenging error to diagnose. In this post, we’ll delve into the root causes behind this error, explore potential solutions, and discuss effective diagnostic methods to troubleshoot this problem. Let’s equip ourselves with the knowledge and tools to conquer this common adversary.

JVM Memory Regions
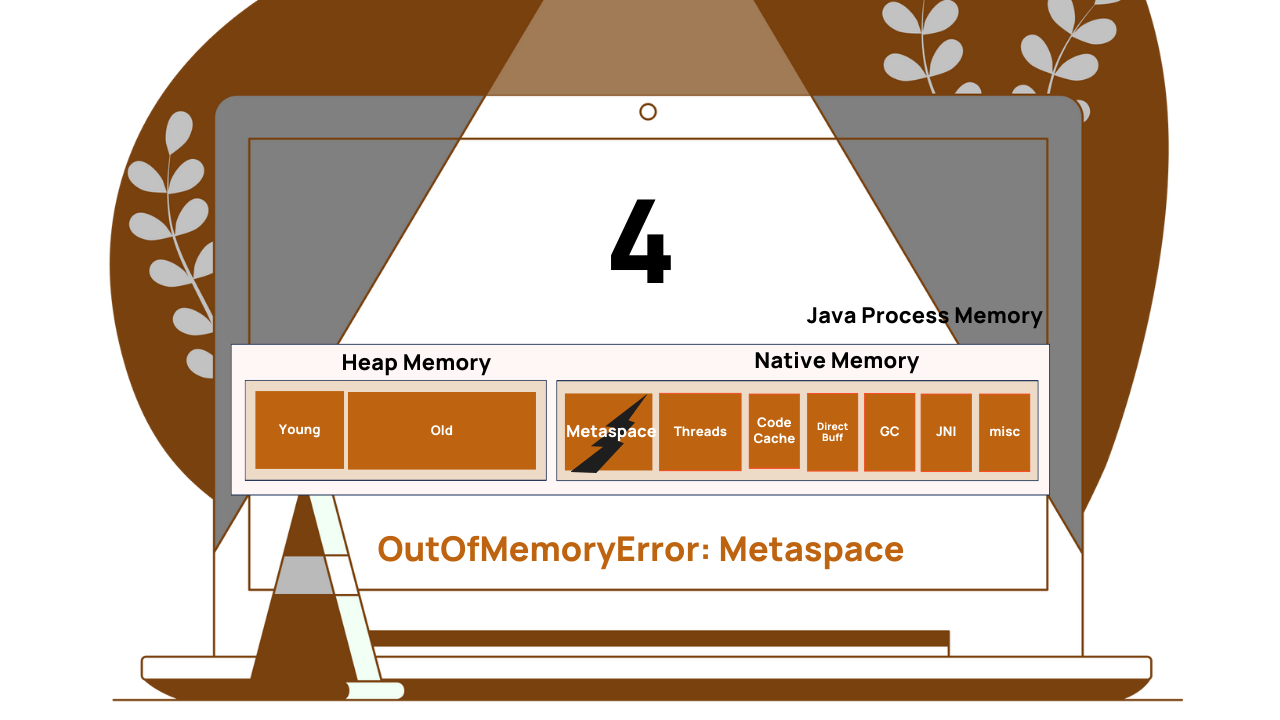
To better understand OutOfMemoryError, we first need to understand different JVM Memory regions. Here is a video clip that gives a good introduction to different JVM memory regions. But in a nutshell, JVM has the following memory regions:

Figure 1: JVM memory regions
- Young Generation: Newly created application objects are stored in this region.
- Old Generation: Application objects that are living for a longer duration are promoted from the Young Generation to the Old Generation. Basically, this region holds long-lived objects.
- Metaspace: Class definitions, method definitions, and other metadata that are required to execute your program are stored in the Metaspace region. This region was added in Java 8. Before that metadata definitions were stored in the PermGen. Since Java 8, PermGen was replaced by Metaspace.
- Threads: Each application thread requires a thread stack. Space allocated for thread stacks, which contain method call information and local variables are stored in this region.
- Code cache: Memory areas where compiled native code (machine code) of methods is stored for efficient execution are stored in this region.
- Direct buffer: ByteBuffer objects are used by modern frameworks (i.e., Spring WebClient) for efficient I/O operations. They are stored in this region.
- GC (Garbage Collection): Memory required for automatic garbage collection to work is stored in this region.
- JNI (Java Native Interface): Memory for interacting with native libraries and code written in other languages is stored in this region.
- misc: There are areas specific to certain JVM implementations or configurations, such as the internal JVM structures or reserved memory spaces, they are classified as ‘misc’ regions.
What Is java.lang.OutOfMemoryError: Metaspace?

java.lang.OutOfMemoryError: Metaspace
With a lot of class definitions, method definitions are created in the Metaspace region than the allocated Metaspace memory limit (i.e., -XX:MaxMetaspaceSize), JVM will throw java.lang.OutOfMemoryError: Metaspace.
What Causes java.lang.OutOfMemoryError: Metaspace?
java.lang.OutOfMemoryError: Metaspace is triggered by the JVM under the following circumstances:
- Creating a large number of dynamic classes: If your application uses Groovy kind of scripting languages or Java Reflection to create new classes at runtime
- Loading a large number of classes: Either your application itself has a lot of classes or it uses a lot of 3rd party libraries/frameworks which have a lot of classes in it.
- Loading a large number of class loaders: Your application is loading a lot of class loaders.
Solutions for OutOfMemoryError: Metaspace
The following are the potential solutions to fix this error:
- Increase Metaspace size: If
OutOfMemoryErrorsurfaced due to an increase in the number of classes loaded, then increased the JVM’s Metaspace size (-XX:MetaspaceSizeand-XX:MaxMetaspaceSize). This solution is sufficient to fix most of theOutOfMemoryError: Metaspaceerrors, because memory leaks rarely happen in the Metaspace region.
- Fix memory leak: Analyze memory leaks in your application using the approach given in this post. Ensure that class definitions are properly dereferenced when they are no longer needed to allow them to be garbage collected.
Sample Program That Generates OutOfMemoryError: Metaspace
To better understand java.lang.OutOfMemoryError: Metaspace, let’s try to simulate it. Let’s leverage BuggyApp, a simple open-source chaos engineering project. BuggyApp can generate various sorts of performance problems such as Memory Leak, Thread Leak, Deadlock, multiple BLOCKED threads, etc. Below is the Java program from the BuggyApp project that simulates java.lang.OutOfMemoryError: Metaspace when executed.
import java.util.UUID;import javassist.ClassPool;public class OOMMetaspace {public static void main(String[] args) throws Exception {ClassPool classPool = ClassPool.getDefault();while (true) {// Keep creating classes dynamically!String className = "com.buggyapp.MetaspaceObject" + UUID.randomUUID();classPool.makeClass(className).toClass();}}}
In the above program, the OOMMetaspace’ class’s ‘main() method contains an infinite while (true) loop. Within the loop, the thread uses open-source library javassist to create dynamic classes whose names start with com.buggyapp.MetaspaceObject. Class names generated by this program will look something like this: com.buggyapp.MetaspaceObjectb7a02000-ff51-4ef8-9433-3f16b92bba78. When so many such dynamic classes are created, the Metaspace memory region will reach its limit and the JVM will throw java.lang.OutOfMemoryError: Metaspace.
How to Troubleshoot OutOfMemoryError: Metaspace
To diagnose OutOfMemoryError: Metaspace, we need to inspect the contents of the Metaspace region. Upon inspecting the contents, you can figure out the leaking area of the application code. Here is a blog post that describes a few different approaches to inspecting the contents of the Metaspace region. You can choose the approach that suits your requirements. My favorite options are:
1. -verbose:class
If you are running on Java version 8 or below, then you can use this option. When you pass the -verbose:class option to your application during startup, it will print all the classes that are loaded into memory. Loaded classes will be printed in the standard error stream (i.e., console, if you aren’t routing your error stream to a log file).
Example:
java {app_name} -verbose:classWhen we passed the -verbose:class flag to the above program, in the console we started to see the following lines to be printed:
[Loaded com.buggyapp.MetaspaceObjecta97f62c5-0f71-4702-8521-c312f3668f47 from__JVM_DefineClass__][Loaded com.buggyapp.MetaspaceObject70967d20-609f-42c4-a2c4-b70b50592198 from__JVM_DefineClass__][Loaded com.buggyapp.MetaspaceObjectf592a420-7109-42e6-b6cb-bc5635a6024e from__JVM_DefineClass__][Loaded com.buggyapp.MetaspaceObjectdc7d12ad-21e6-4b17-a303-743c0008df87 from__JVM_DefineClass__][Loaded com.buggyapp.MetaspaceObject01d175cc-01dd-4619-9d7d-297c561805d5 from__JVM_DefineClass__][Loaded com.buggyapp.MetaspaceObject5519bef3-d872-426c-9d13-517be79a1a07 from__JVM_DefineClass__][Loaded com.buggyapp.MetaspaceObject84ad83c5-7cee-467b-a6b8-70b9a43d8761 from__JVM_DefineClass__][Loaded com.buggyapp.MetaspaceObject35825bf8-ff39-4a00-8287-afeba4bce19e from__JVM_DefineClass__][Loaded com.buggyapp.MetaspaceObject665c7c09-7ef6-4b66-bc0e-c696527b5810 from__JVM_DefineClass__][Loaded com.buggyapp.MetaspaceObject793d8aec-f2ee-4df6-9e0f-5ffb9789459d from__JVM_DefineClass__]: :
This is a clear indication that classes with the com.buggyapp.MetaspaceObject prefixes are loaded so frequently into the memory. This is a great clue/hint to let you know where the leak is happening in the application.
2. -Xlog:class+load
If you are running on Java version 9 or above, then you can use this option. When you pass the -Xlog:class+load option to your application during startup, it will print all the classes that are loaded into memory. Loaded classes will be printed in the file path you have configured.
Example:
java {app_name} -Xlog:class+load=info:/opt/log/loadedClasses.txtIf you are still unable to determine the origination of the leak based on the class name, then you can do a deep dive by taking a heap dump from the application. You can capture a heap dump using one of the 8 options discussed in this post. You might choose the option that fits your needs. Once a heap dump is captured, you need to use tools like HeapHero, JHat, etc. to analyze the dumps.
What Is Heap Dump?
Heap Dump is basically a snapshot of your application memory. It contains detailed information about the objects and data structures present in the memory. It will tell what objects are present in the memory, whom they are referencing, who is referencing, what is the actual customer data stored in them, what size of they occupy, whether they are eligible for garbage collection, etc. They provide valuable insights into the memory usage patterns of an application, helping developers identify and resolve memory-related issues.
How to Analyze Metaspace Memory Leak Through Heap Dump
HeapHero is available in two modes:
- Cloud: You can upload the dump to the HeapHero cloud and see the results.
- On-Prem: You can register here, get the HeapHero installed on your local machine, and then do the analysis.
Note: I prefer using the on-prem installation of the tool instead of using the cloud edition because heap dump tends to contain sensitive information (such as SSN, Credit Card Numbers, VAT, etc.), and I don’t want the dump to be analyzed in external locations.
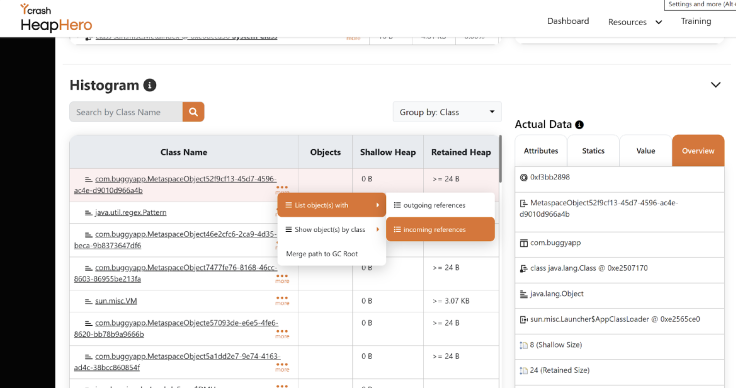
Once the heap dump is captured, from the above program, we upload it to the HeapHero tool. The tool analyzed the dump and generated the report. In the report go to the ‘Histogram’ view. This view will show all the classes that are loaded into the memory. In this view, you will notice the classes with the prefix com.buggyapp.MetaspaceObject. Right-click on the … that is next to the class name. Then click on the List Object(s) with > incoming references as shown in the below figure.

Figure 3: Histogram view of showing all the loaded classes in memory
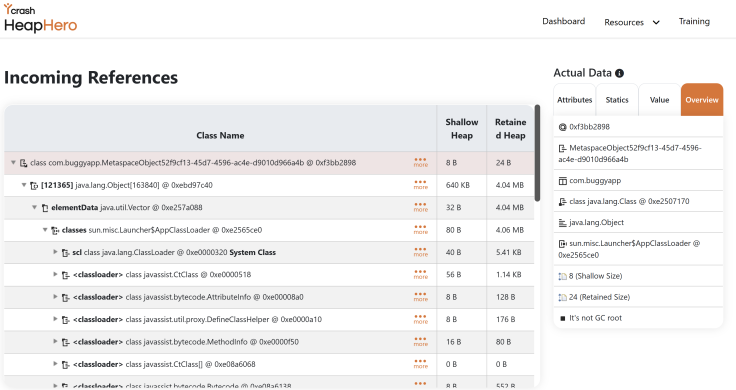
Once you do it, the tool will display all the incoming references of this particular class. This will show the origin point of these classes as shown in the below figure. It will clearly show which part of the code is creating these class definitions. Once we know which part of the code is creating these class definitions, then it will be easy to fix the problem.

Figure 4: Incoming references of the class
Video Summary
Here’s a video summary of the article:
Conclusion
In this post, we’ve covered a range of topics, from understanding JVM memory regions to diagnosing and resolving java.lang.OutOfMemoryError: Metaspace. We hope you’ve found the information useful and insightful. But our conversation doesn’t end here. Your experiences and insights are invaluable to us and to your fellow readers. We encourage you to share your encounters with java.lang.OutOfMemoryError: Metaspace in the comments below. Whether it’s a unique solution you’ve discovered, a best practice you swear by, or even just a personal anecdote, your contributions can enrich the learning experience for everyone.
Published at DZone with permission of Ram Lakshmanan, DZone MVB. See the original article here.
Opinions expressed by DZone contributors are their own.

Comments