How to Visualize and Understand Your MongoDB Data
Check out what MongoDB is as well as some data visualization tools. Also look at MongoDb for real-time analytics.
Join the DZone community and get the full member experience.
Join For FreeOne of the essential pillars of modern real-time applications is their elasticity. Therefore, choosing the database for an application can be a real challenge. Different database designs serve different purposes, and for this case, relational databases don’t fully meet the needs of developers because of their rigid schemas and constraints on data types.
Elasticity can be provided by using a flexible database, which is able to handle big amounts of mostly unstructured data and increase/reduce storage capacity without loss when the business requirements are suddenly changed.
Therefore, NoSQL databases gradually displace the relational ones: their capabilities can meet the challenges of modern, usually unstructured, data.
MongoDB is ahead of all other NoSQL databases and fulfills business requirements on fast and flexible access to the data in various spheres of development, especially where a live data prevails. The great news is that ACID transactions are supported starting from MongoDB 4.0.
To be sure, you can check a credible spline chart of DB-engines ranking on databases trends over years and compare usage of MongoDB to the usage of other databases.
Let’s dive deeper into the technical aspects of MongoDB and its advantages.
What is MongoDB?
MongoDB is a document-oriented database. It means that all the data is stored in JSON-like documents which are stored in collections in its turn — an analog of the tables in relational databases but without specified relations between them. It is optimized for natively storing the documents and other types of data.
Why Use MongoDB?
I’d like to point out the most compelling features of MongoDB:
- Dynamic schema: you don’t need to predefine the schema in advance at the moment of collection creation; you can change fields’ types, their number and size of the document at any time. Creation of dynamic data models is thus provided. That is what is called a flexibility of MongoDB. It finds its recognition in an agile development.
- Support of indexing, dynamic queries on documents, and real-time aggregation for powerful data analysis.
- Scalability. That means that you can spread the data across multiple servers easily without threats to its availability. The same cannot be said about the approach used in relational databases.
- No need in mapping the application’s business objects to database tables (for example, as in Java using JPA). Therefore, it’s easy to work with data.
- Support of auto-sharding, which enables horizontal scaling. Horizontal scaling requires adding servers which usually costs lower than using a more powerful CPU (a vertical scaling). MongoDB shards data at the collection level.
- Cross-platform compatibility.
- The last but not the least: it’s free and open-source.
However, I should mention that there always existed a trade-off between flexibility and reliability. The latest usually involves ACID compliance and is provided by SQL databases. So it’s up to you what database to choose for your application — a relational or NoSQL one.
MongoDB for Real-Time Analytics
If your data is growing and changing its structure once in a while, the natural question arises: how to handle and process all of that data? Here comes in handy the functionality of NoSQL databases and MongoDB in particular. MongoDB is optimized for natively storing documents and their fast accessing by indexing, also, the replication is supported. Therefore it is much faster than its relational competitors. To enhance existing optimization, you can search for different techniques which include using WiredTiger engine, zone-based sharding, choosing short names for fields, etc.
The fact that MongoDB is in favor of such companies as Google, Cisco, SAP, Facebook, Expedia, and others speaks for itself. It is commonly used for real-time analytics, big data, mobile applications, etc. MongoDB is the best decision for unstructured and semi-unstructured data such as:
- Posts in social media
- Web pages
- Emails
- Reports
- Medical records
- Raw data from marketing researches
- Scientific data
- And other
Besides, it greatly copes with storing structured data as well.
Available MongoDB Data Visualization Tools
Whatever type of data you choose, sometimes it becomes necessary to visualize all the data or its part. When searching for MongoDB data visualization tool, I’ve noticed that it is hard to find the one with out-of-the-box functionality. So today I’ll give you a rundown of the tools which I’ve used together to visualize my data.
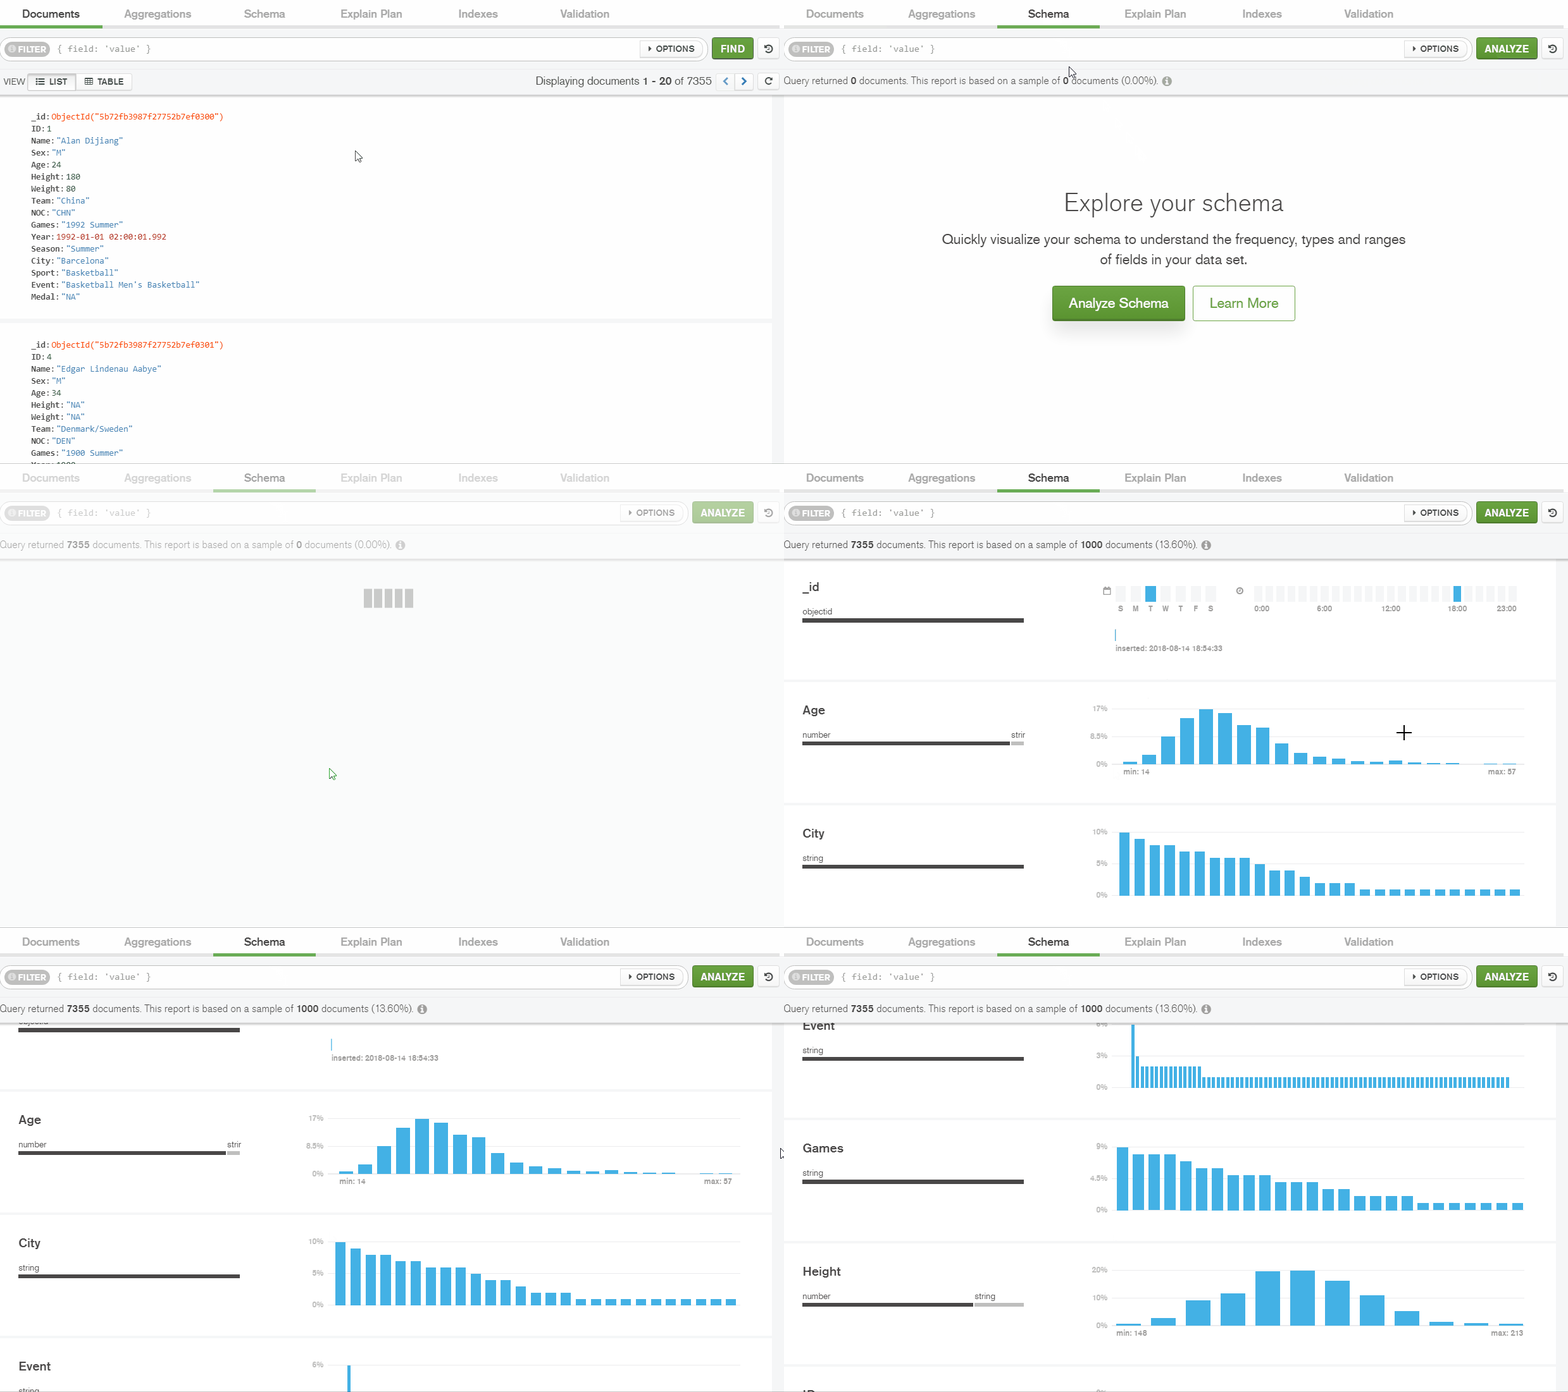
 I think it is one of the most powerful parts of Compass because it makes me able to interact with my data in real time, quickly perform simple and complex queries to filter the data and see the specific portions of it, analyze the distribution of data types and fields’ values using generated histograms.
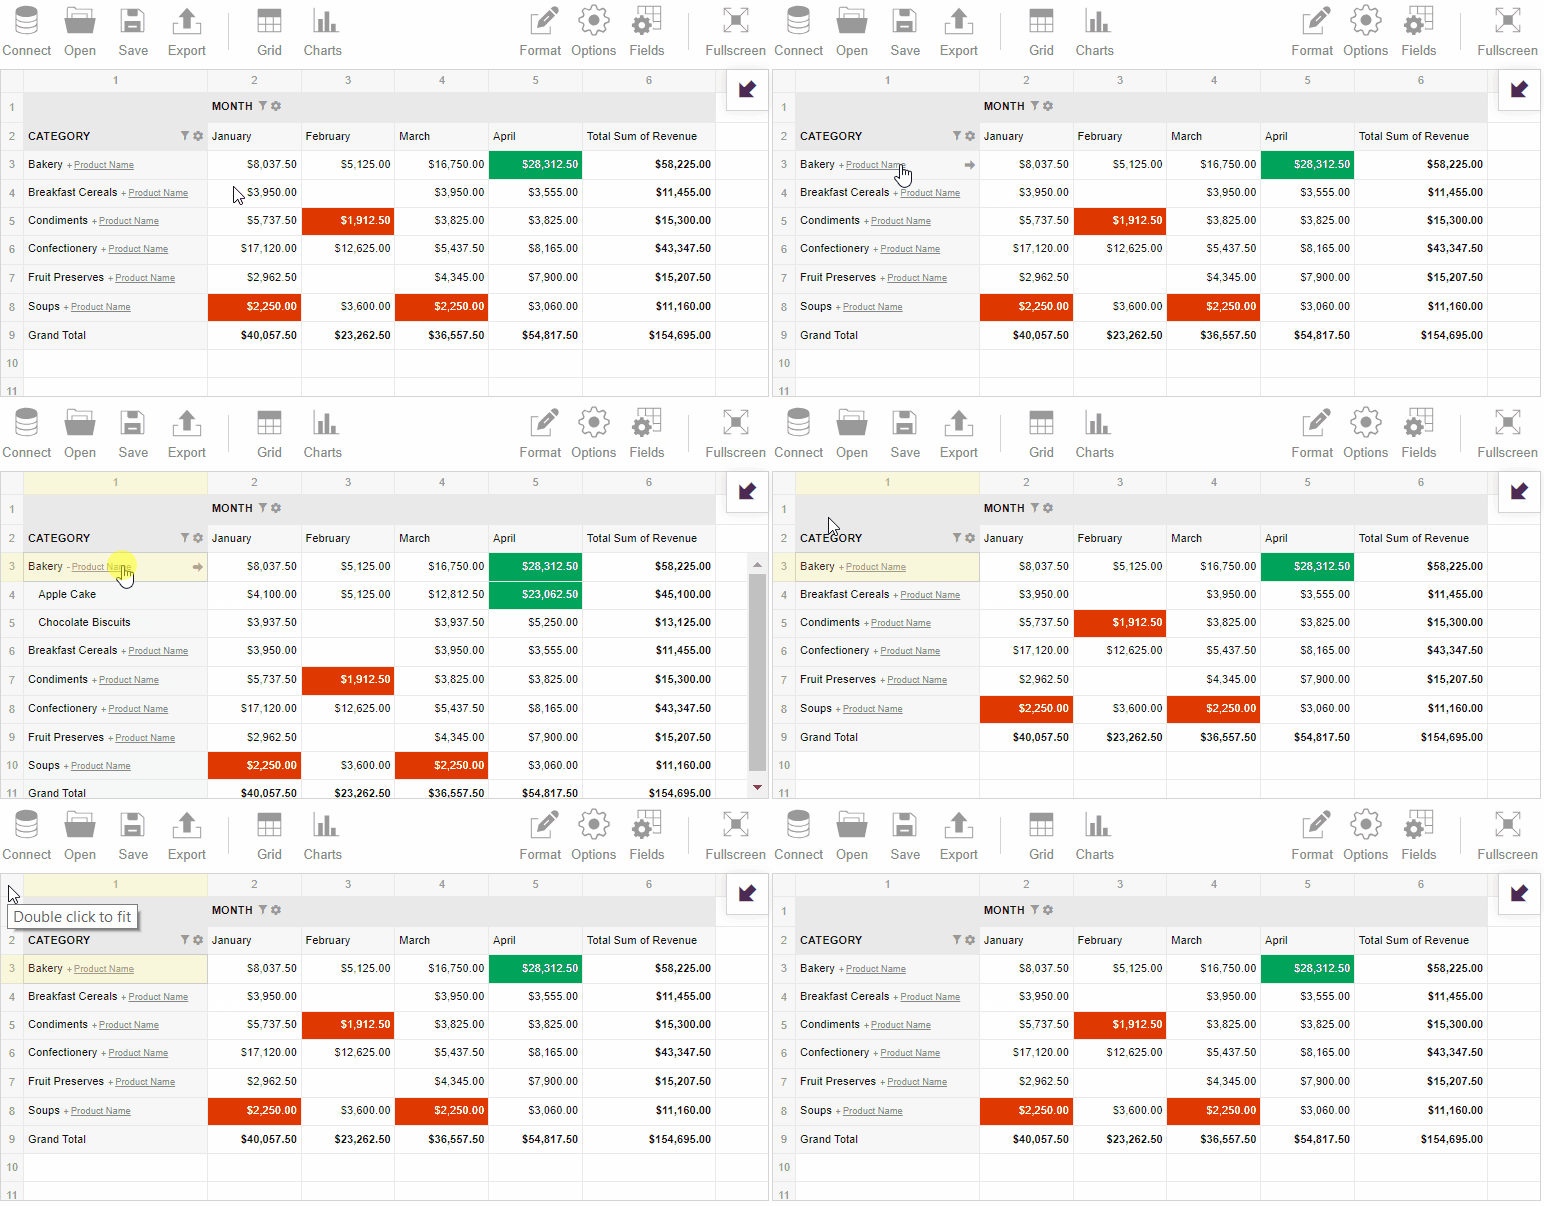
Flexmonster offers a free trial that allowed me to evaluate all the features and functionalities.
Also, I’ve noticed that while Compass is installed as a stand-alone application, Flexmonster needs to be embedded into the web application. I have an Angular 4 application and sometimes it takes a while to integrate a new tool into it. But in the documentation, I’ve found a tutorial that helped me to accomplish this task quickly.

To start getting insights into data, you can request the data from the MongoDB database and load it right into the pivot table. I’ve used this tutorial to get the data into my Node.js application.
I hope you will try both tools to achieve your most sophisticated MongoDB data analysis goals. Feel free to experiment with Compass and Flexmonster Pivot Table and see how their functionalities complement each other.
I would love to hear your feedback on this review. Please let me know what you think in the comments. What tools do you use for MongoDB data visualization? Do they meet all of your requirements?
Opinions expressed by DZone contributors are their own.

Comments