If Bad Things Happen to Good Automated Tests - How Red Deer Helps you to Debug Failed Tests
Join the DZone community and get the full member experience.
Join For FreeThis is the fourth in a series of posts on the new JBoss Red Deer automated test framework. This post describes features in Red Deer that make it easier to debug test failures.
Writing any automated UI tests can be a challenging task. Your tests have to be able to manipulate the UI, deal with platform-dependent display characteristics, and timing issues. But, what about when things go wrong and you have to debug a failing test? Are you looking at a bug in the program that you’re testing? Or, perish the thought, what if the bug is not in the program you’re testing, but it’s in your test program?The primary goal of Red Deer is to make this task easier by providing a open source solution that is reliable and extensible. Red Deer also makes your life easier when things go wrong by providing your with multiple debugging features. This post describes these features and illustrates how you can enable/disable Red Deer’s debugging features, and how you can use them to debug test failures.
Maven and Eclipse Debugging is Still Usable
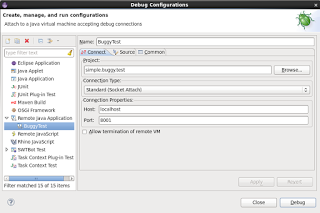
Before discussing Red Deer’s debugging features, it’s important to remember that in no way does Red Deer prevent you from performing the types of debugging that you can use with Maven or Eclipse. You can use the Eclipse debugger to set breakpoints in Red Deer test programs in the same manner as any other programs. Likewise, to debug a Red Deer test program with maven, all you have to do is to run maven with -DdebugPort=<debug_port>, and in Eclipse, select the test class that you want to execute, select "Debug As," and create a new debug configuration. In the debug configuration, specify that you want to run the test class as a Remote Java Application, and the port number. Starting the debugger makes the waiting test execution run and then stop on the first breakpoint:
Debugging Features Added by Red Deer
The Red Deer debugging features that we’ll discuss in this post are:
Red Deer Debug Logging
Automatic Screenshots for Failed Tests
Pausing Failing Tests
Recording Screencasts
Let’s start by looking at the simplest of Red Deer’s debugging tools; logging.
Red Deer Debug Logging
By default, Red Deer creates a DEBUG level log whenever a test is run. The log is written to stdout when you run tests from a shell and to the console view when you run tests in Eclipse.
Some example output of a Red Deer log looks like this:
INFO [thread][class] Log message-N
INFO [thread][class] Log message-N+1
ERROR [thread][class] Hey! Something failed here
DEBUG [thread][class] And, here’s some additional debug information
INFO [thread][class] Log message-N+2
To disable debug logging, you set the “logDebug” JVM argument to false. For example:
-DlogDebug=false
In addition, you can also filter the log contents with the “logMessageFilter” JVM argument.
The supported filter values are:
debug
error
warn
info
trace
none
all
You can set multiple filters by specifying filter values in a single string using vertical pipe separators. For example:
-DlogMessageFilter=error|warn
Note that the filter values are case insensitive.
Automatic Screenshots for Failed Tests
As is the case with debug logging, screenshot saving for failed tests is enabled by default by Red Deer. What happens is that when a Red Deer test fails, at the point of failure a screenshot is taken and stored for you. The screenshot illustrates the state of the UI when the test failure occured. By default, Red Deer saves the screenshot files in the “target/screenshot” directory. You can select the directory into which Red Deer will save the screenshot files by setting this JVM argument: relativeScreenshotDirectory
For example: -DrelativeScreenshotDirectory=/home/jsmith/screenshots
Let’s take a look at this in action. The following screenshot was generated when a test failed. The server address in question is valid. The error was due to a temporary network connectivity issue.
What happens under the hood here is that when a test fails, the Red Deer watchdog process takes over, and invokes an extension of the org.eclipse.swt.graphics.ImageLoader class to create a screenshot, before it terminates the test.
Having a screenshot is helpful, as it shows the state of the UI Red Deer determined that something went very wrong, but it's limited in that after the failure, Red Deer immediately stops the test and exits. In some cases having Red Deer take a screenshot and then exit may be adequate as the source of the failure is obvious. In other cases, however, you might prefer that Red Deer enable you to investigate the cause of the failure before the test is stopped and Red Deer exits.
Pausing Failing Tests
In some ways, an automated test failure is like an automobile crash. Something unexpected happens, and before you can react, the test goes off the road, rolls over and finishes in a ditch. Wouldn't life be easier if you could press a pause button to avoid bad things like this from happening?
Likewise, it would be helpful if Red Deer, instead of terminating the test immediately could enable you to press a "pause" button and freeze the test so that you could examine the state of the accident so that you could understand its causes.
Luckily Red Deer is a built-in feature to enable you to pause failing tests. Unlike the screenshot feature, having Red Deer pause when a test fails is not enabled by default. To enable the feature, all you have to do is to set the "pauseFailedTest" JVM argument to “true.”
For example: -DpauseFailedTest=true
With this argument set to “true,” when a test fails, it connects to the Red Deer watchdog process and test execution is paused. You can cause the test execution to continue by pressing the Enter key.
Note that in the current version of Red Deer, pauseFailedTest only works when your test extends the RedDeerTest class. In a future release of Red Deer, it will work on all test types.
Recording Screencasts
Up to now, the Red Deer debugging features that we’ve discussed have all had one characteristic in common; they all require that you run the test and manually observe the results. This means that for an error that is subtle and difficult to track, you have may have to rerun the test several times in order to be able to see the error. It would be more helpful if you had an easy way to pause the execution of the test at the point where it fails and “rewind” the execution to a point before the failure, without having to take the time, and occupy system resources, to rerun the test from its beginning.
Red Deer solves this problem by enabling you to save a screencast of all failed tests. Red Deer performs the screencast captures through an extension of the org.monte.screenrecorder.ScreenRecorder (http://www.randelshofer.ch/monte/) class
As is the case with pausing tests, Red Deer’s screencast feature is disabled by default. To enable the the recording of screenshots, you set the recordScreenCast JVM argument to “true.” For example:
-DrecordScreenCast=true
The screencast files are stored in a subdirectory named, appropriately enough, “screencast.”
References
AcknowledgementsMany thanks to Jirka Peterka and Vlado Pakan for their input to this post!
Opinions expressed by DZone contributors are their own.
Comments