Real-Time Weather Event Processing With HDF, Spark Streaming, and Solr
HDF collects, curates, analyzes, and delivers real-time data to data stores quickly and easily. It can be used with Spark Streaming and Solr to process weather events.
Join the DZone community and get the full member experience.
Join For FreeBy now, we've all gotten well-acquainted with Hortonworks DataFlow (HDF), which collects, curates, analyzes, and delivers real-time data to data stores (with help from Apache NiFi) in a super easy and quick way without having to actually code the various components required to deliver the expected results.
My team and I have also been exploring HDF implementation in various projects and POCs and I have to say, we have grown richer by our experience of working on it. It simply is fantastic!
Today, I am sharing one of our recent uses of HDF, which I hope will let you all implement it effectively, as well.
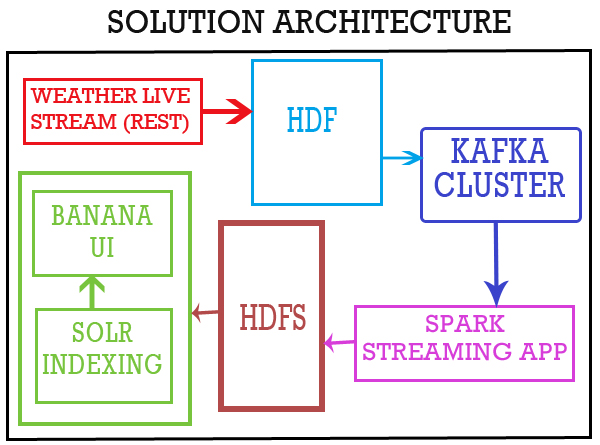
It's live weather reporting using HDF, Kafka, and Solr.
Here are the environment requirements for implementing:
- HDF (for HDF 2.0, you need Java 1.8).
- Kafka.
- Spark.
- Solr.
- Banana.
Now let’s get on to the steps!
Create DataFlow
Start HDF with /opt/HDF-2.0.0.0/nifi/bin/nifi.sh start. Open HDF http://localhost:8090/nifi. Choose the following processors to create the data flow:
InvokeHTTP.SplitJson.EvaluationJsonPath.ReplaceText.PutKafka.
Configurations for Each of the Processes
InvokeHTTP processor properties:
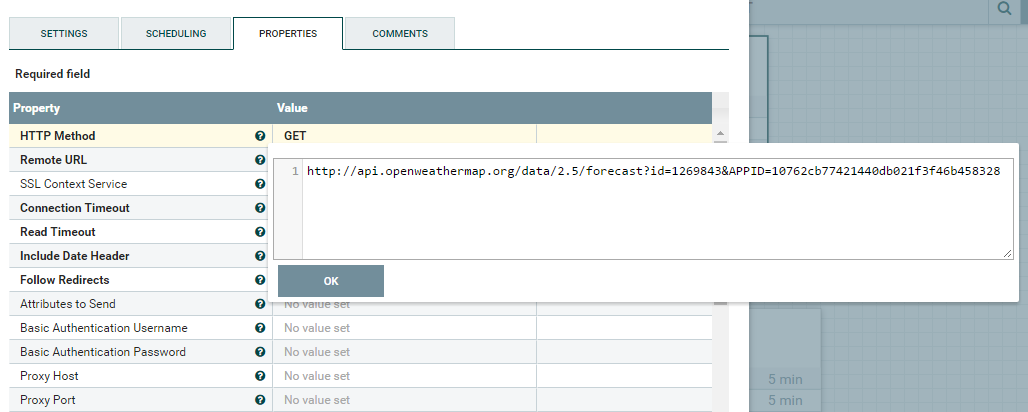
With the help of the InvokeHTTP processor, we are connecting to the source and getting data with the help of http://api.openweathermap.org/data/2.5/forecast?id=1269843&APPID=10762cb77421440db021f3f46b458328
It gives JSON data as below:
{
  "cod": "200",
  "message": 0.0162,
  "cnt": 37,
  "list": [
    {
      "dt": 1492678800,
      "main": {
        "temp": 314.08,
        "temp_min": 312.244,
        "temp_max": 342.08,
        "pressure": 959.7,
        "sea_level": 1017.07,
        "grnd_level": 959.7,
        "humidity": 21,
        "temp_kf": 1.84
      },
      "weather": [
        {
          "id": 800,
          "main": "Clear",
          "description": "clear sky",
          "icon": "01d"
        }
      ],
      "clouds": {
        "all": 0
      },
      "wind": {
        "speed": 3.52,
        "deg": 332.501
      },
      "rain": {},
      "sys": {
        "pod": "d"
      },
      "dt_txt": "2017-04-20 09:00:00"
    }
  ],
  "city": {
    "id": 1269843,
    "name": "Hyderabad",
    "coord": {
      "lat": 17.3753,
      "lon": 78.4744
    },
    "country": "IN"
  }
}
The parameters details are:
coordcoord.lon: City geolocation, longitude.coord.lat: City geo location, latitude.weatherweather.id: Weather condition ID.weather.main: Group of weather parameters (rain, snow, extreme etc.).weather.description: Weather condition within the group.weather.icon: Weather icon ID.base: Internal parameter.mainmain.temp: Temperature (unit default: Kelvin; metric: Celsius; imperial: Fahrenheit).main.pressure: Atmospheric pressure (on the sea level, if there is nosea_levelorgrnd_leveldata), hPa.main.humidity: Humidity, %.main.temp_min: Minimum temperature at the moment. This is a deviation from the current temperature that is possible for large cities and megalopolises geographically expanded (use these parameters optionally). Unit default: Kelvin; metric: Celsius; imperial: Fahrenheit.main.temp_max: Maximum temperature at the moment. This is a deviation from the current temperature that is possible for large cities and megalopolises geographically expanded (use these parameters optionally).Unit default: Kelvin; metric: Celsius; imperial: Fahrenheit.main.sea_level: Atmospheric pressure on the sea level, hPa.main.grnd_level: Atmospheric pressure on the ground level, hPa.windwind.speed: Wind speed (unit default: meter/sec, metric: meter/sec, imperial: miles/hour).wind.deg: Wind direction, degrees (meteorological).cloudsclouds.all: Cloudiness, %.rainrain.3h: Rain volume for the last three hours.snowsnow.3h: Snow volume for the last three hours.dt: Time of data calculation, unix, UTC.syssys.type: Internal parameter.sys.id: Internal parameter.sys.message: Internal parameter.sys.country: Country code (GB, JP etc.).sys.sunrise: Sunrise time, unix, UTC.sys.sunset: Sunset time, unix, UTC.id: City ID.name: City name.cod: Internal parameter.
The JSON data is split into separate records.
SplitJson Processor Properties
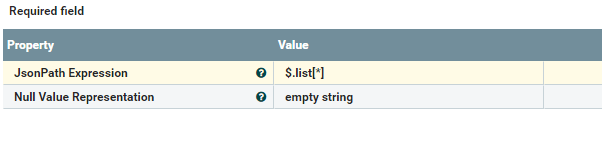
With the help of the SplitJson processor, we are splitting the JSON data based on the JsonPath Expression value:
JsonPath Expression= $.list[*]EvaluationJsonPath processor
EvaluationJsonPath properties:
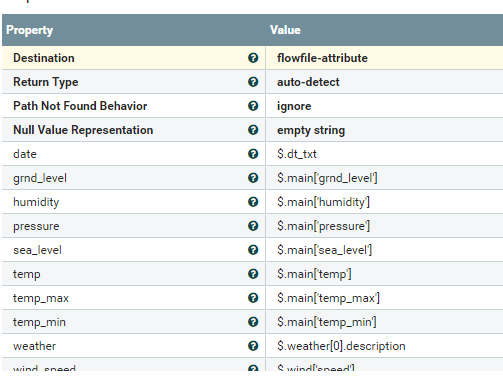
With the help of the EvaluationJsonPath processor, we are getting the required column values from the JSON data:
date = $.dt_txt
grnd_level = $.main{‘grnd_level’}
humidity =$.main['humidity']
pressure = $.main['pressure']
sea_level = $.main['sea_level']
temp = $.main['temp']
temp_max = $.main['temp_max']
temp_min = $.main['temp_min']
weather = $.weather[0].description
wind_speed = $.wind['speed']
ReplaceText Processor
ReplaceText processor properties:
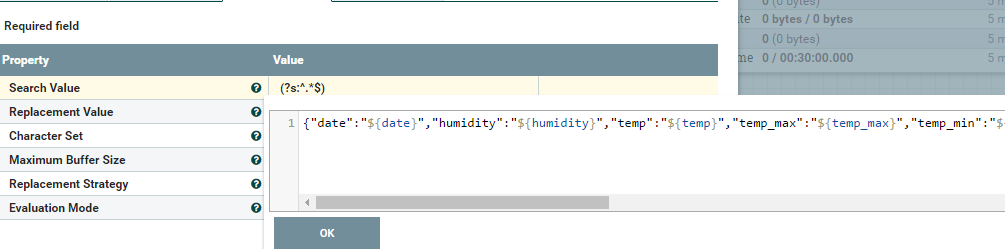
Select the required fields from the list in JSON Format:
{
  "date": "${date}",
  "humidity": "${humidity}",
  "temp": "${temp}",
  "temp_max": "${temp_max}",
  "temp_min": "${temp_min}",
  "weather": "${weather}",
  "wind_speed": "${wind_speed}",
  "pressure": "${pressure}",
  "sea_level": "${sea_level}",
  "grnd_level": "${grnd_level}"
}
With the help of the ReplaceText processor, we are replacing the required JSON records in the required columns.
PutKafka Processor
- Ingesting data into Kafka topic weather-in.
PutKafkawill create a new Kafka topic if a topic does not already exist.

Finally, load data into Kafka by using the PutKafka processor. Then, Spark does the job of reading data from Kafka and processing it.
2. Spark-Scala Application to Save Kafka Data in CSV Format
Create a Maven project with following code:
import kafka.serializer._
import org.apache.log4j._
import org.apache.spark.storage.StorageLevel
import org.apache.spark.SparkConf
import org.apache.spark.SparkContext
import org.apache.spark.sql._
import org.apache.spark.streaming._
import org.apache.spark.streaming.kafka.KafkaUtils
import com.google.gson.Gson
import com.databricks.spark.csv._
object KafkaWeatherReport {
  Logger.getLogger("org").setLevel(Level.OFF)
  Logger.getLogger("akka").setLevel(Level.OFF)

case class weather(date: String, grnd_level: Double, humidity: Int, pressure: Double, sea_level: Double,
temp: Double, temp_max: Double, temp_min: Double, weather: String, wind_speed: Double)

  val conf = new SparkConf().setMaster("local[*]").setAppName("Weather")
  val sc = new SparkContext(conf)
  val ssc = new StreamingContext(sc, Seconds(5))
  val sqlContext: SQLContext = new SQLContext(sc)
  import sqlContext.implicits._

def main(args: Array[String]): Unit = {
    var brokers = "localhost:6667"
    var topics = "weather-in".split(",").toSet
    var kafkaParams = Map[String, String]("metadata.broker.list" -> brokers)
    val data = KafkaUtils.createDirectStream[String, String, StringDecoder, StringDecoder](ssc, kafkaParams, topics).map(_._2).map(weatherParser)

    data.foreachRDD {
      rdd =>
        if (rdd.count > 0) {
          rdd.toDF.show()
          rdd.toDF.write.mode("overwrite")
          .format("com.databricks.spark.csv")
          .option("header", "true")
          .save("file:///opt/weather.csv ")
        }
    }
ssc.start
 ssc.awaitTermination()
  }
def weatherParser(line: String): weather = {
    val gson = new Gson()
    gson.fromJson(line, classOf[weather])
} }pom.xml:
<project xmlns="http://maven.apache.org/POM/4.0.0" xmlns:xsi="http://www.w3.org/2001/XMLSchema-instance" xsi:schemaLocation="http://maven.apache.org/POM/4.0.0 http://maven.apache.org/xsd/maven-4.0.0.xsd">
  <modelVersion>4.0.0</modelVersion>
  <groupId>NifiKafkaSpark</groupId>
  <artifactId>NifiKafkaSpark</artifactId>
  <version>0.0.1-SNAPSHOT</version>
  <dependencies>
<dependency>
<groupId>org.apache.spark</groupId>
<artifactId>spark-core_2.10</artifactId>
<version>1.6.0</version>
  </dependency>
  <dependency>
<groupId>org.apache.spark</groupId>
<artifactId>spark-sql_2.10</artifactId>
<version>1.6.0</version>
    </dependency>
  <dependency>
  <groupId>org.apache.spark</groupId>
  <artifactId>spark-streaming_2.10</artifactId>
  <version>1.6.0</version>
    </dependency>
  <dependency>
  <groupId>org.apache.spark</groupId>
  <artifactId>spark-streaming-kafka_2.10</artifactId>
  <version>1.6.0</version>
    </dependency>
  <dependency>
    <groupId>com.google.code.gson</groupId>
    <artifactId>gson</artifactId>
    <version>2.5</version>
</dependency>
  <dependency>
<groupId>com.databricks</groupId>
<artifactId>spark-csv_2.10</artifactId>
<version>1.5.0</version>
  </dependency>
  </dependencies>
  <build>
  <sourceDirectory>src</sourceDirectory>
  <plugins>
  <plugin>
  <artifactId>maven-compiler-plugin</artifactId>
  <version>3.3</version>
  <configuration>
 <source>1.8</source>
 <target>1.8</target>
 </configuration>
    </plugin>
 </plugins>
  </build>
</project>
Indexing Data in Solr
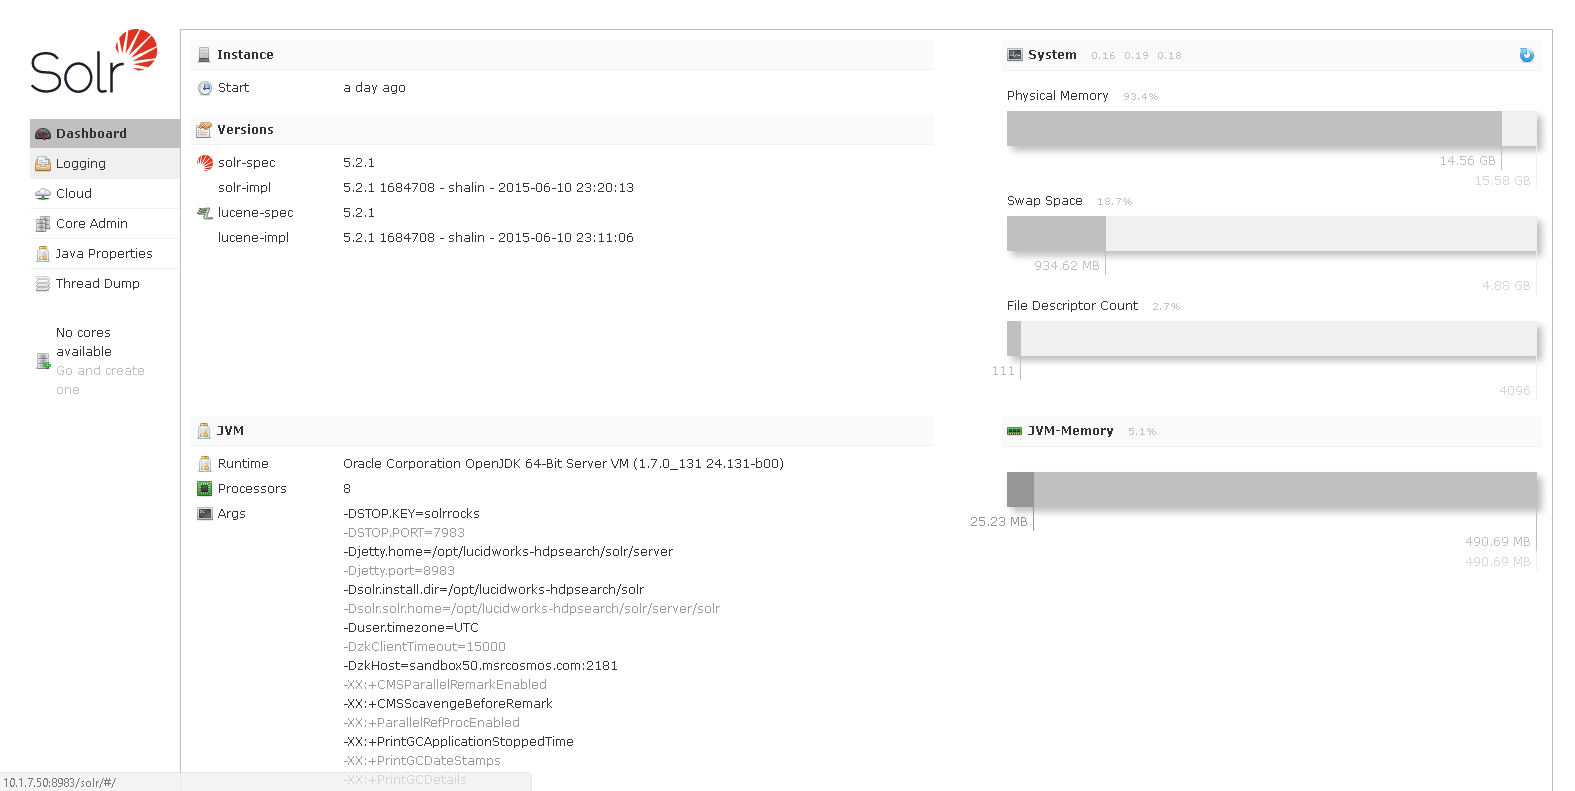
To start Solr, open the terminal and run the below commands:
Cd /opt/lucidworks-hdpsearch/solr
./bin/solr start -c –z hostname:2181
Open the following Solr UI in a browser: http://localhost:8983/solr.
Create core in Solr:
./bin/solr create -c weather -d data_driven_schema_configs -n weatherCollConfigsIngest data into Solr from the CSV file generated earlier from the Spark application by using the following code:
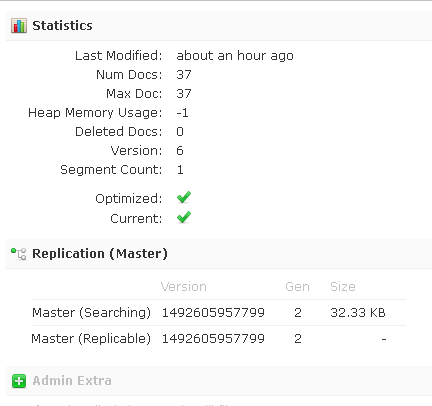
./bin/post -c weather /opt/weather.csvNow, data is loaded into Solr core.
You can check data inserted into the core in the web UI:
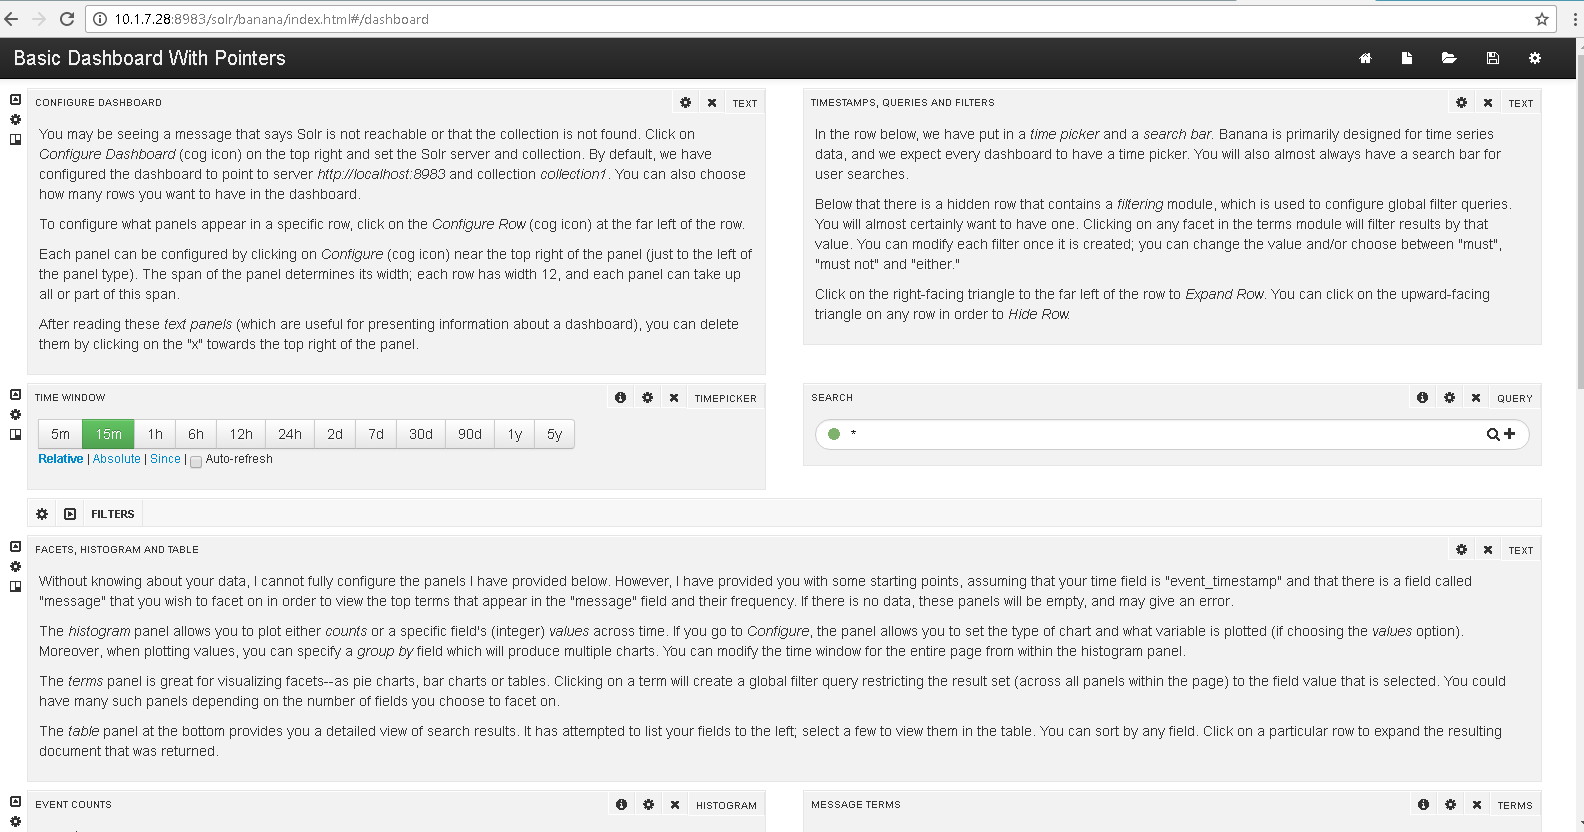
Open the Banana Web Dashboard using http://localhost:8983/solr/banana/index.html.
It will show a default introduction dashboard similar to the image below:
Click New in the top right corner to create a new dashboard. It will prompt you to click a type of dashboard:
Time-series dashboard if any timestamp column contains your core.
Non time-series dashboard if you don’t have any timestamp columns.
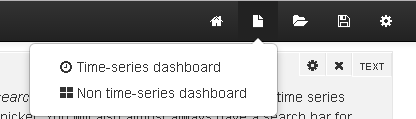
As our data contains timestamp values, Time-series Dashboard.
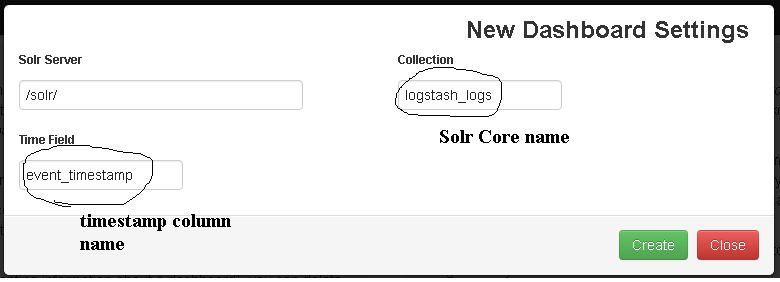
Click Create to create a new dashboard. A successfully created dashboard will look something like this:
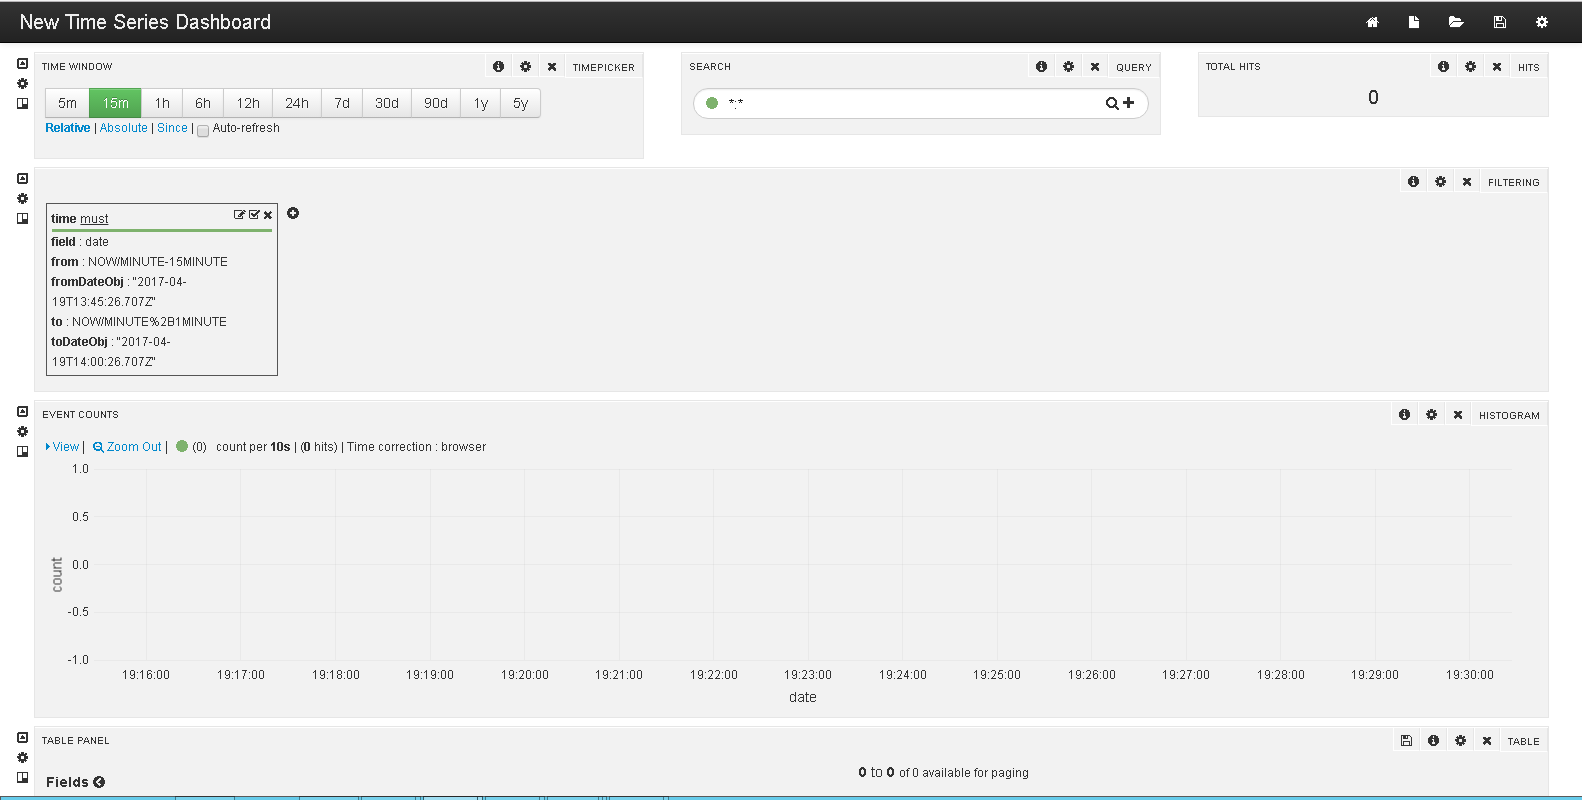
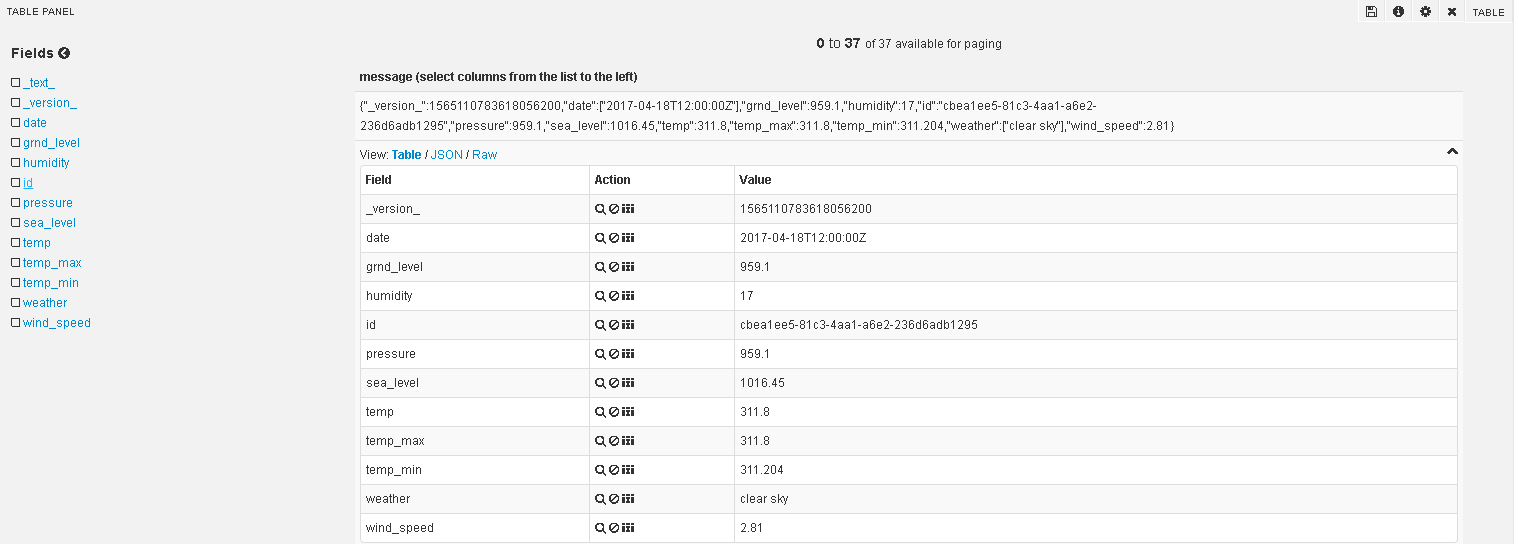
Change the Time Window to select the number of rows required to be shown. Go to Table Panel to check whether your data is correctly parsed or not. If everything is fine, your data will be displayed as follows:
Go to Dashboard settings at the top right corner of the web page:
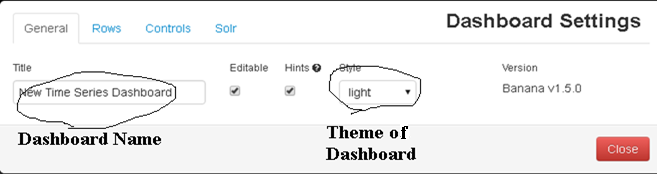
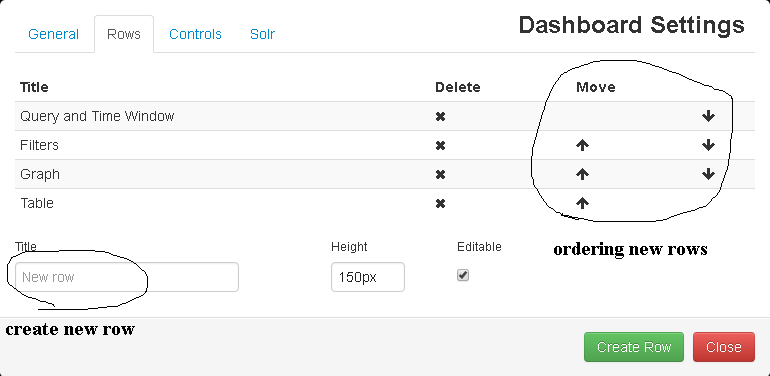
The webpage will prompt you to create a new panel. Click on that and it will take you to the row settings.

Click on Add panel to empty row.
Select your desired panel from the list. It will show you options based on its properties.
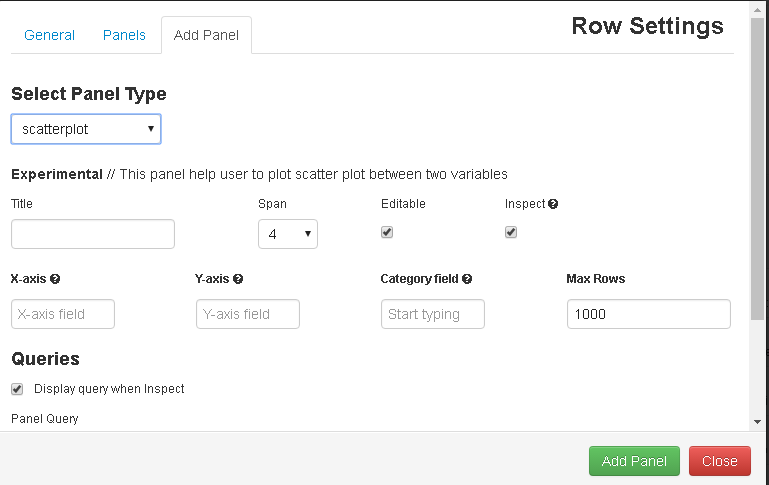
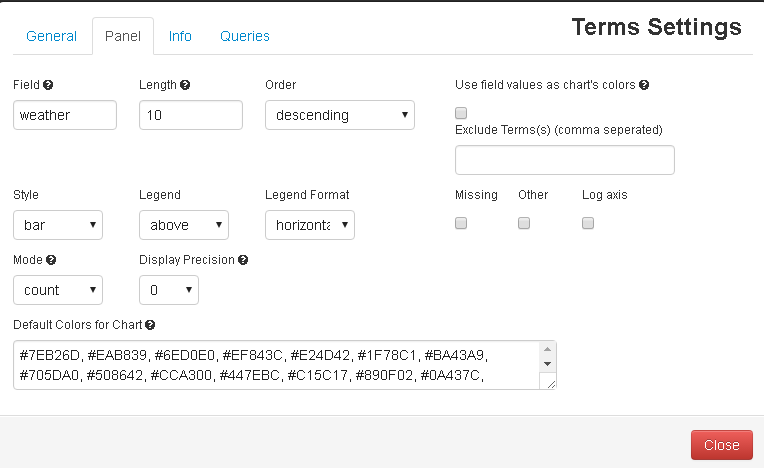
Fill all the required fields to get a get graph:
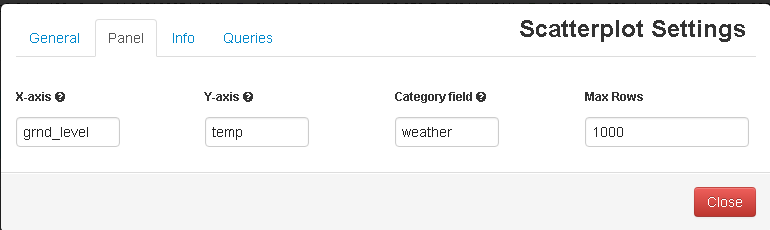
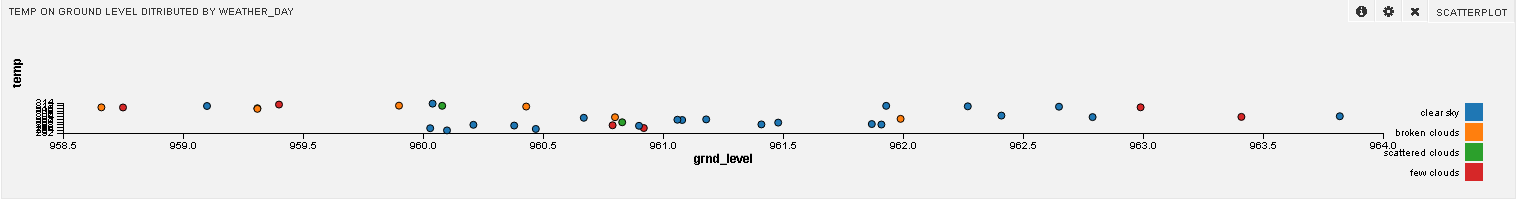
The below diagram shows temperature levels on ground level distributed by the type of weather that day:
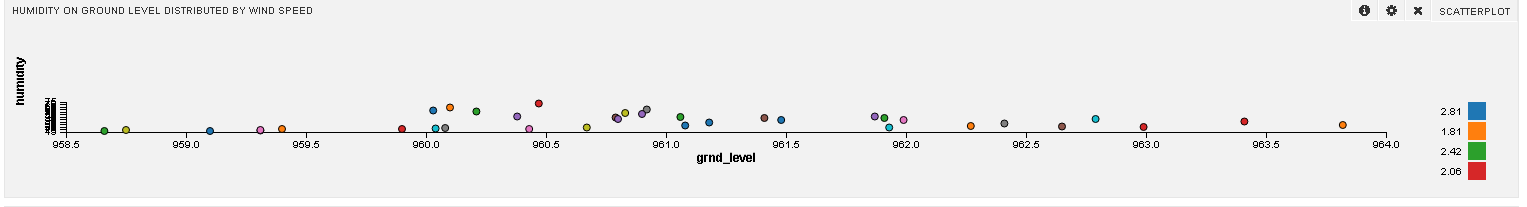
Similarly, the humidity on ground level is distributed by wind speed:
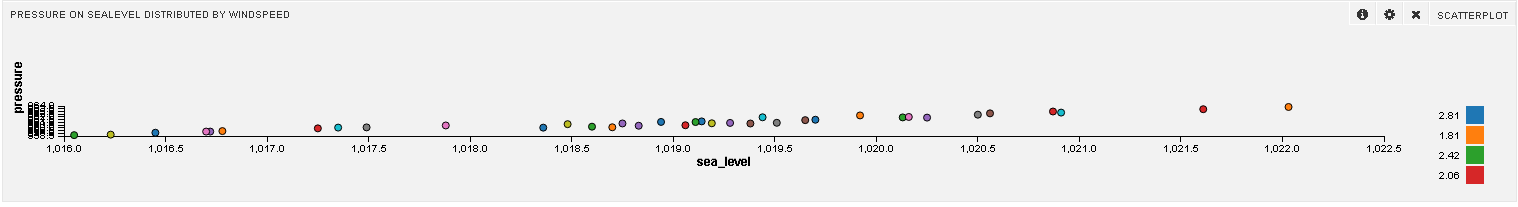
Pressure on sea-level distributed by wind speed:
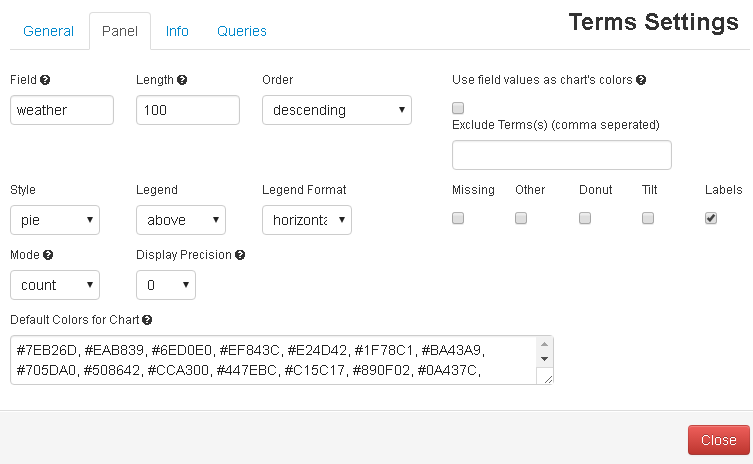
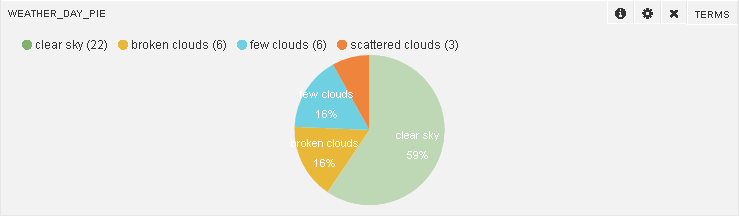
Follow the below configurations to get a pie chart of various weather days:
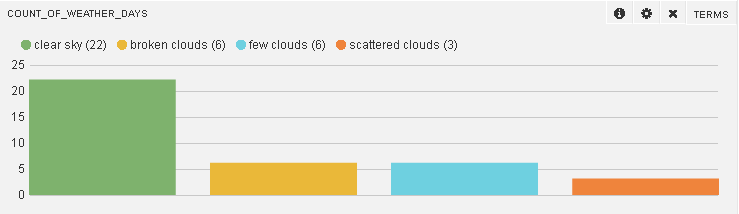
You will also see the count of different types of weather days (whose data is recorded):
I hope this gives you enough perspective on putting HDF to (very effective) use!
Opinions expressed by DZone contributors are their own.
Comments