Telemetry Pipelines Workshop: Integrating Fluent Bit With OpenTelemetry, Part 2
Take a look at integrating Fluent Bit with OpenTelemetry for use cases where this connectivity in your telemetry data infrastructure is essential.
Join the DZone community and get the full member experience.
Join For FreeAre you ready to get started with cloud-native observability and telemetry pipelines?
This article is part of a series exploring a workshop guiding you through the open source project Fluent Bit, what it is, a basic installation, and setting up the first telemetry pipeline project. Learn how to manage your cloud-native data from source to destination using the telemetry pipeline phases covering collection, aggregation, transformation, and forwarding from any source to any destination.
In the previous article in this series, we looked at the first part of integrating Fluent Bit with OpenTelemetry for use cases where this connectivity in your telemetry data infrastructure is essential. In this next article, we and finalize our integration of Fluent Bit with OpenTelemetry for use cases where this connectivity in your telemetry data infrastructure is essential.
You can find more details in the accompanying workshop lab.
There are many reasons why an organization might want to pass their telemetry pipeline output onwards to OpenTelemetry (OTel), specifically through an OpenTelemetry Collector. To facilitate this integration, Fluent Bit from the release of version 3.1 added support for converting its telemetry data into the OTel format.
In this article, we'll finalize our solution for integrating Fluent Bit with OpenTelemetry. Note that we pick up where we left off previously, so if you have not yet read the previous article, you should go back and do so.
Pushing to the Collector
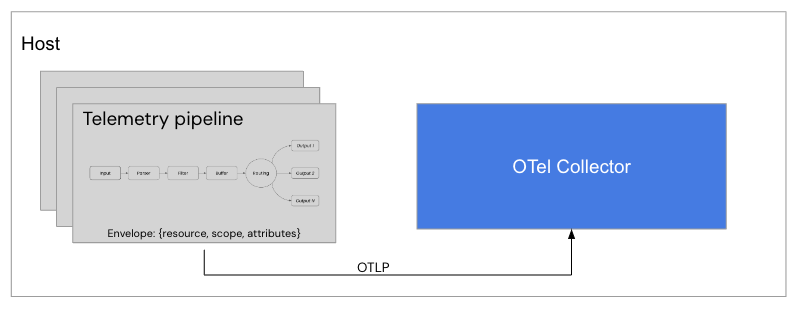
When sending telemetry data in the OTel Envelope, we are using the OpenTelemetry Protocol (OTLP), which is the standard to ingest into a collector. The next step will be for us to configure an OTel Collector to receive telemetry data and point our Fluent Bit instances at that collector as depicted in this diagram:

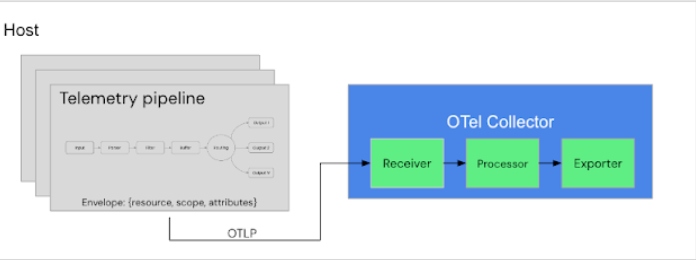
There are three things to configure when processing telemetry data through an OTel Collector: a receiver, processor, and exporter as shown below. Let's get started with our own OTel Collector configuration:

The configuration of our collector receivers section is where we define a delivery destination that Fluent Bit can push its telemetry (logs) to. Create a new configuration file workshop-otel.yaml and add the following to provide an OLTP endpoint at localhost:4317 as shown:
# This file is our workshop OpenTelemetry configuration.
receivers:
  otlp:
    protocols:
      http:
        endpoint: 0.0.0.0:4317
Now expand the configuration file workshop-otel.yaml with an exporters section to define where our telemetry (logs) will be sent after processing. In this case, we want to provide output to the console as follows:
# This file is our workshop OpenTelemetry configuration.
receivers:
  otlp:
    protocols:
      http:
        endpoint: 0.0.0.0:4317

exporters:
  logging:
    loglevel: info
Finally, we added a service section to complete our collector configuration. Here we are defining the level of log reporting (info) and creating a collector pipeline for our logs. We assign specific receivers and exporters so that we are receiving through the OTLP protocol (using our Fluent Bit OTel Envelope) and exporting to the console only:
# This file is our workshop OpenTelemetry configuration.
receivers:
  otlp:
    protocols:
      http:
        endpoint: 0.0.0.0:4317

exporters:
  logging:
    loglevel: info

service:
  telemetry:
    logs:
      level: debug
  pipelines:
    logs:
      receivers: [otlp]
      exporters: [logging]
To verify the OTel Collector configuration using a container installation, we first build a new container that uses our new configuration. Create a new file Buildfile-otel and set it up as follows:
FROM otel/opentelemetry-collector-contrib:0.105.0

COPY workshop-otel.yaml /etc/otel-collector-contrib/workshop-otel.yaml

CMD [ "--config", "/etc/otel-collector-contrib/workshop-otel.yaml"]
Now we'll build a new container image, naming it with a version tag as follows using the Buildfile-otel and assuming you are in the same directory:
$ podman build -t workshop-otel:v0.105.0 -f Buildfile-otel

STEP 1/3: FROM otel/opentelemetry-collector-contrib:0.105.0
Resolving "otel/opentelemetry-collector-contrib" using unqualified-search registries
   (/etc/containers/registries.conf.d/999-podman-machine.conf)
Trying to pull docker.io/otel/opentelemetry-collector-contrib:0.105.0...
Getting image source signatures
Copying blob sha256:50658aaad663b91752461d59f121b17d0fd7f859d9575edfa60b077771286a63
Copying blob sha256:3a40a3a6b6e2d53bc3df71d348344a451c6adc16b61742cebcba70352539a859
Copying blob sha256:8339825c9e32785bf25d2686ad61ed0bb338f4ca2d8e7d04dc17abe5fe1768ec
Copying config sha256:8920124fc5c615bbeeed5cdd2c55697b9430cd2100bea8e73aa7a36c8f645a90
Writing manifest to image destination
STEP 2/3: COPY workshop-otel.yaml /etc/otel-collector-contrib/workshop-otel.yaml
--> 845307d97fa9
STEP 3/3: CMD [ "--config", "/etc/otel-collector-contrib/workshop-otel.yaml"]
COMMIT workshop-otel:v0.105.0
--> da268a9ffa0d
Successfully tagged localhost/workshop-otel:v0.105.0
da268a9ffa0d27cf17d96af550d8d755973cbbb90db8866099fcc07b671d61e7
Run the collector using this container command, noting port 4317 has been mapped to receive telemetry data and it has a name otelcol:
$ podman run --rm -p 4317:4317 --name otelcol workshop-otel:v0.105.0
The console output should look something like this (scroll to the right to view longer lines). Note the highlighted line shows that the port is open and receiving on localhost:4317. This runs until exiting with CTRL+C:
2024-08-02T07:42:45.349Z    info    service@v0.105.0/service.go:116    Setting up own telemetry...
2024-08-02T07:42:45.349Z    info    service@v0.105.0/service.go:119    OpenCensus bridge is disabled for Collector telemetry and will be removed in a future version, use --feature-gates=-service.disableOpenCensusBridge to re-enable
2024-08-02T07:42:45.349Z    info    service@v0.105.0/telemetry.go:96    Serving metrics    {"address": ":8888", "metrics level": "Normal"}
2024-08-02T07:42:45.350Z    info    exporter@v0.105.0/exporter.go:280    Deprecated component. Will be removed in future releases.    {"kind": "exporter", "data_type": "logs", "name": "logging"}
2024-08-02T07:42:45.350Z    warn    common/factory.go:68    'loglevel' option is deprecated in favor of 'verbosity'. Set 'verbosity' to equivalent value to preserve behavior.    {"kind": "exporter", "data_type": "logs", "name": "logging", "loglevel": "info", "equivalent verbosity level": "Normal"}
2024-08-02T07:42:45.350Z    debug    receiver@v0.105.0/receiver.go:313    Beta component. May change in the future.    {"kind": "receiver", "name": "otlp", "data_type": "logs"}
2024-08-02T07:42:45.350Z    info    service@v0.105.0/service.go:198    Starting otelcol-contrib...    {"Version": "0.105.0", "NumCPU": 4}
2024-08-02T07:42:45.350Z    info    extensions/extensions.go:34    Starting extensions...
2024-08-02T07:42:45.350Z    info    otlpreceiver@v0.105.0/otlp.go:152    Starting HTTP server    {"kind": "receiver", "name": "otlp", "data_type": "logs", "endpoint": "0.0.0.0:4317"}
2024-08-02T07:42:45.350Z    info    service@v0.105.0/service.go:224    Everything is ready. Begin running and processing data.
2024-08-02T07:42:45.351Z    info    localhostgate/featuregate.go:63    The default endpoints for all servers in components have changed to use localhost instead of 0.0.0.0. Disable the feature gate to temporarily revert to the previous default.    {"feature gate ID": "component.UseLocalHostAsDefaultHost"}
...
Now we head back to our Fluent Bit pipeline to add an output destination to push our telemetry data from our pipeline to the collector endpoint. Add a second entry called opentelemetry to the exiting outputs section in our configuration file workshop-fb.yaml as shown (and be sure to save the file when done):
...
# This entry directs all tags (it matches any we encounter)
# to print to standard output, which is our console.
outputs:
  - name: stdout
    match: '*'
    format: json_lines

  # this entry is for pushing logs to an OTel collector.
  - name: opentelemetry
    match: '*'
    host: ${OTEL_HOST}
    port: 4317
    logs_body_key_attributes: true  # allows for OTel attribute modification.
Note that the host attribute has been set to a variable which will be filled with a command line value when we run the container. The command will provide a lookup of the OTel collector container IP address so that Fluent Bit can find it.
Now we'll build a new container image, naming it with a version tag, as follows using the Buildfile-fb and assuming you are in the same directory:
$ podman build -t workshop-fb:v14 -f Buildfile-fb

STEP 1/3: FROM cr.fluentbit.io/fluent/fluent-bit:3.1.4
STEP 2/3: COPY ./workshop-fb.yaml /fluent-bit/etc/workshop-fb.yaml
--> b4ed3356a842
STEP 3/3: CMD [ "fluent-bit", "-c", "/fluent-bit/etc/workshop-fb.yaml"]
COMMIT workshop-fb:v4
--> bcd69f8a85a0
Successfully tagged localhost/workshop-fb:v14
bcd69f8a85a024ac39604013bdf847131ddb06b1827aae91812b57479009e79a
Run this pipeline using this container command, which includes a search for the internal container IP address to pass as a variable to our configuration using the variable OTEL_HOST:
$ podman run --rm -e OTEL_HOST=$(podman inspect -f "{{.NetworkSettings.IPAddress}}"otelcol) workshop-fb:v14
The console output from the Fluent Bit pipeline looks something like this, IF and ONLY IF you have the OTel collector container running at the same time! Note that every time a log event is ingested, it's processed into an OTel Envelope with three lines in the console, and then sent to the collector on port 4317. Let's go back to the OTel collector console and check ingestion:
...
[2024/08/02 14:45:53] [ info] [input:dummy:dummy.0] initializing
[2024/08/02 14:45:53] [ info] [input:dummy:dummy.0] storage_strategy='memory' (memory only)
[2024/08/02 14:45:53] [ info] [output:stdout:stdout.0] worker #0 started
[2024/08/02 14:45:53] [ info] [sp] stream processor started
{"date":4294967295.0,"resource":{},"scope":{}}
{"date":1722609954.095659,"service":"backend","log_entry":"Generating a 200 success code."}
{"date":4294967294.0}
[2024/08/02 14:45:55] [ info] [output:opentelemetry:opentelemetry.1] 10.88.0.3:4317, HTTP status=200
{"date":4294967295.0,"resource":{},"scope":{}}
{"date":1722609955.096505,"service":"backend","log_entry":"Generating a 200 success code."}
{"date":4294967294.0}
[2024/08/02 14:45:56] [ info] [output:opentelemetry:opentelemetry.1] 10.88.0.3:4317, HTTP status=200
{"date":4294967295.0,"resource":{},"scope":{}}
...
The console output from the OTel collector looks something like this, with one line for each log event sent from our Fluent Bit-based pipeline. This means it's working fine! What we don't see is the log event details, so let's add a new exporter to send our log data to a file.
...
2024-08-02T14:45:55.110Z  info  LogsExporter  {"kind": "exporter", "data_type": "logs", "name": "logging", "resource logs": 1, "log records": 1}
2024-08-02T14:45:56.100Z  info  LogsExporter  {"kind": "exporter", "data_type": "logs", "name": "logging", "resource logs": 1, "log records": 1}
2024-08-02T14:45:57.099Z  info  LogsExporter  {"kind": "exporter", "data_type": "logs", "name": "logging", "resource logs": 1, "log records": 1}
...
Adding File Output
Stop the OTel collector container, open the collector configuration file workshop-otel.yaml, and add the following to write log output to a file in /tmp/output.json. We also need to add the new exporter in the pipeline's section for logs as shown below:
...
exporters:
  file:
    path: /tmp/output.json
  logging:
    loglevel: info

service:
  telemetry:
    logs:
      level: debug
  pipelines:
    logs:
      receivers: [otlp]
      exporters: [file, logging]
Now we'll build a new OTel collector container image, naming it with a version tag as follows using the Buildfile-otel and assuming you are in the same directory:
$ podman build -t workshop-otel:v0.105.0 -f Buildfile-otel

STEP 1/3: FROM otel/opentelemetry-collector-contrib:0.105.0
Resolving "otel/opentelemetry-collector-contrib" using unqualified-search registries
   (/etc/containers/registries.conf.d/999-podman-machine.conf)
Trying to pull docker.io/otel/opentelemetry-collector-contrib:0.105.0...
Getting image source signatures
Copying blob sha256:50658aaad663b91752461d59f121b17d0fd7f859d9575edfa60b077771286a63
Copying blob sha256:3a40a3a6b6e2d53bc3df71d348344a451c6adc16b61742cebcba70352539a859
Copying blob sha256:8339825c9e32785bf25d2686ad61ed0bb338f4ca2d8e7d04dc17abe5fe1768ec
Copying config sha256:8920124fc5c615bbeeed5cdd2c55697b9430cd2100bea8e73aa7a36c8f645a90
Writing manifest to image destination
STEP 2/3: COPY workshop-otel.yaml /etc/otel-collector-contrib/workshop-otel.yaml
--> 845307d97fa9
STEP 3/3: CMD [ "--config", "/etc/otel-collector-contrib/workshop-otel.yaml"]
COMMIT workshop-otel:v0.105.0
--> da268a9ffa0d
Successfully tagged localhost/workshop-otel:v0.105.0
da268a9ffa0d27cf17d96af550d8d755973cbbb90db8866099fcc07b671d61e7
Run the collector using this container command, noting port 4317 has been mapped to receive telemetry data, it has the name otelcol, and we are now mapping the internal container /tmp directory to our local directory for the output.json file:
$ podman run --rm -p 4317:4317 --name otelcol -v ./:/tmp workshop-otel:v0.105.0
While the collector is waiting on telemetry data, we can (re)run the pipeline to start ingesting, processing, and pushing log events to our collector:
$ podman run --rm -e OTEL_HOST=$(podman inspect -f "{{.NetworkSettings.IPAddress}}" otelcol) workshop-fb:v14
Verify that the pipeline with Fluent Bit is ingesting, processing, and forwarding logs (console):
# Pipeline with Fluent Bit ingest, processing and output.
...
{"date":4294967295.0,"resource":{},"scope":{}}
{"date":1722611305.09833,"service":"backend","log_entry":"Generating a 200 success code."}
{"date":4294967294.0}
[2024/08/02 15:08:26] [ info] [output:opentelemetry:opentelemetry.1] 10.88.0.10:4317, HTTP status=200
...
Check that the collector is receiving these logs (console):
# OTel collector ingesting events.
...
2024-08-02T14:45:55.110Z    info    LogsExporter    {"kind": "exporter", "data_type": "logs", "name": "logging", "resource logs": 1, "log records": 1}
...
Finally, verify that the collector is exporting to output.json file as shown below:
# Viewing file output.json
$ tail -f ./output.json

{"resourceLogs":[{"resource":{},"scopeLogs":[{"scope":{},"logRecords":[{"timeUnixNano":"1722611307093849438",
"body":{"kvlistValue":{"values":[{"key":"service","value":{"stringValue":"backend"}},{"key":"log_entry",
"value":{"stringValue":"Generating a 200 success code."}}]}},"traceId":"","spanId":""}]}]}]}
...
A more visually pleasing view of the JSON file can be achieved as follows with each log event presented in structured JSON:
# Viewing structured JSON file output.json using jq.
$ tail -f ./output.json | jq

{
  "resourceLogs": [
    {
      "resource": {},
      "scopeLogs": [
        {
          "scope": {},
          "logRecords": [
            {
              "timeUnixNano": "1722611323093561678",
              "body": {
                "kvlistValue": {
                  "values": [
                    {
                      "key": "service",
                      "value": { "stringValue": "backend"}
                    },
                    {
                      "key": "log_entry",
                      "value": {
                        "stringValue": "Generating a 200 success code."
                      }
                    }
                  ]
                }
              },
                "traceId": "", "spanId": ""
              ...
This completes our use case for this article, be sure to explore this hands-on experience with the accompanying workshop lab, linked earlier in the article.
What's Next?
This article walked us through the second part of integrating Fluent Bit with OpenTelemetry for use cases where this connectivity in your telemetry data infrastructure is essential.
Stay tuned for more hands-on material to help you with your cloud-native observability journey.
Published at DZone with permission of Eric D. Schabell, DZone MVB. See the original article here.
Opinions expressed by DZone contributors are their own.

Comments