Integrating FluxNinja Aperture With Nginx for Effective Load Management
Discover how FluxNinja Aperture helps manage high e-commerce website traffic by integrating with Nginx Gateway. Avoid downtime and lost revenue.
Join the DZone community and get the full member experience.
Join For FreeToday, everything is available online, and people tend to turn to the internet for even the smallest things. We see new products and websites popping up every day, catering to specific needs, from groceries to online studying. This leads to an increasing number of users coming online to use these services, leading to a surge in traffic on websites and web applications.
When launching a product or website, we often have estimates, but sometimes these estimates are exceeded, leading to overload scenarios. For instance, after the announcement of ChatGPT 3.5, there was a massive influx of traffic and interest from people all around the world. The sudden surge of visitors surpassed their limits and buffers, leading to website downtime. In such situations, it is essential to have load management in place to avoid possible business loss.
As businesses grow and expand, it becomes increasingly important to ensure that their web applications and websites can handle the influx of traffic and demand without sacrificing performance or reliability. Even big organizations are still suffering from these downtime issues, which highlights the need for an intelligent load management platform.
That's where FluxNinja Aperture comes in. In this blog post, we'll explore how Aperture can help manage high traffic on e-commerce websites by integrating with Nginx Gateway. With Aperture's advanced load management techniques, such as dynamic rate limiting and prioritized load shedding, you can ensure the reliability and stability of your web application, even during periods of high traffic.
The Challenge: Managing High-Traffic E-Commerce Website With Nginx
- Unpredictable traffic spikes: E-commerce websites often experience sudden surges in demand, especially during holidays or special events. These traffic spikes can put a strain on the website, leading to slow response times, server crashes, or downtime.
- Limited resources: E-commerce websites usually have limited resources to handle traffic spikes and sudden surges in demand. This can lead to a lack of scalability and can make it challenging to provide a consistent user experience.
- Dynamic traffic patterns: E-commerce websites can experience unpredictable traffic patterns that vary significantly throughout the day, week, or month. Managing this dynamic traffic can be challenging, especially during peak periods.
- Performance and reliability: E-commerce websites need to maintain a high level of performance and reliability to provide a good user experience. Slow response times, errors, or downtime can lead to lost revenue and damage to the brand's reputation.
If these challenges are not managed effectively, they can lead to significant consequences such as downtime, lost revenue, and a negative impact on the brand's reputation.
To overcome these challenges effectively, let's examine a concrete setup that can be implemented.
Solving the Load Management Challenge
As we have seen major challenges and their consequences of it, Now we will look at how FluxNinja Aperture resolves these challenges for you. Before that, discuss in brief what exactly it is.
FluxNinja Aperture is a load management platform that integrates with Nginx Gateway to provide advanced load management techniques such as load shedding, rate limiting, dynamic rate limiting, concurrency limiting, and prioritized load shedding and workload prioritization. With Aperture, high-traffic websites can effectively manage the challenges associated with high-traffic and unpredictable traffic.
These are some ways Aperture can help you solve load management challenges:
- Load shedding: Aperture can identify and shed traffic that is not critical or high-priority, allowing critical traffic to pass through smoothly.
- Rate limiting: Aperture can limit the number of requests from a particular IP address or API, preventing excessive traffic from overwhelming the website.
- Dynamic rate limiting: Aperture can adjust the rate limiting based on the current traffic patterns to provide a balance between maintaining website availability and preventing overload.
- Concurrency limiting: Aperture can limit the number of concurrent connections to prevent resource exhaustion and maintain website stability.
- Prioritized load shedding: Aperture can prioritize the shedding of non-critical traffic based on pre-defined criteria, ensuring critical traffic can pass through without disruption.
- Workload prioritization: Aperture can prioritize certain workloads, ensuring that critical processes are prioritized over less important ones.
To configure one of the strategies in use with Nginx Gateway and Aperture, let's explore the steps involved.
Integrating Aperture With Nginx Gateway
To begin with, integrating Aperture, you need to verify prerequisites are satisfied; Here, I’m assuming you have already installed Aperture Controller and Agent in your setup before jumping into Flow Control Gateway Integration prerequisites.
For an overview, you need to ensure you have Nginx Server, lua-nginx-module enabled, and LuaRocks need to be configured. If you don’t know how to configure these things, head out to the documentation mentioned earlier.
To Integrate Aperture with Nginx Gateway, these are the high-level steps you need to perform:
Install the Aperture Lua module: The opentelemetry-lua SDK needs to be installed beforehand to install the Aperture Lua module. Check out the Nginx Integration doc for detailed steps.
Configure Nginx: This involves adding certain blocks of code to the Nginx configuration file to initialize and execute the Aperture Lua module. Below is an example of these blocks -
Plain Texthttp { ... init_by_lua_block { access = require "aperture-plugin.access" log = require "aperture-plugin.log" } access_by_lua_block { local authorized_status = access(ngx.var.destination_hostname, ngx.var.destination_port) if authorized_status ~= ngx.HTTP_OK then return ngx.exit(authorized_status) end } log_by_lua_block { log() } server { listen 80; proxy_http_version 1.1; location /service1 { set $destination_hostname "service1-demo-app.demoapp.svc.cluster.local"; set $destination_port "80"; proxy_pass http://$destination_hostname:$destination_port/request; } ... } ... }init_by_lua_blockInitializes the moduleaccess_by_lua_blockExecutes the Aperture check for all servers and locations before the request is forwarded upstream.log_by_lua_blockForwards, the OpenTelemetry logs to Aperture for all servers and locations after the response is received from upstream.
Additionally, the Aperture Lua module needs the upstream address of the server using destination_hostname anddestination_portvariables, which need to be set from the Nginx location block.
Set Environment Variables:
APERTURE_AGENT_ENDPOINT— To connect to the Aperture Agent,APERTURE_CHECK_TIMEOUT— To specify the timeout for execution of the Aperture check.
Demo
In this demonstration, we will explore how rate-limiting escalation can assist an e-commerce website during unexpected high traffic. E-commerce websites typically have three types of users: crawlers, guests, and subscribed members. During periods of high traffic, the website may struggle to respond to each request without prioritization, leading to frustration among paying users.
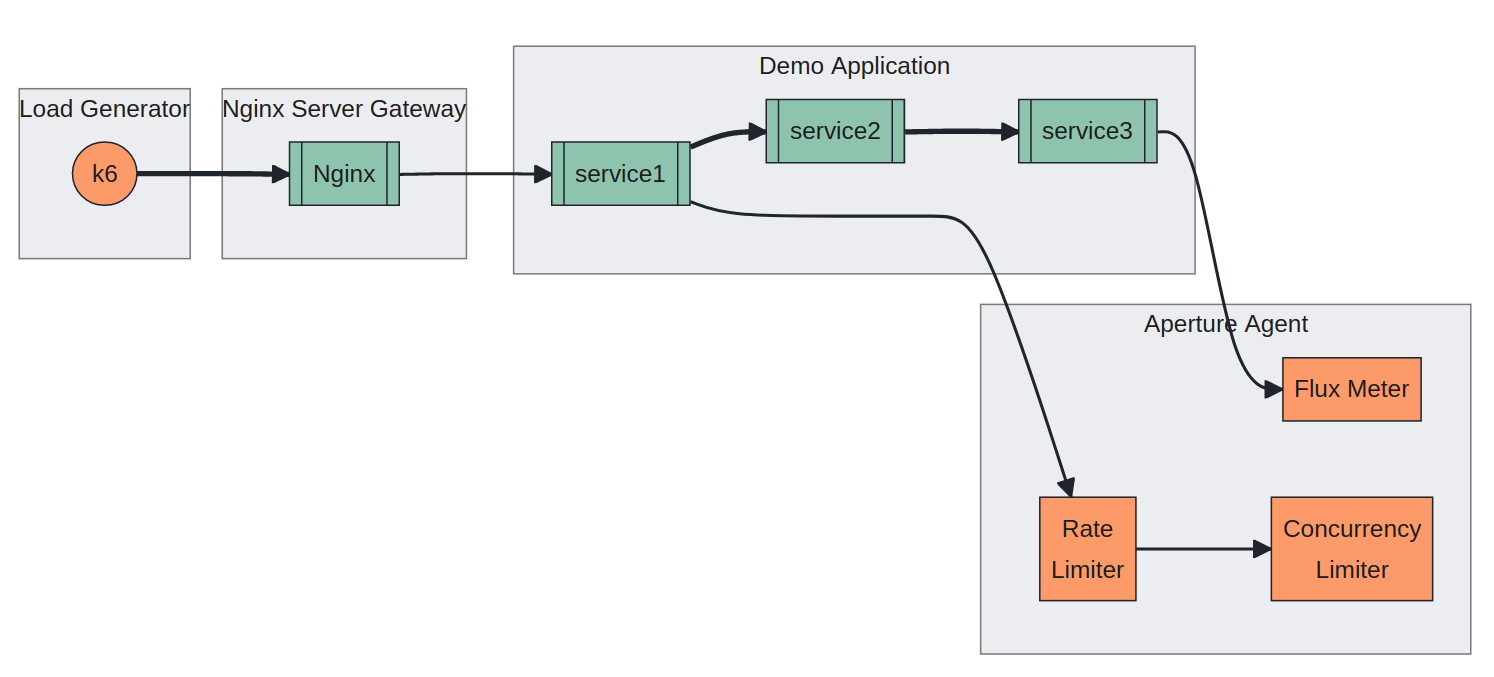
To demonstrate this scenario, we have set up a playground environment with a Nginx server forming a topology, as depicted below. To see it in live action, you can run the playground on your local machine by referring to the instructions in the Try Local Playground guide.
This playground is a Kubernetes-based environment that includes the necessary components, such as the Aperture Controller and Agent, already installed in the cluster.
Traffic Generator
The playground also has a load generator named wavepool-generator , which will help us mimic the high-traffic scenario for our use case.
For your information, the load generator is configured to generate the following traffic pattern for
subscriber,guestandbottraffic types:
- Ramp up to
5concurrent users in10s.- Hold at
5concurrent users for2m.- Ramp up to
30concurrent users in1m(overloadsservice3).- Hold at
30concurrent users for2m(overloadsservice3).- Ramp down to
5concurrent users in10s.- Hold at
5concurrent users for2m.
Nginx Configuration
I’ve configured Nginx in the demo by assigning a URL to each service and defining their respective locations. The Nginx deployment and configuration file can be found in the Aperture repo Playground Resources.
Below is a snippet of the Nginx configuration file, which includes the definition of worker processes, events, and the HTTP server. The server block defines the listening port and the proxy_pass directive, which is used to pass the requests to the respective services.
worker_processes auto;
pid /run/nginx.pid;

events {
    worker_connections 4096;
}

http {
    default_type application/octet-stream;
    resolver 10.96.0.10;

    sendfile on;
    keepalive_timeout 65;

    init_by_lua_block {
        access = require "aperture-plugin.access"
        log = require "aperture-plugin.log"
    }

    access_by_lua_block {
        local authorized_status = access(ngx.var.destination_hostname, ngx.var.destination_port)

        if authorized_status ~= ngx.HTTP_OK then
          return ngx.exit(authorized_status)
        end
    }

    log_by_lua_block {
        log()
    }

    server {
        listen 80;
        proxy_http_version 1.1;

        location /service1 {
            set $destination_hostname "service1-demo-app.demoapp.svc.cluster.local";
            set $destination_port "80";
            proxy_pass http://$destination_hostname:$destination_port/request;
        }

        location /service2 {
            set $destination_hostname "service2-demo-app.demoapp.svc.cluster.local";
            set $destination_port "80";
            proxy_pass http://$destination_hostname:$destination_port/request;
        }

        location /service3 {
            set $destination_hostname "service3-demo-app.demoapp.svc.cluster.local";
            set $destination_port "80";
            proxy_pass http://$destination_hostname:$destination_port/request;
        }
    }
}
Aperture Policy
Aperture includes a declarative policy that helps you customize how your system should react to a situation in a given policy; we have used a rate limiter and concurrency controller components.
You don’t need to worry about wiring stuff from scratch. Aperture follows a blueprint pattern where you can use the existing blueprints to build upon it. For example, in this policy, we’re using latency AIMD concurrency limiting blueprint and configuring to our needs.
This policy contains the following configurations:
- common: common configurations used across all policies. In this case, it specifies the name of the policy as "service1-demo-app".
- policy: Configurations specific to this policy. It includes:
- flux_meter: This configuration specifies the Flux Meter that will be used to measure the flow of traffic for the service. It uses a flow selector that matches traffic for a specific service and control point.
- classifiers: This configuration specifies a list of classification rules that will be used to classify traffic. It includes a flow selector that matches traffic for a specific service and control point and a rule that extracts a user_type value from the request headers.
- components: This configuration specifies a list of additional circuit components that will be used for this policy. It includes:
- decider: This component sets a signal to true for 30 seconds if the observed load multiplier is less than 1.0. This signal is used to determine if the request is from a bot or not.
- switcher: This component switches between two signals based on the value of the IS_BOT_ESCALATION signal that was set by the decider component. If the signal is true, the output signal is set to 0.0. If the signal is false, the output signal is set to 10.0.
- flow_control: This component applies rate limiting to traffic that matches a specific label. It uses a flow selector to match traffic for a specific service and control point based on the label
http.request.header.user_typewith valuebot.
- concurrency_controller: This configuration specifies the concurrency limiter flow selector and scheduler parameters. It uses the flow selector from the classifiers configuration and includes a scheduler that prioritizes traffic based on the
user_typelabel or thehttp.request.header.user_typeheader value. It also includes a load multiplier linear increment that is applied when the system is not in an overloaded state.
# yaml-language-server: $schema=../../../../blueprints/policies/latency-aimd-concurrency-limiting/gen/definitions.json
# Generated values file for policies/latency-aimd-concurrency-limiting blueprint
# Documentation/Reference for objects and parameters can be found at:
# https://docs.fluxninja.com/reference/policies/bundled-blueprints/policies/latency-aimd-concurrency-limiting

common:
  # Name of the policy.
  # Type: string
  # Required: True
  policy_name: "service1-demo-app"

policy:
  # Flux Meter.
  # Type: aperture.spec.v1.FluxMeter
  flux_meter:
    flow_selector:
      service_selector:
        # Service Name.
        # Type: string
        # Required: True
        service: service3-demo-app.demoapp.svc.cluster.local
      flow_matcher:
        # Control Point Name.
        # Type: string
        # Required: True
        control_point: ingress
  # List of classification rules.
  # Type: []aperture.spec.v1.Classifier
  classifiers:
    - flow_selector: &concurrency_flow_selector
        service_selector:
          service: service1-demo-app.demoapp.svc.cluster.local
        flow_matcher:
          control_point: ingress
      rules:
        user_type:
          extractor:
            from: request.http.headers.user-type
  # List of additional circuit components.
  # Type: []aperture.spec.v1.Component
  components:
    - decider:
        in_ports:
          lhs:
            signal_name: OBSERVED_LOAD_MULTIPLIER
          rhs:
            constant_signal:
              value: 1.0
        out_ports:
          output:
            signal_name: IS_BOT_ESCALATION
        operator: lt
        true_for: 30s
    - switcher:
        in_ports:
          switch:
            signal_name: IS_BOT_ESCALATION
          on_signal:
            constant_signal:
              value: 0.0
          off_signal:
            constant_signal:
              value: 10.0
        out_ports:
          output:
            signal_name: RATE_LIMIT
    - flow_control:
        rate_limiter:
          flow_selector:
            service_selector:
              service: service1-demo-app.demoapp.svc.cluster.local
            flow_matcher:
              label_matcher:
                match_labels:
                  "http.request.header.user_type": "bot"
              control_point: ingress
          in_ports:
            limit:
              signal_name: RATE_LIMIT
          parameters:
            limit_reset_interval: 1s
            label_key: http.request.header.user_id
          dynamic_config_key: rate_limiter
  concurrency_controller:
    # Concurrency Limiter flow selector.
    # Type: aperture.spec.v1.FlowSelector
    flow_selector: *concurrency_flow_selector
    # Scheduler parameters.
    # Type: aperture.spec.v1.SchedulerParameters
    scheduler:
      workloads:
        - parameters:
            priority: 50
          label_matcher:
            match_labels:
              user_type: guest
        - parameters:
            priority: 200
          label_matcher:
            match_labels:
              http.request.header.user_type: subscriber
    # Linear increment to load multiplier in each execution tick (0.5s) when the system is not in overloaded state.
    # Type: float64
    load_multiplier_linear_increment: 0.0025
Start the Playground
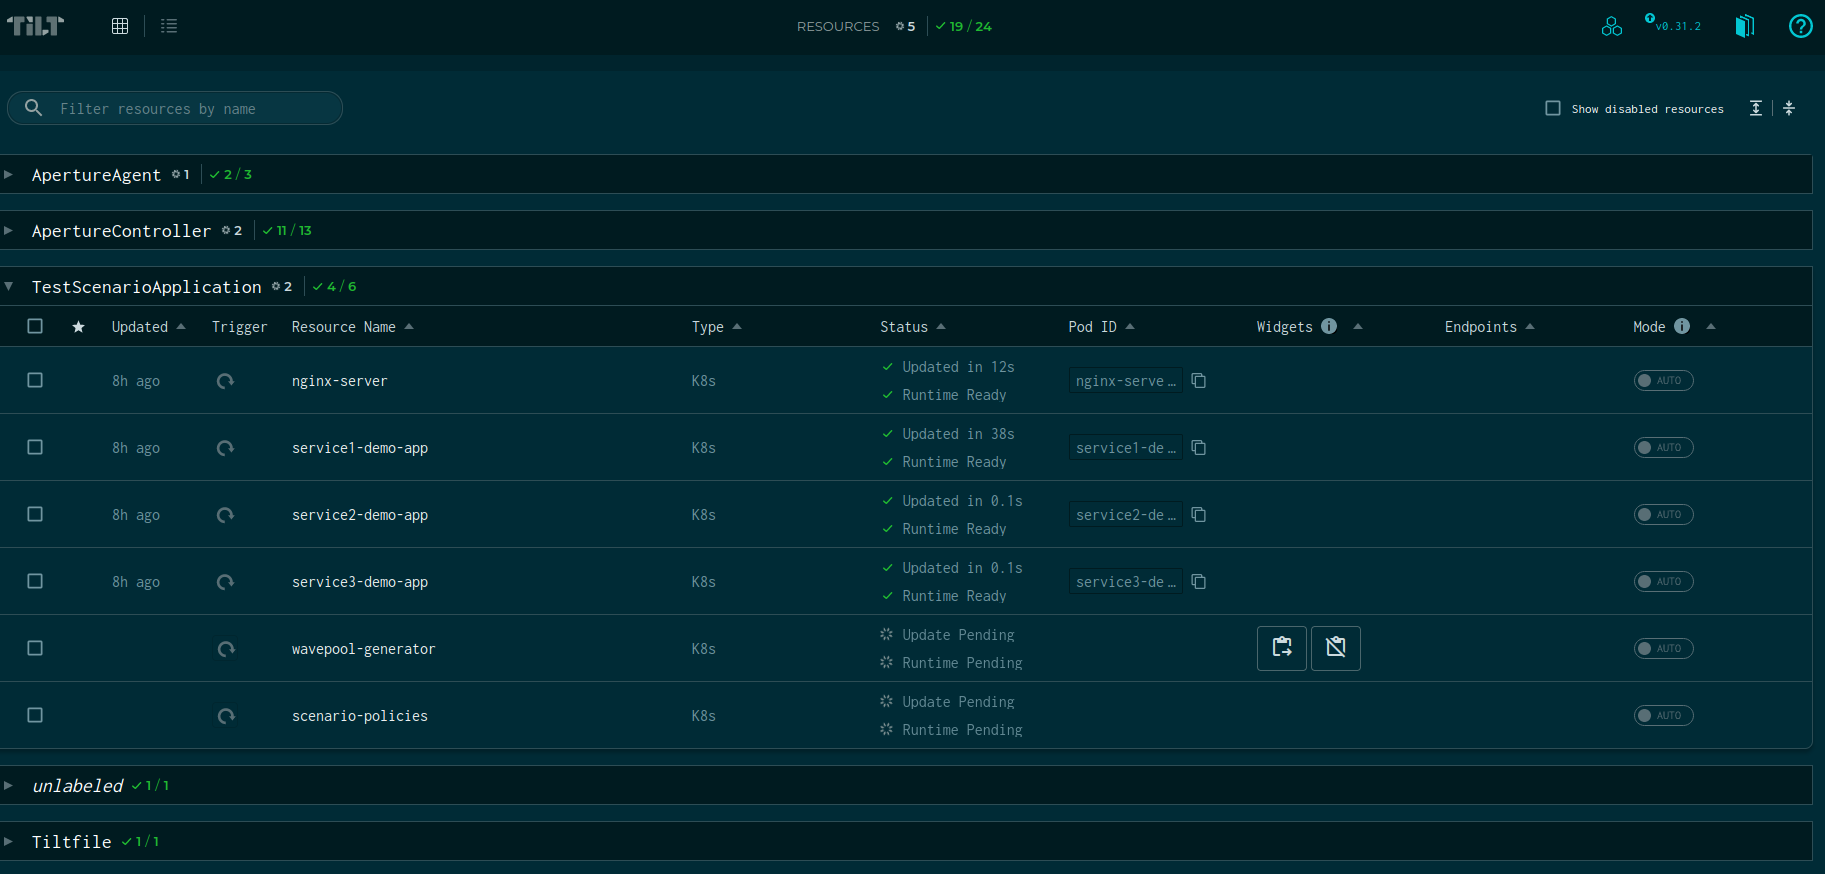
Once you understand the Nginx configuration and complete the playground prerequisites, run the following commands, and verify you’re within the cloned aperture repository.
# change directory to playground,
cd aperture/playground
tilt up -- --scenario=./scenarios/rate_limiting_escalation_nginx
This will bring up all services and resources. Now, head over to Grafana at localhost:3000/
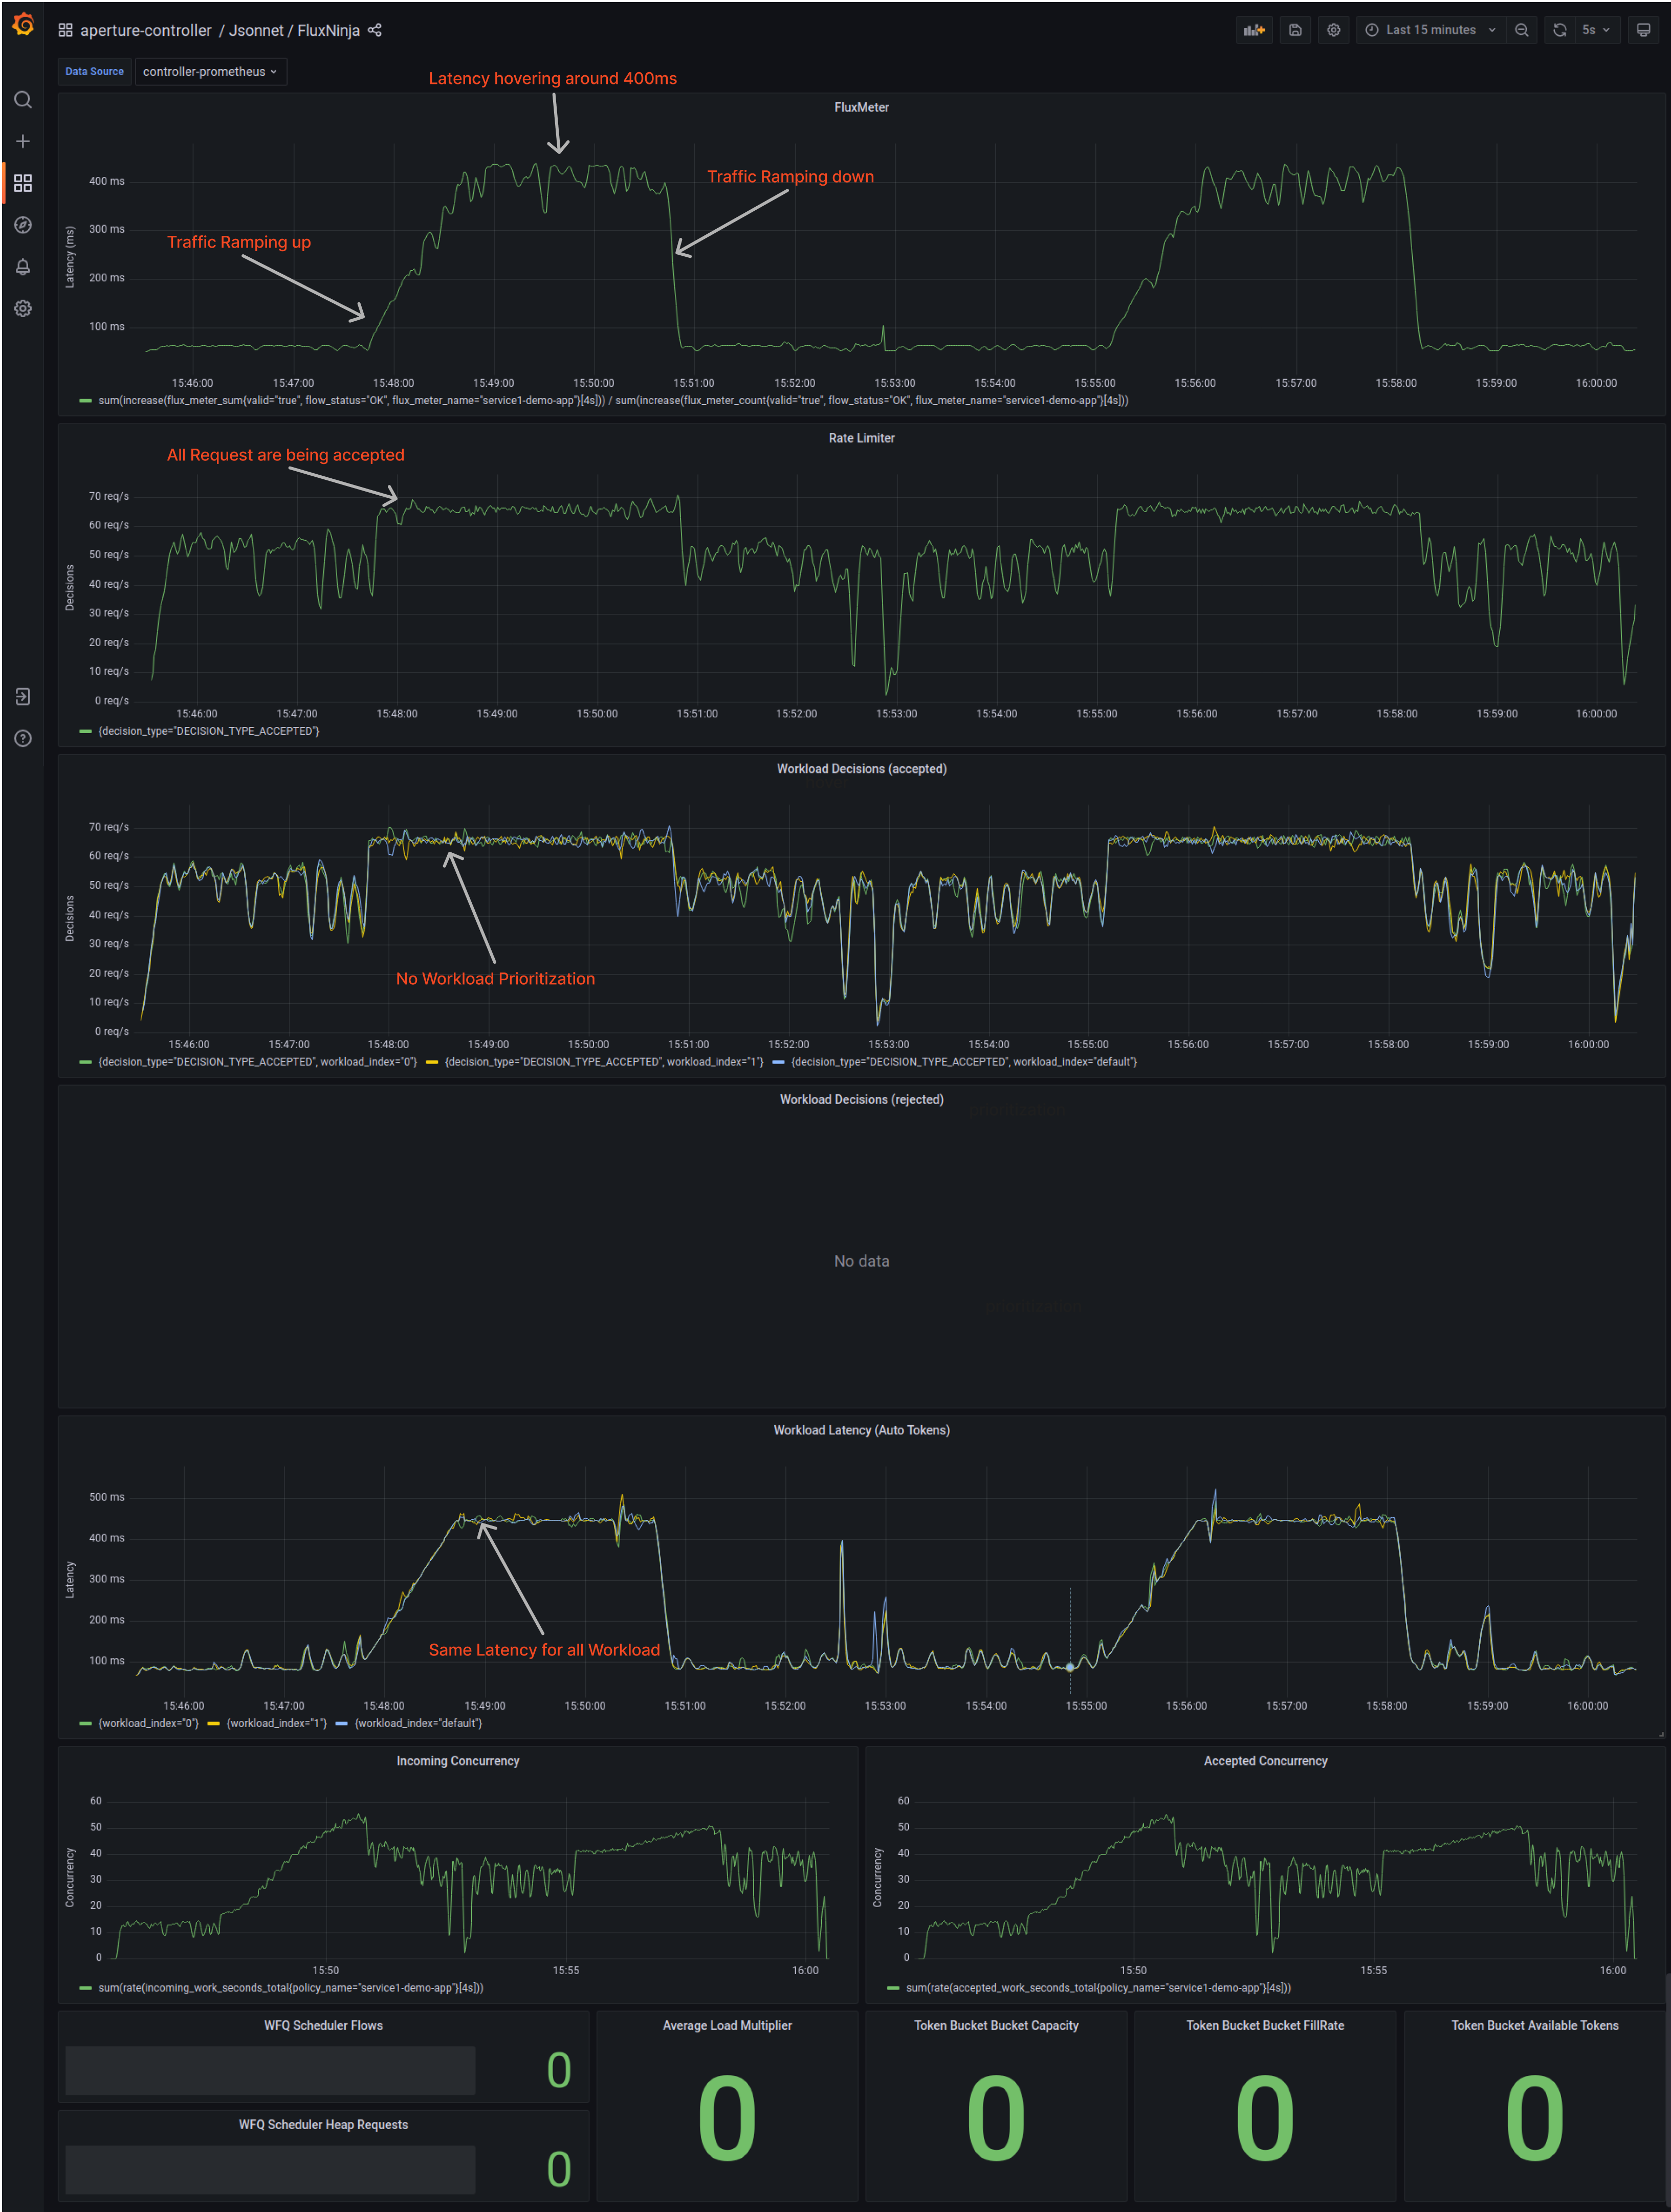
What Are the Consequences of Not Implementing Load Management?
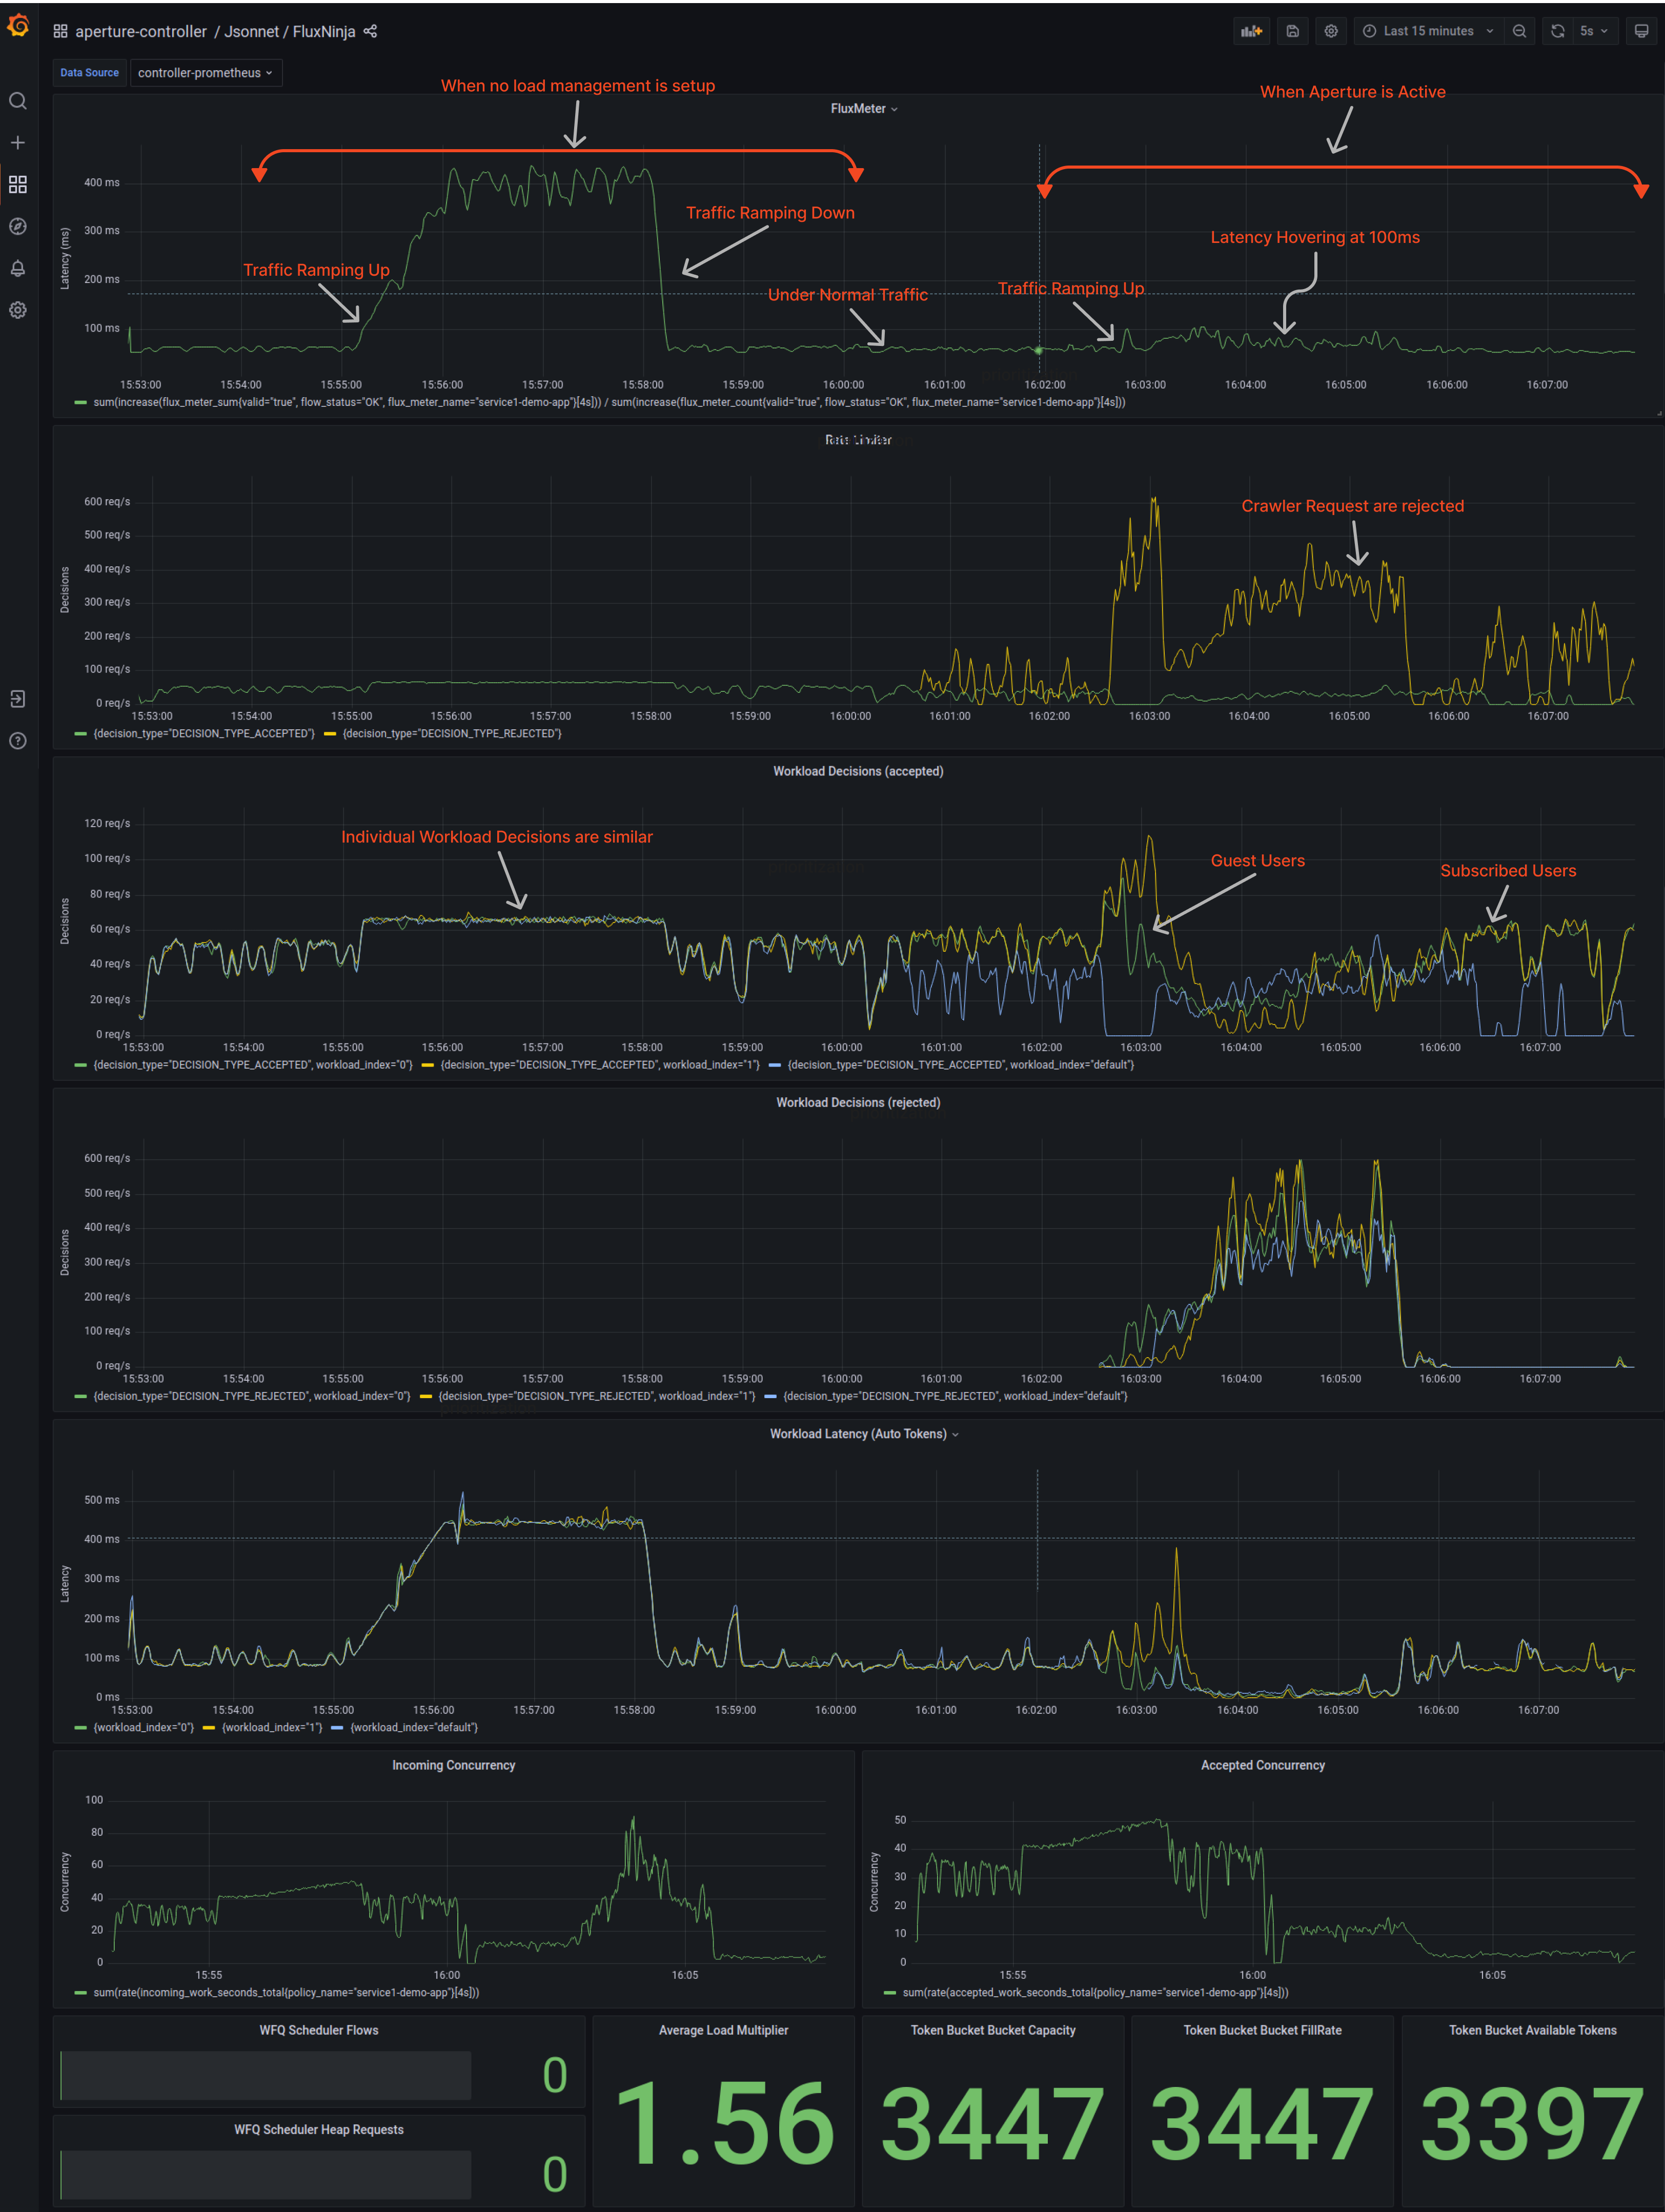
In the snapshot of the Grafana dashboard below, you can see that the latency increases to 400ms as the number of users increases. If the number of users continues to increase, it can overload the service, leading to fatal errors and cascading failure scenarios. Additionally, there is no prioritization between subscribed and guest users, and crawler traffic (also known as bot traffic) is allowed at all times, contributing to a rise in the overall latency of the service.
These are some of the key consequences —
- Increased latency and slower response times for users
- Increased server load and potential overload, leading to fatal errors and crashes
- Cascading failure scenarios that can affect other parts of the system
- No prioritization between different types of users, leading to poor user experience for some users
- Allowing bot traffic at all times, contributing to a rise in overall latency and server load
When Aperture Is Integrated With Nginx
Aperture is intelligent load management; it doesn’t just act on one signal but rather the overall performance of the system observing golden signals. Once we get Aperture in the picture, system performance significantly increases, and service latency hovers around 150ms.
Rate Limiting is limiting all the crawler traffic based on label key as configured in the policy. We can see how well the system is prioritizing the workload for each user type, i.e., subscribed and guest.
Latency for individual workloads is significantly dropped from ~ 400ms to 200ms.
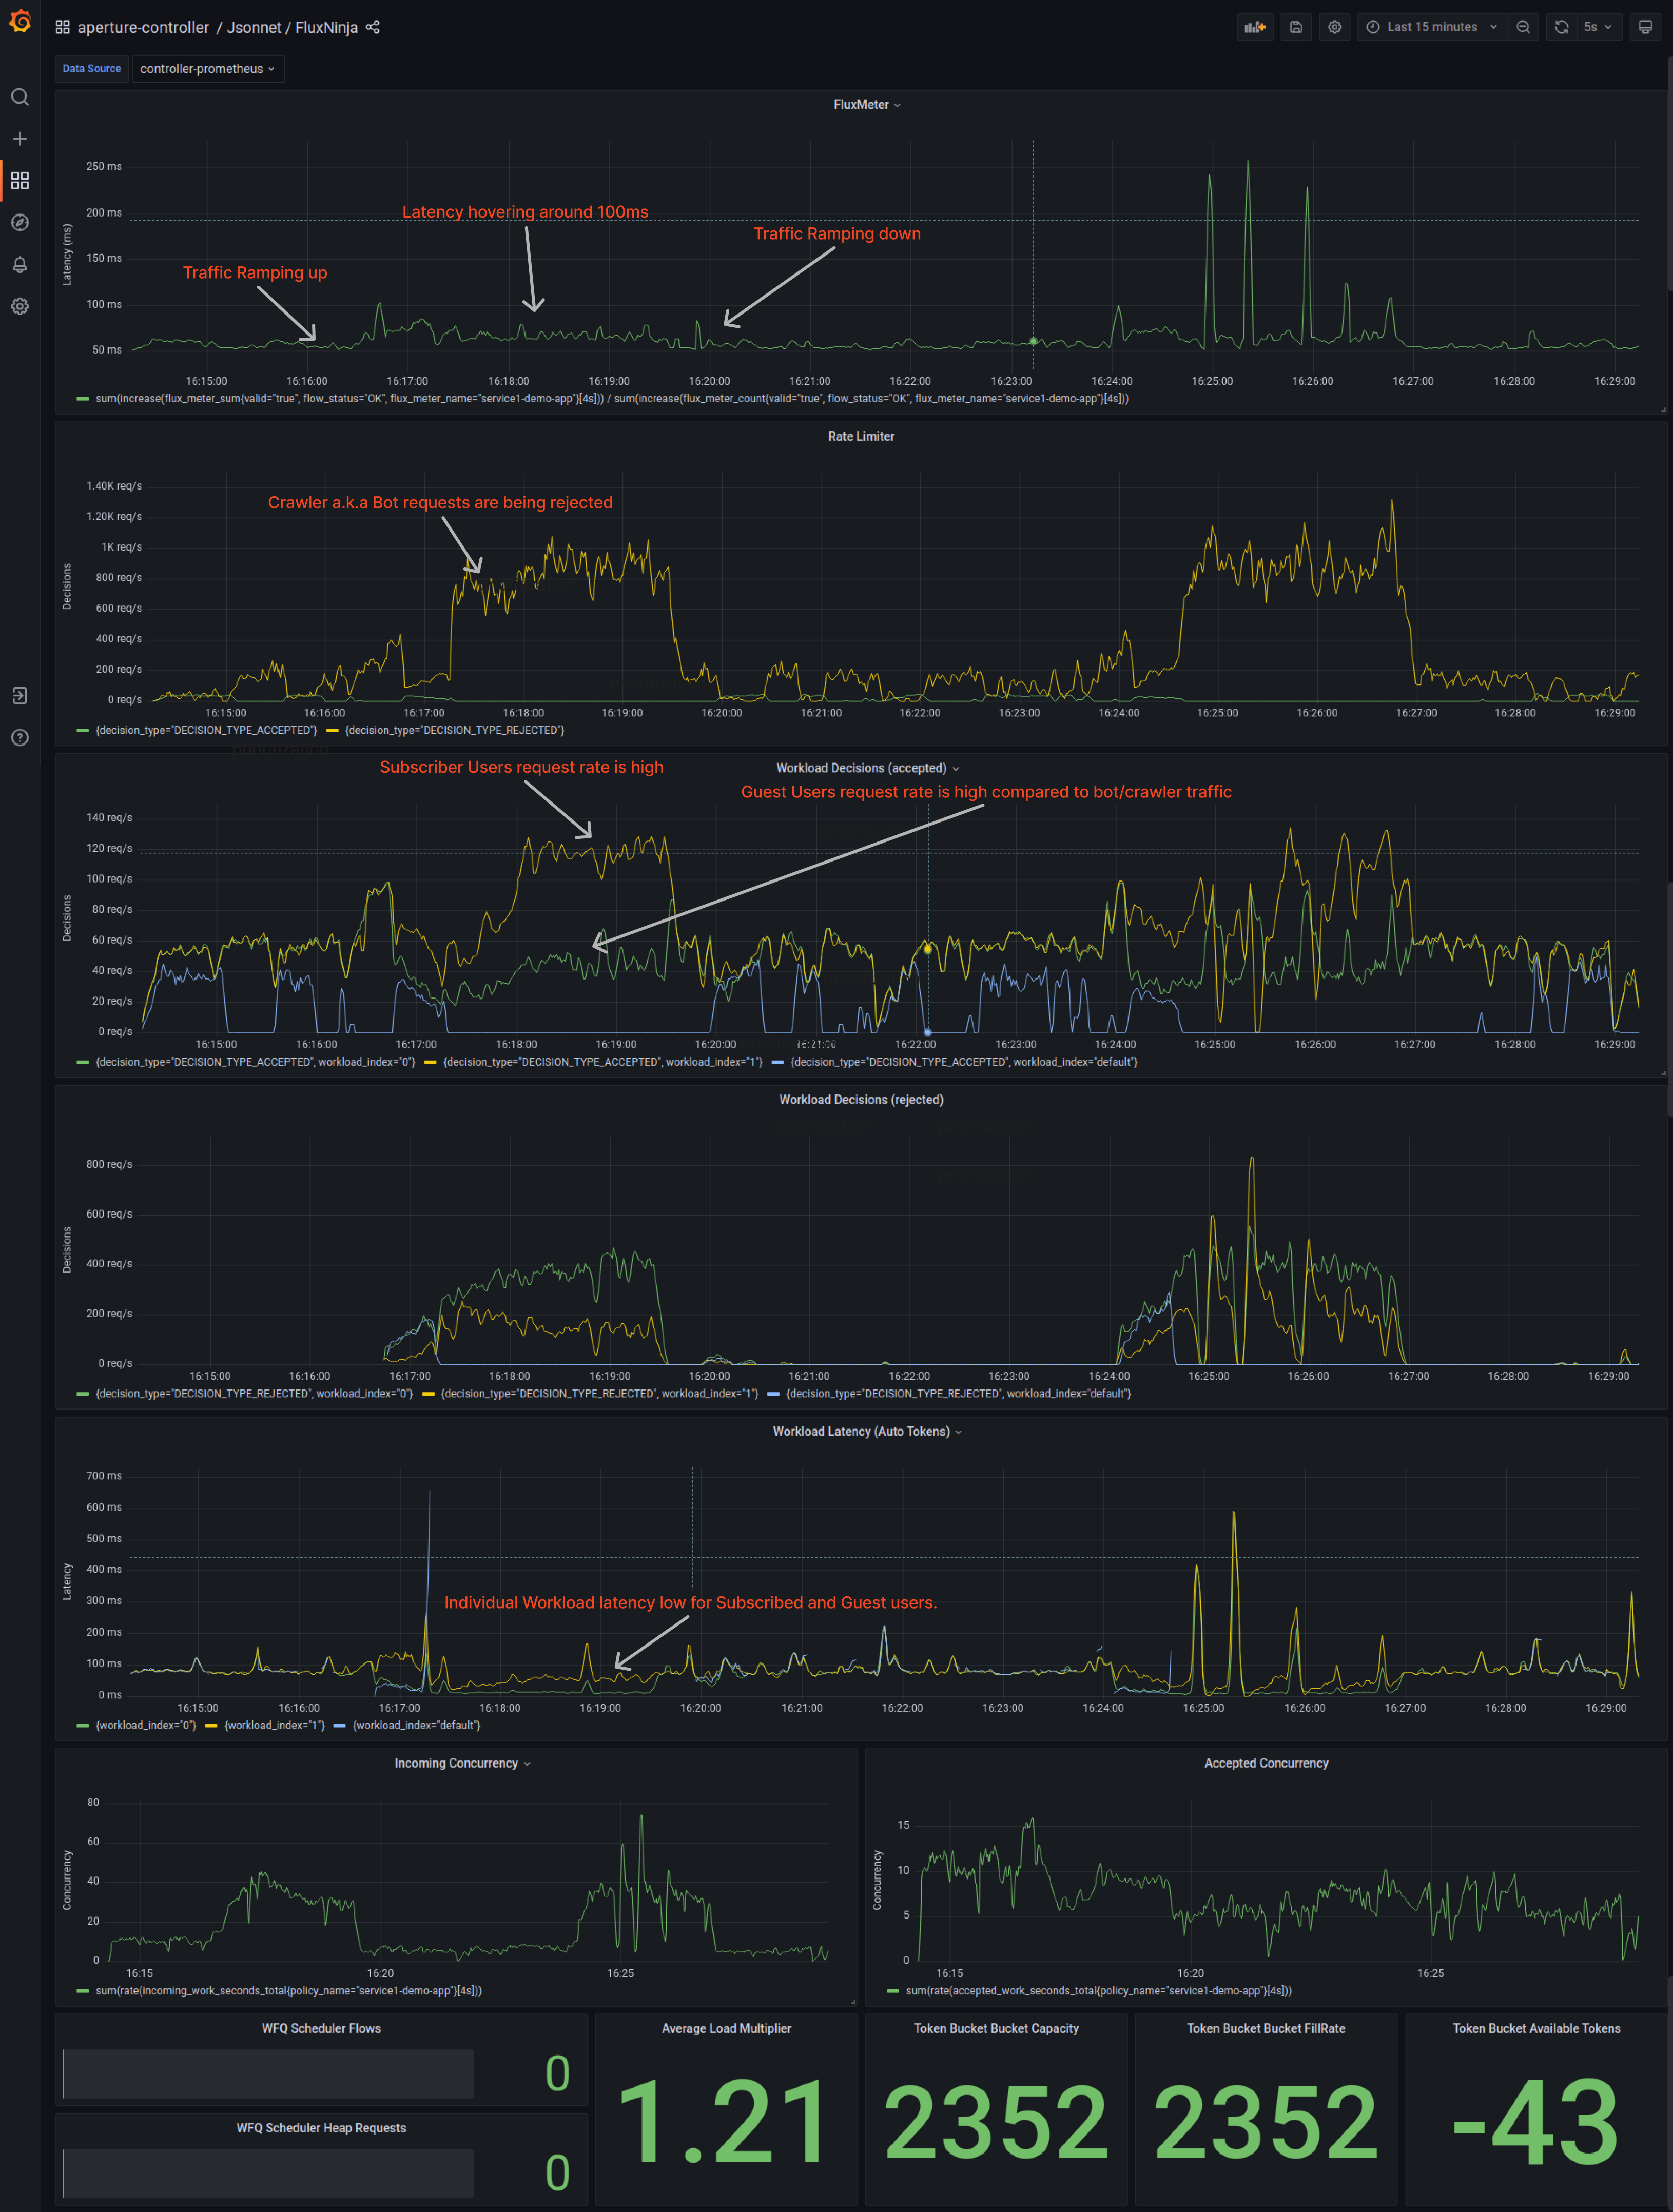
System Overview
The impact of Aperture on reliability can be better understood by examining the graph below. Prior to integrating Aperture, the latency peak was around 400ms. However, after integrating Aperture, the latency significantly decreased to less than 150ms, which is a remarkable difference. This is particularly significant for organizations that optimize to reduce latency by just 10ms.
This example clearly demonstrates how Aperture's techniques have improved the performance and reliability of the e-commerce website. By implementing Aperture's load management strategy, the service was able to handle high-traffic loads and prevent any downtime effectively.
Conclusion
In conclusion, managing high-traffic e-commerce websites with Nginx can be a daunting task, but integrating FluxNinja Aperture can make it easier. We have discussed the benefits of using Aperture to manage load and prevent server crashes, as well as the various techniques that Aperture offers to help manage high-traffic loads. By implementing Aperture's techniques, websites can handle high-traffic loads, prevent downtime, and ensure a consistent and reliable user experience even during peak periods. With Aperture, load management becomes more efficient, allowing websites to focus on providing high-quality service to their customers.
To learn more about Aperture, please visit our GitHub repository and documentation site. You can also join our Slack community to discuss best practices, ask questions, and engage in discussions on reliability management.
Published at DZone with permission of Sudhanshu Prajapati. See the original article here.
Opinions expressed by DZone contributors are their own.
Comments