Introducing a Drill Down Table API in Cube.js
Join the DZone community and get the full member experience.
Join For FreeSince the release of drill down support in version 0.19.23, you can build interfaces to let users dive deeper into visualizations and data tables. The common use case for this feature is to let users click on a spike on the chart to find out what caused it, or to inspect a particular step of the funnel — who has converted and who has not.
In this blog post, I'll show you how to define drill downs in the data schema and build an interface to let users explore the underlying chart's data. If you're just starting with Cube.js, I highly recommend beginning with this Cube.js 101 tutorial and then coming back here. Also, if you have any questions, don't hesitate to ask them in our Slack community.
You can check the online demo of the example here, and the source code is available on GitHub.
Let's start hacking!
Defining a Drill Down in the Data Schema
Let's start by setting up a new project with Cube.js and configuring drill down support in the data schema. We'll use PostgresQL and our example e-commerce dataset for this tutorial. You can download and import it by running the following commands.
xxxxxxxxxx
$ curl http://cube.dev/downloads/ecom-dump.sql > ecom-dump.sql
$ createdb ecom
$ psql --dbname ecom -f ecom-dump.sql
Next, install the Cube.js CLI if you don't have it already, and create a new project.
xxxxxxxxxx
$ npm -g install cubejs-cli
$ cubejs create drill-downs -d postgres
Make sure you have the following credentials in the .env file.
xxxxxxxxxx
CUBEJS_API_SECRET=SECRET
CUBEJS_DB_TYPE=postgres
CUBEJS_DB_NAME=ecom
Now, we're ready to launch the Cube.js server and navigate to the playground running at http://localhost:4000.
xxxxxxxxxx
$ npm run dev
Once you're in the playground, navigate to the Schema tab. Then, select the orders and users tables and click Generate Schema, as in the screenshot below.
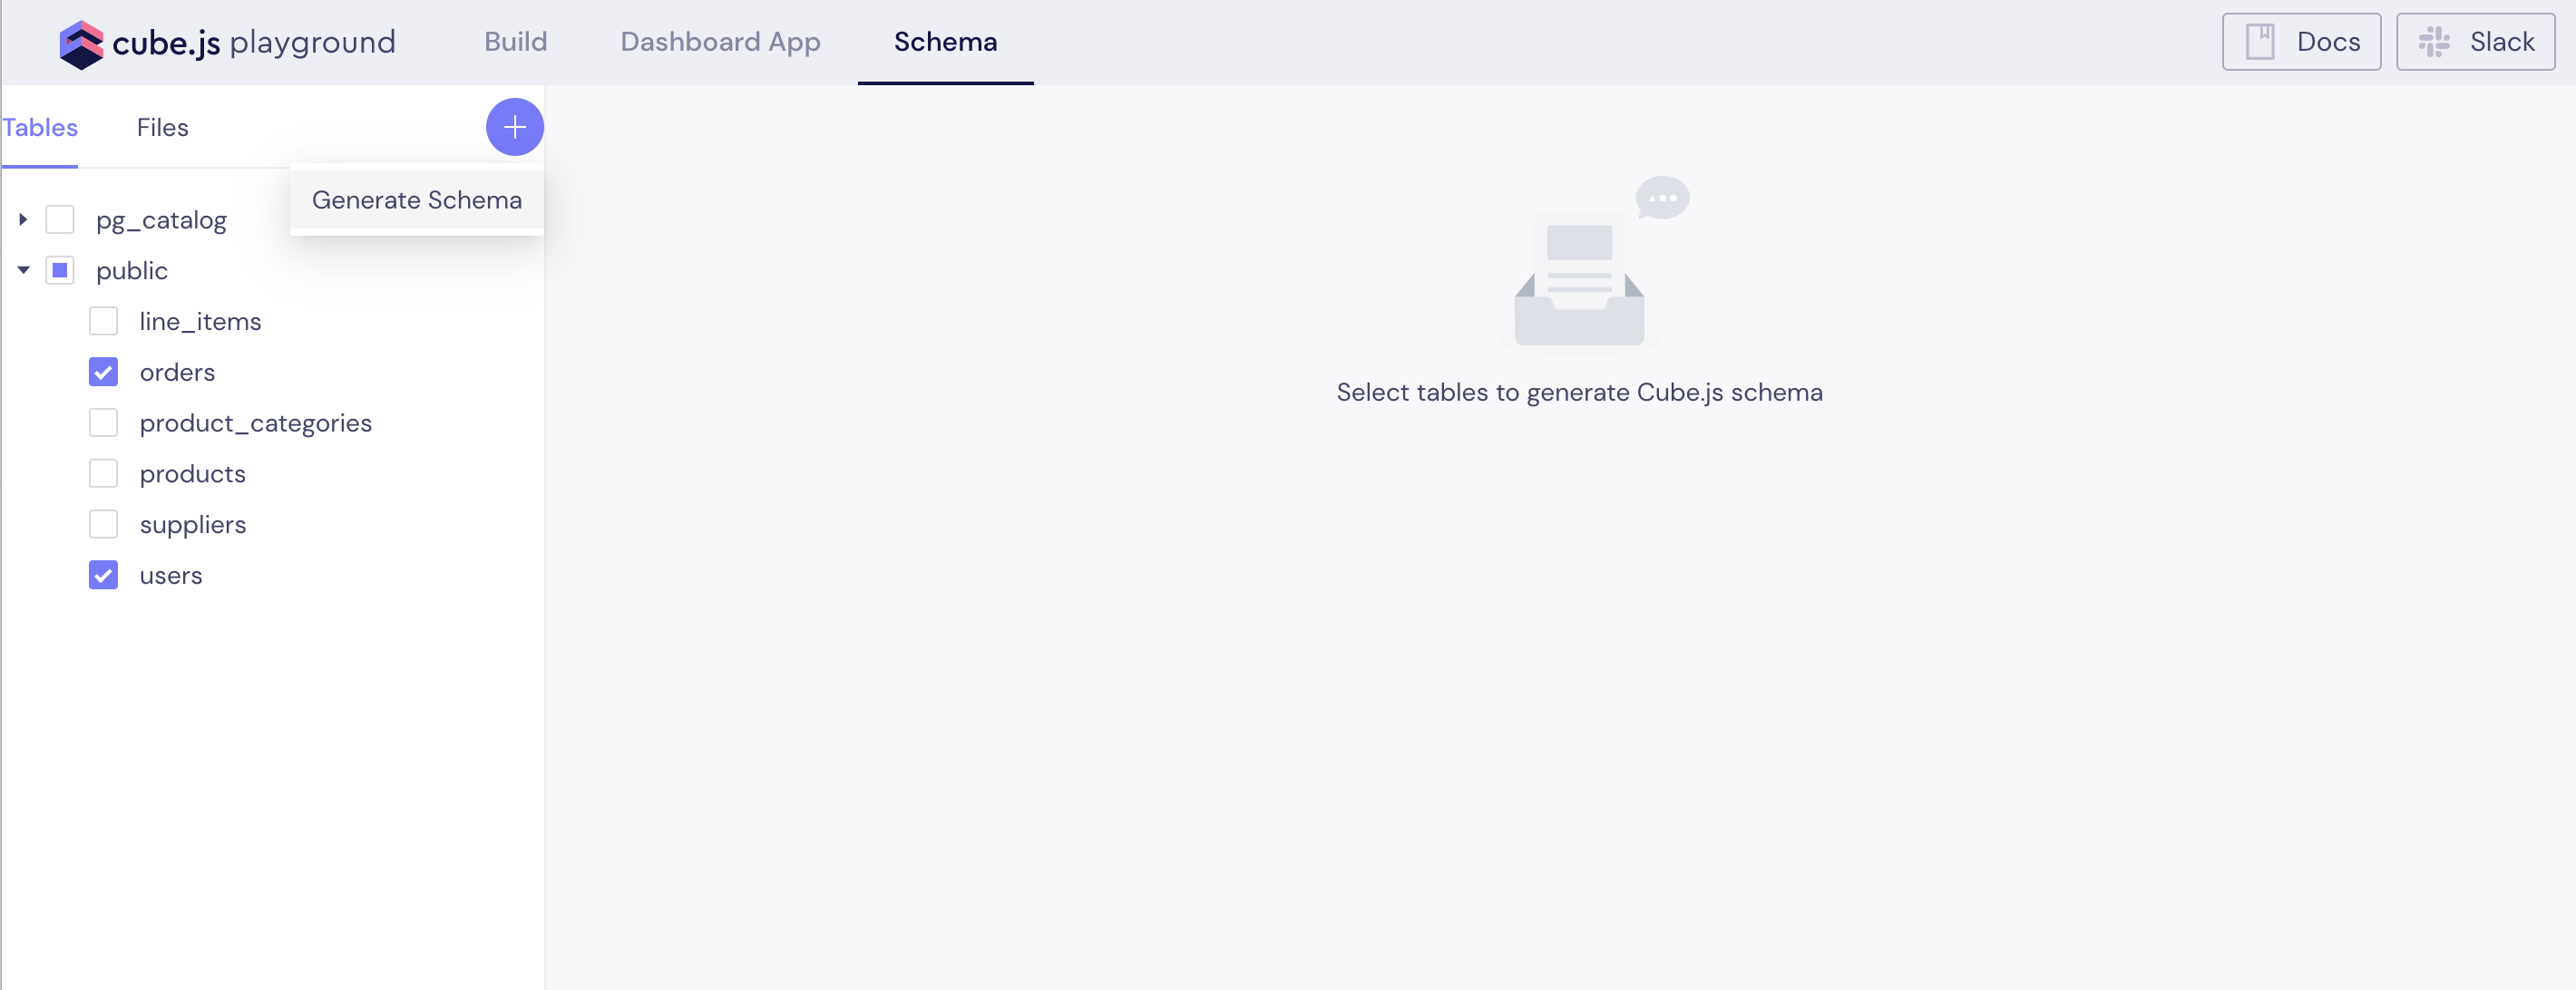
This will generate a basic data schema for users and orders tables, which already includes the drillMembers property on the count measure. The drillMembers property contains a list of dimensions that will be used to show the underlying data when drilling into that measure.
Let's take a closer look at the Orders cube and its count measure.
xxxxxxxxxx
measures: {
count: {
type: `count`,
drillMembers: [id, createdAt]
}
}
It already has the basic dimensions listed in the drillMembers property: id and createdAt. We can add additional dimensions to that list. We also can reference dimensions from joined cubes—in our case, from Users.
Let's add more dimensions to the drillMembers property.
xxxxxxxxxx
measures: {
count: {
type: `count`,
drillMembers: [id, status, Users.firstName, Users.city]
}
}
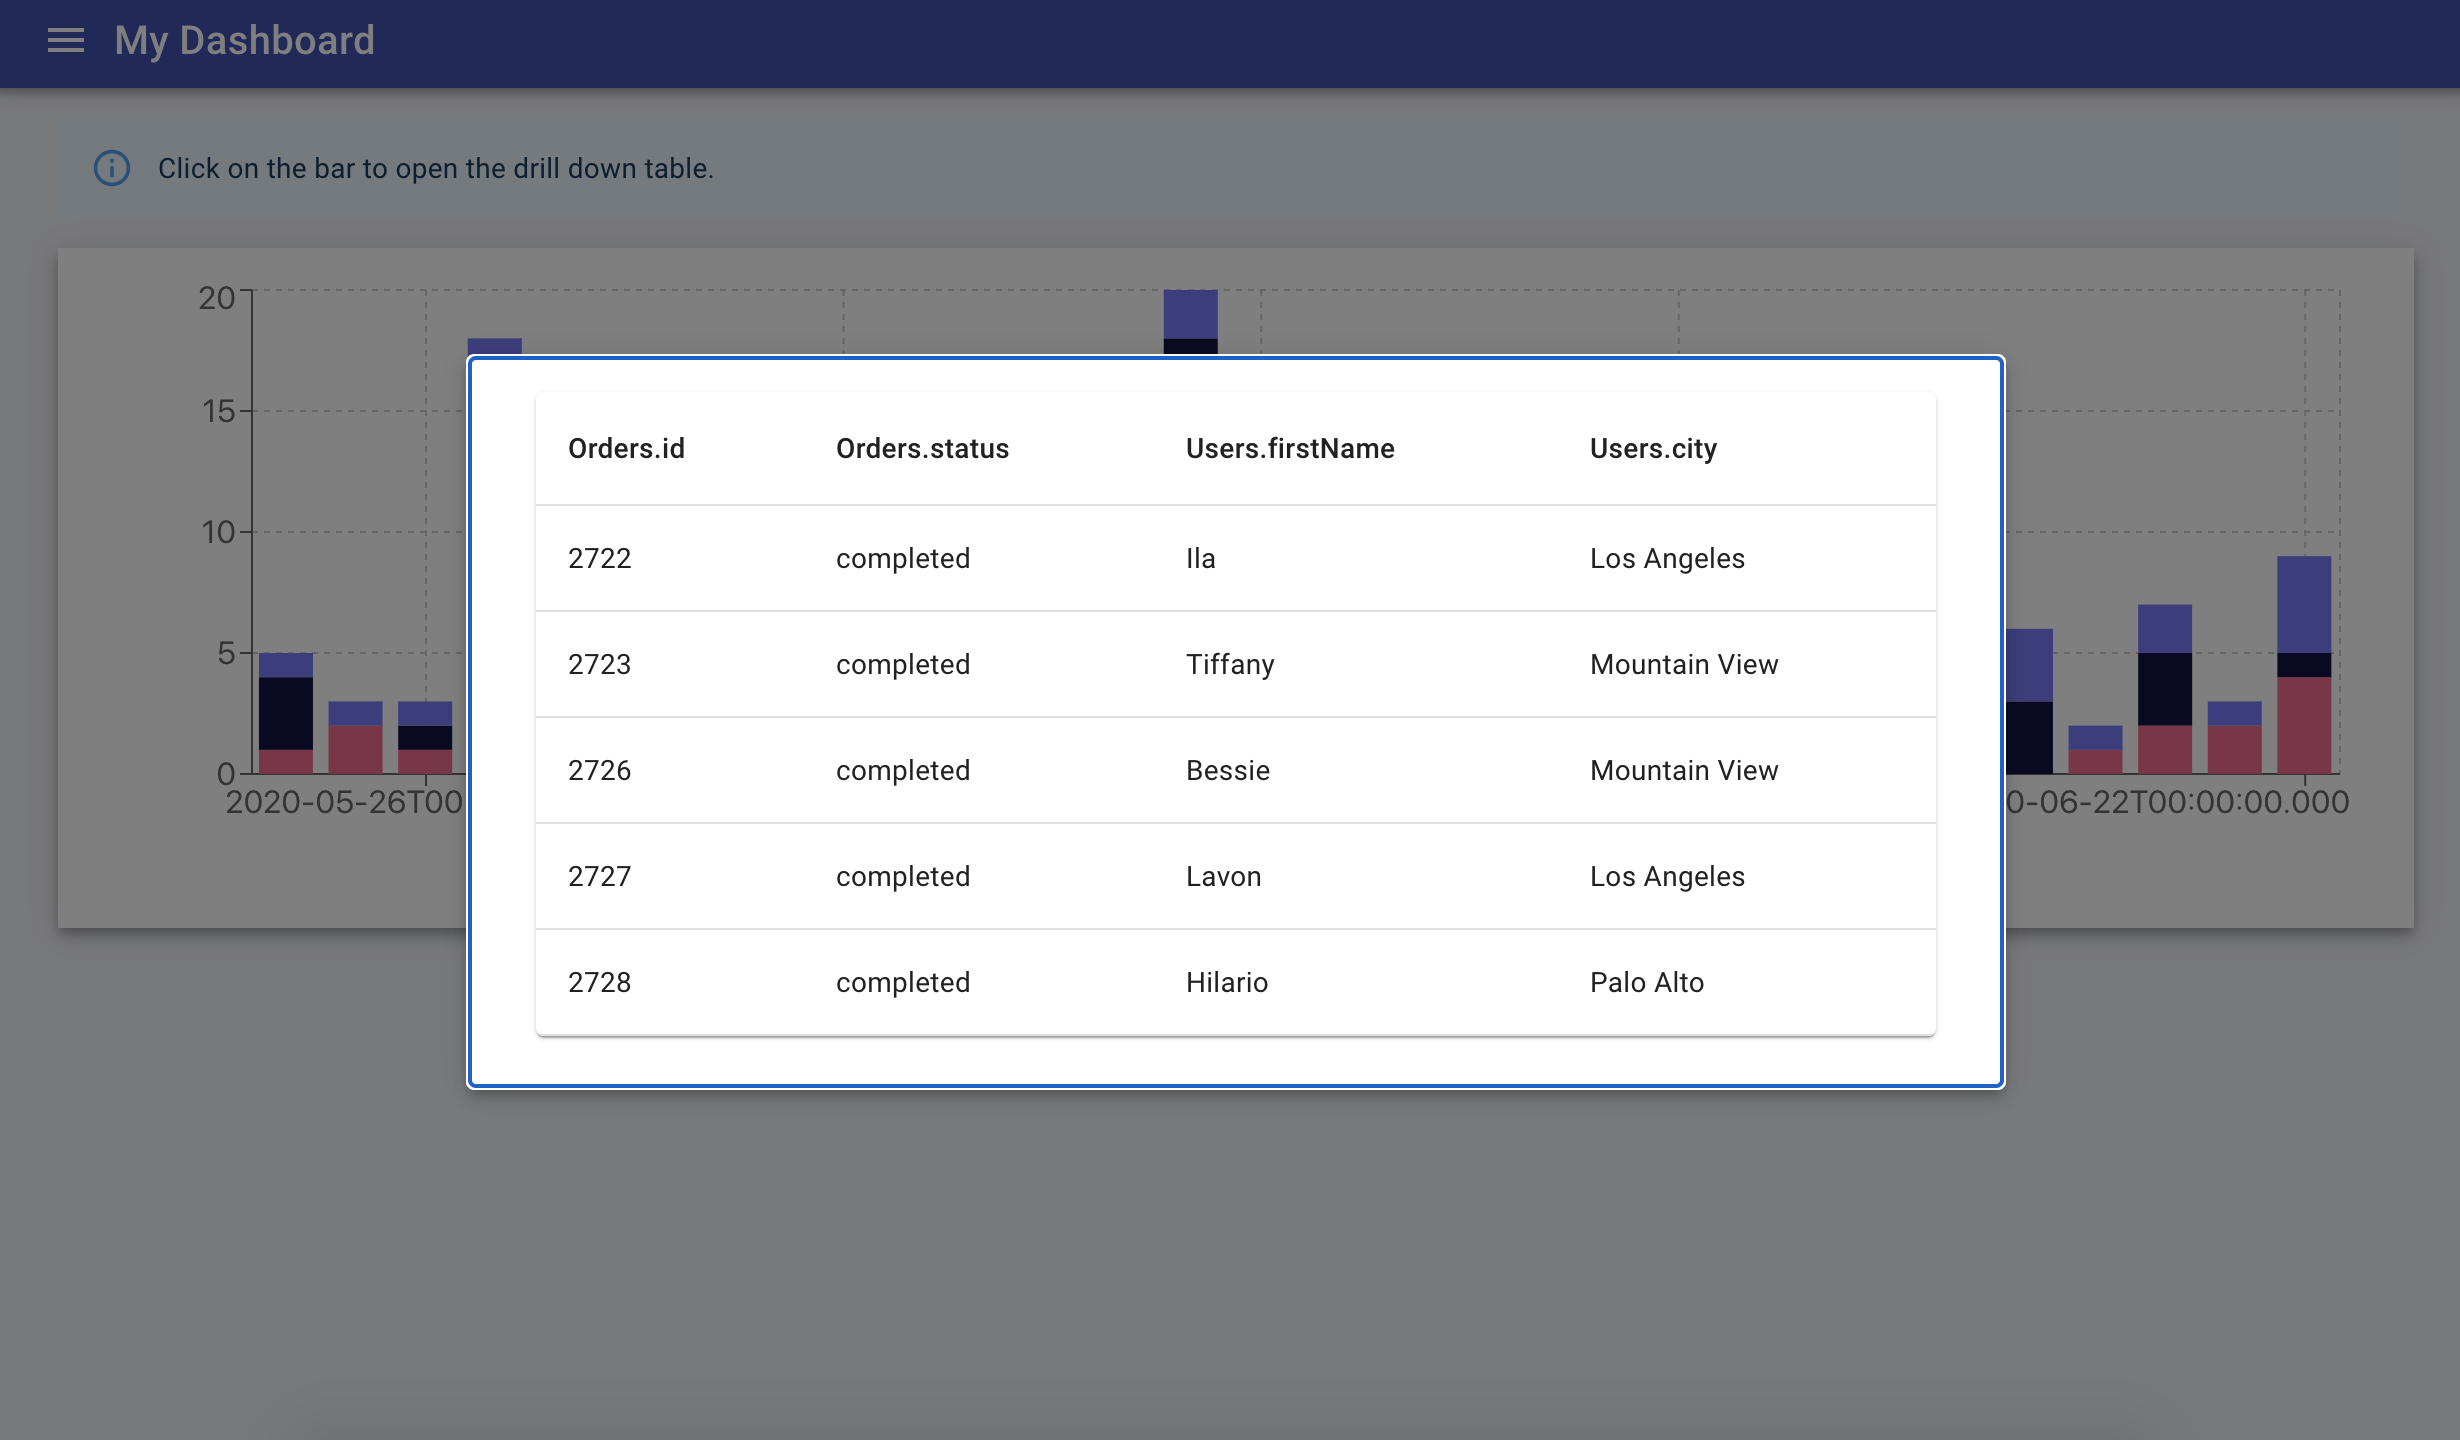
That's all we need in the data schema to build our drill down. On the frontend, we're going to make a bar chart to display orders over time. When a user clicks on the bar, our app will display the table inside the modal window, with details about the orders in that bar.
Building the Drill Down UI
We'll use Cube.js templates to generate a frontend app. Navigate to the Dashboard App tab and select the Material-UI React Dashboard. It will take several minutes to set up the Dashboard App and install all the dependencies inside the dashboard-app folder in your project.
Please note: although we use React in this example, you can build the same drill down in Vue.js, Angular, or Vanilla JS.
The first step is to render a bar chart. We're going to plot the count of orders over time, grouped by the status. Eventually, we want to let users click on a specific group and day to explore the underlying orders— e.g., orders created on June 20 and already shipped.
Let's create a dashboard-app/src/DrillDownExample.js file with the following content.
xxxxxxxxxx
import React, { useEffect, useState } from "react";
import { useCubeQuery } from "@cubejs-client/react";
import {
BarChart,
Bar,
ResponsiveContainer,
XAxis,
YAxis,
CartesianGrid,
Tooltip as RechartsTooltip,
Legend
} from "recharts";
const colors = ["#FF6492", "#141446", "#7A77FF"];
const query = {
measures: ["Orders.count"],
dimensions: ["Orders.status"],
timeDimensions: [{
dimension: "Orders.createdAt",
granularity: "day",
dateRange: "last 30 days"
}]
};
const DrillDownExample = () => {
const { resultSet } = useCubeQuery(query);
if (!resultSet) {
return <p>Loading</p>;
}
return (
<>
<ResponsiveContainer width="100%" height={300}>
<BarChart data={resultSet.chartPivot()}>
<CartesianGrid strokeDasharray="3 3" ></CartesianGrid>
<XAxis dataKey="x" ></XAxis>
<YAxis ></YAxis>
<RechartsTooltip ></RechartsTooltip>
<Legend ></Legend>
{resultSet.seriesNames().map(({ key }, index) => {
return (
<Bar
key={key}
dataKey={key}
stackId="a"
fill={colors[index]}
></Bar>
);
})}
</BarChart>
</ResponsiveContainer>
</>
);
}
export default DrillDownExample;
The code snippet above is pretty straightforward. First, we load data with the useCubeQuery hook and render it later with Recharts. Next, let's add some interactivity and let users click on the bars!
To be able to show the underlying data, we first need to figure out where the user clicked on the chart, and then construct a query to Cube.js to load that data. The user can click on any day in our bar chart and on any status of the order within that day. To describe that location, Cube.js uses two variables: xValues and yValues.
For example, the following values mean that the user wants to explore processing orders on June 6:
xxxxxxxxxx
{
xValues: ["2020-06-06T00:00:00.000"],
yValues: ["processing", "Orders.count"]
}
To generate a query that returns data for a drill down table, we need to use the ResultSet#drillDown() method. If we run it with the above values, like this:
xxxxxxxxxx
resultSet.drillDown(
{
xValues: ["2020-06-06T00:00:00.000"],
yValues: ["processing", "Orders.count"]
}
)
it will return the query, which has all the dimensions from the drillMembers property in the data schema, as well as all required filters to specifically load processing orders on June 6.
xxxxxxxxxx
{
"measures": [],
"dimensions": [
"Orders.id",
"Orders.status",
"Users.firstName",
"Users.city"
],
"filters": [
{
"dimension": "Orders.count",
"operator": "measureFilter"
},
{
"member": "Orders.status",
"operator": "equals",
"values": [
"processing"
]
}
],
"timeDimensions": [
{
"dimension": "Orders.createdAt",
"dateRange": [
"2020-06-06T00:00:00.000",
"2020-06-06T23:59:59.999"
]
}
]
}
Once we have the drill down query, we can use it to load data from the Cube.js API.
To get the values for xValues and yValues properties, we will use the ResultSet#chartPivot() and ResultSet#seriesNames() methods. chartPivot() returns xValues for every data row, and seriesNames() returns yValues per series. We're going to use these methods to pass xValues and yValues to the Recharts to make sure we have them in the onClick handler.
First, let's create a click handler, which will accept xValues and yValues, generate a drill down query, and store it in the state.
xxxxxxxxxx
const [drillDownQuery, setDrillDownQuery] = useState();
const handleBarClick = (event, yValues) => {
if (event.xValues != null) {
setDrillDownQuery(
resultSet.drillDown(
{
xValues: event.xValues,
yValues
}
)
);
}
};
Now we need to make sure we pass both xValues and yValues to the handleBarClick. Since we pass resultSet.chartPivot() to the Recharts <BarChart /> component as a data property, the xValues will be available as the property on the event object in the onClick callback. To pass yValues, we need to make the following changes:
xxxxxxxxxx
-{resultSet.seriesNames().map(({ key }, index) => {
+{resultSet.seriesNames().map(({ key, yValues }, index) => {
return (
<Bar
key={key}
dataKey={key}
stackId="a"
fill={colors[index]}
+ onClick={event => handleBarClick(event, yValues)}
/>
);
})}
Now, as we have drillDownQuery in the state, we can query it in our component.
const drillDownResponse = useCubeQuery(
drillDownQuery,
{
skip: !drillDownQuery
}
);
Later, you can use drillDownResponse to render the drill down data however you want. In our example, we use Material-UI Kit and render it as a table within the modal window.
I hope you found this tutorial helpful for adding interactive drill downs to your application! You can check the online demo of the example here, and the source code is available on GitHub.
If you have any questions, please don't hesitate to reach out to me in Cube.js Slack community.
Published at DZone with permission of Artyom Keydunov. See the original article here.
Opinions expressed by DZone contributors are their own.
Comments