An Introduction to the Four Pillars of Observability
The blog introduces you to the four pillars of observability, AWS and Azure cloud-native services, and ROI to help in architects and engineer's quest for system clarity.
Join the DZone community and get the full member experience.
Join For FreeIt is a quiet Tuesday afternoon until the latency spikes begin. In the world of modern software engineering, we have moved far beyond the era of simple server monitoring. We no longer just “build and hope.” Instead, we strive for Continuous Reliability, a state where our systems are designed to be interrogated, understood, and improved in real time. This is the essence of Observability.
To truly master a running system, we must look through four distinct lenses, often called the pillars of telemetry. Each provides a different chapter of the story, and together, they offer a level of visibility that transforms production from a “black box” into an open book.
1. The First Lens: Logs
What are Logs?
Every request that hits your system begins its story with a log. A log is a discrete, timestamped record — a “journal entry” of a specific event. When a system fails, the log is often the first place an engineer looks to find the exact line of code that threw an exception or the specific user ID that triggered a 500 error.
While the benefit of logging is its absolute precision and non-repudiable audit trail, it comes with significant risk. In high-traffic environments, logging everything at a “debug” level creates a “data tax” that can crash storage backends and bloat cloud bills. If not managed properly, logs can also become a liability by accidentally leaking personally identifiable information (PII) into unencrypted storage.
How Is It Done?
Applications emit strings of text to stdout or files. A logging agent then “tails” these sources, processes them, and ships them to a centralized storage system or database.
The Benefits
- Precision: Logs tell you exactly which user ID failed and which exception was thrown.
- Auditability: Essential for security forensics and compliance.
Cloud-Native Implementations
- AWS CloudWatch Logs: The default for most AWS services. It offers CloudWatch Logs Insights, a powerful query engine that enables complex searches across log groups without managing a database.
- Azure Monitor Logs (Log Analytics): Based on the Kusto Query Language (KQL), it centralizes logs from VMs, Kubernetes (AKS), and Azure Functions. It integrates natively with Microsoft Sentinel for security.
Other Tools
- Grafana Loki: High-efficiency, metadata-only indexing.
- Elasticsearch (ELK): Powerful full-text search for complex audits.
- Vector / Fluent Bit: High-performance routing and transformation agents.
2. The Second Lens: Metrics (The Pulse of the Infrastructure)
What are Metrics?
While logs tell the story of a single request, metrics describe the health of the entire population. Metrics are the pulse — the numerical heartbeat of your infrastructure — measured over time. They tell us about 99th-percentile latency, error rates, and CPU saturation.
The beauty of metrics lies in their low overhead; numbers are incredibly cheap to store compared to text. This allows us to trigger automated alerts long before a human notices a problem. However, the risk here is cardinality explosion. If an engineer incorrectly tags a metric with a unique ID for every user, the underlying time-series database can collapse under the sheer volume of unique data streams.
How Is It Done?
Systems expose a /metrics endpoint that a collector periodically scrapes, or the application pushes data points directly to a time-series database (TSDB).
The Benefits
- Low overhead: Numbers are cheap to store and fast to query.
- Alerting: Metrics are the primary source for triggering on-call alerts.
Cloud-Native Implementations
- Amazon Managed Service for Prometheus (AMP): A fully managed, Prometheus-compatible monitoring service that scales automatically.
- AWS CloudWatch Metrics: Provides standard metrics (CPU, disk, network) for every AWS resource by default.
- Azure Monitor Metrics: Offers near-real-time alerting and integrates seamlessly with Azure Autoscale to trigger resource changes based on demand.
Other Tools
- Prometheus: The standard for scraping and alerting.
- Grafana Mimir: Long-term, multi-tenant storage for Prometheus.
- VictoriaMetrics: Extreme performance for massive-scale time-series data.
3. The Third Lens: Tracing (The Request Journey)
What Is Tracing?
As architectures transitioned from monoliths to microservices, we lost the ability to see how a single request travels. A user might experience a three-second delay — but which of the twenty downstream services is to blame? Distributed tracing solves this by following a transaction’s journey, linking together “spans” of time spent in the frontend, various backends, and databases.
Tracing requires a Trace ID to be passed like a baton between services. The risk is that if one service in the chain is not instrumented, the baton is dropped and the trace becomes a broken, useless fragment. To mitigate this, the industry has rallied around OpenTelemetry (OTel), a vendor-neutral standard that ensures your tracing logic isn’t locked into a single provider.
How Is It Done?
A unique Trace ID is injected into the request headers. Every service it touches records its start and end time, passing the ID to the next hop.
The Benefits
- Bottleneck identification: Instantly see which microservice is causing the delay.
- Dependency mapping: Automatically visualize how your services interact.
Cloud-Native Implementations
- AWS X-Ray: Designed to trace requests through API Gateway, Lambda, SQS, and DynamoDB, with a Service Map to visualize hotspots.
- AWS Managed Service for OpenTelemetry (ADOT): An AWS-supported distribution of OpenTelemetry for sending traces to X-Ray or other backends.
- Azure Application Insights: Part of Azure Monitor, providing end-to-end distributed tracing and application maps, especially strong for .NET and Java environments.
Other Tools
- Grafana Tempo: Scalable trace storage integrated with logs and metrics.
- Jaeger: CNCF-graduated UI for visualizing trace spans.
4. The Fourth Lens: Profiling
What Is Profiling?
Even with logs, metrics, and traces, we may still be blind to why a service is inefficient. We know the CPU is high, but not the cause. This is where continuous profiling enters — the code surgeon that measures resource consumption at the function-call level, 24/7.
How Is It Done?
An agent periodically interrupts the CPU to sample which function is currently executing, building a statistical map of resource usage.
The Benefits
- Cost savings: Pinpoint the exact lines of code to optimize, potentially reducing cloud bills.
- Heisenbug hunting: Find intermittent performance issues that don’t appear in metrics.
Cloud-Native Implementations
- Amazon CodeGuru Profiler: Uses machine learning to identify the most expensive lines of code in Java and Python applications and provides optimization recommendations.
- Azure Monitor Application Insights Profiler: Automatically captures profiles for .NET applications running in App Service, Functions, or Cloud Services under load.
Other Tools
- Grafana Pyroscope: Aggregates profiles into searchable flame graphs.
- Parca: eBPF-based, zero-instrumentation profiling.
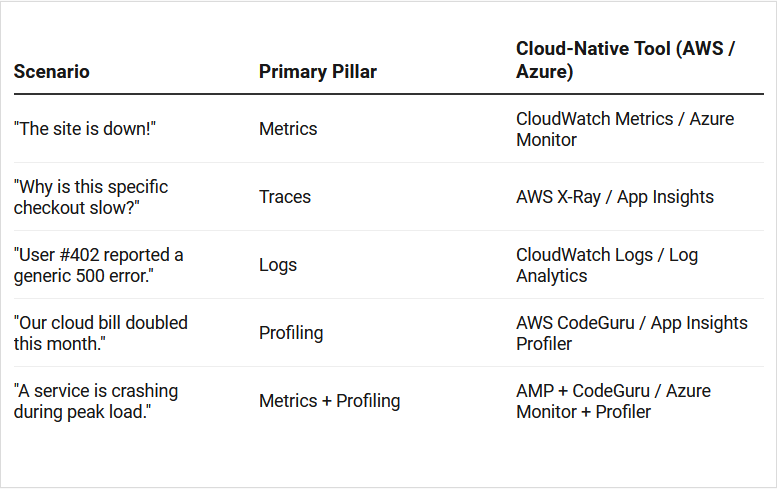
Observability Decision Matrix
The following table shows the decision matrix of which lens is instrumental in solving specific problems.
Implementation Strategy (The Toolchain Plumbing)
To make these pillars actionable, you need a “plumbing” layer to move data:
- Instrumentation: Use OpenTelemetry or cloud-native SDKs (e.g., ADOT).
- Collection: Grafana Alloy or the OpenTelemetry Collector acts as your central nervous system.
- Auto-visibility: Use Grafana Beyla (eBPF) for instant visibility into legacy systems.
- Action & ROI: Connect everything to Grafana OnCall. When a metric fires, the alert links to the relevant trace, which leads to the specific log, which points to the profile.
The ROI (Return on Investment)
By leveraging managed services like AWS AMP or Azure Log Analytics, teams reduce operational overhead. You no longer spend time patching observability databases — you spend time fixing applications. This efficiency reduces Mean Time to Recovery (MTTR) and optimizes infrastructure spend through code-level visibility.
Published at DZone with permission of Akash Lomas. See the original article here.
Opinions expressed by DZone contributors are their own.
Comments