Inverse Distance Weighting Interpolation in Python
This article will teach us how to do IDW interpolation in Python.
Join the DZone community and get the full member experience.
Join For FreeGeospatial interpolation is a process used to estimate values for unknown points in a geographical area using known values.
Inverse Distance Weighting, or IDW for short, is one of the most popular methods used for geospatial data interpolation. This article will teach us how to do IDW interpolation in Python.
The IDW interpolation method assumes that the closer values are more related than the farther ones. IDW estimates the value at an unknown point by using the known values weighted by their distance from the point whose value is to be estimated.
We can also use another variable called "power" in IDW to control the influence of known values. Higher power will increase the influence of nearby values.
Here is a simple DIY implementation of IDW in Python.
import numpy as np

def idw_custom(dist,val,power):

    numerator=np.sum(val/(dist**power))

    weights=np.sum(1/(dist**power))

    return numerator/weights


dist=np.array([1.38,3.04,7.36,7.59,9.67])

val=np.array([17.7,15.7,34.3,6.3,23.3])

print(idw_custom(dist,val,1))
The numerator contains the sum of the known values divided by distance, and the denominator includes the sum of the inverse of distances. The power can be used to control the influence of known values.
Using Built-in Libraries to Perform IDW Interpolation
In the above example, we used precalculated distances, but in most practical use cases, we have to calculate the distance ourselves. We can use the haversine distance to calculate it, but when we have a lot of points, this can be cumbersome. This is where we can use preexisting libraries that calculate the distance and perform the interpolation.
In our example, we will be interpolating PM2.5 values from air quality data for the city of Bengaluru.
grid_space = 0.01
grid_lon = np.arrange(np.amin(lons), np.amax(lons), grid_space)
grid_lat = np.arrange(np.amin(lats), np.amax(lats), grid_space)
Let us first generate a grid of points for which we need to estimate values. We've set approximately 1 km of grid space.
"lons" contains a list of longitudes and "lats" contains a list of latitudes. We've generated the grid using the min and max of longitudes and latitudes.
all_lats = np.meshgrid(grid_lon, grid_lat)[1].ravel()
all_lons = np.meshgrid(grid_lon, grid_lat)[0].ravel()
itrp=pd.DataFrame()
itrp['lat']=all_lats
itrp['lng']=all_lons
In the above code, we created a data frame containing the pairs of latitude and longitude for which we need to estimate values. We can also use ‘for loop’ to do the same, as shown in the code below.
lat=[]
lng=[]
for i in range(len(grid_lat)):
    for j in range(len(grid_lon)):
        lat.append(grid_lat[i])
        lng.append(grid_lon[j])
itrp=pd.DataFrame()
itrp['lat']=lat
itrp['lng']=lng
We can use Sklearn's KNN implementation to simulate IDW. The code to do it is given below.
x=sample[['lat','lng']]
y=sample['PM2.5']
from sklearn.neighbors import KNeighborsRegressor
model=KNeighborsRegressor(algorithm='kd_tree',n_neighbors=8,weights='distance').fit(x,y)
The "sample" dataframe contains the station air quality data for a single timestamp. We give latitude and longitude as explanatory variables and PM2.5 as the variable that needs to be interpolated. We should use "kd_tree" as the algorithm and set "n_neighbors" as the number of stations, which in this case is eight. We should also set "weights" as the distance to perform IDW.
pred=model.predict(itrp[['lat','lng']])We will use the predict method to estimate the values for our grid points, which are stored in the itrp dataframe.
We'll now load some shapefiles to help us visualize the interpolation results.
data=gpd.read_file('Taluk_Boundary.shp')
data=data[data['KGISDistri']==20].iloc[0:4]
itrp=gpd.GeoDataFrame(itrp,geometry=gpd.points_from_xy(itrp.lng, itrp.lat))
stn=gpd.GeoDataFrame(stn,geometry=gpd.points_from_xy(stn.lng, stn.lat))
sample=gpd.GeoDataFrame(sample,geometry=gpd.points_from_xy(sample.lng, sample.lat))
sample.crs={'init' :'epsg:4326'}
sample=sample.to_crs(data.crs)
stn.crs={'init' :'epsg:4326'}
stn=stn.to_crs(data.crs)
itrp.crs={'init' :'epsg:4326'}
itrp=itrp.to_crs(data.crs)
The "data" contains the shapefile for the city of Bengaluru.
We converted "itrp," "sample," and "stn" to GeoDataFrame to plot the points.
Lastly, we set the coordinate reference system (CRS, for short) for all the newly created geodataframes. This should be the same as our shapefile "data.
The following is the result of the interpolation.
ax=data.plot(color='white', edgecolor='black',figsize=(25,30))

itrp.plot(ax=ax, column='PM2.5', markersize=50,figsize=(25,30),legend=True)

sample.plot(ax=ax, marker='o', column='PM2.5', markersize=50,figsize=(25,30),label='SiteName')

for x, y, label in zip(sample.geometry.x, sample.geometry.y, sample.SiteName):

    ax.annotate(label.split(',')[0], xy=(x, y), xytext=(10, 10), textcoords="offset points")
We can also use other IDW implementations, one of which is shown below.
from photutils.utils import ShepardIDWInterpolator as idw
vals=idw(sample[['lat','lng']].to_numpy(),sample['PM2.5'].to_numpy())
itrp['PM2.5']=vals(itrp[['lat','lng']])
Let us plot and see the results.
ax=data.plot(color='white', edgecolor='black',figsize=(25,30))

itrp.plot(ax=ax, column='PM2.5', markersize=50,figsize=(25,30),legend=True)

sample.plot(ax=ax, marker='o', column='PM2.5', markersize=50,figsize=(25,30),label='SiteName')

for x, y, label in zip(sample.geometry.x, sample.geometry.y, sample.SiteName):

    ax.annotate(label.split(',')[0], xy=(x, y), xytext=(10, 10), textcoords="offset points")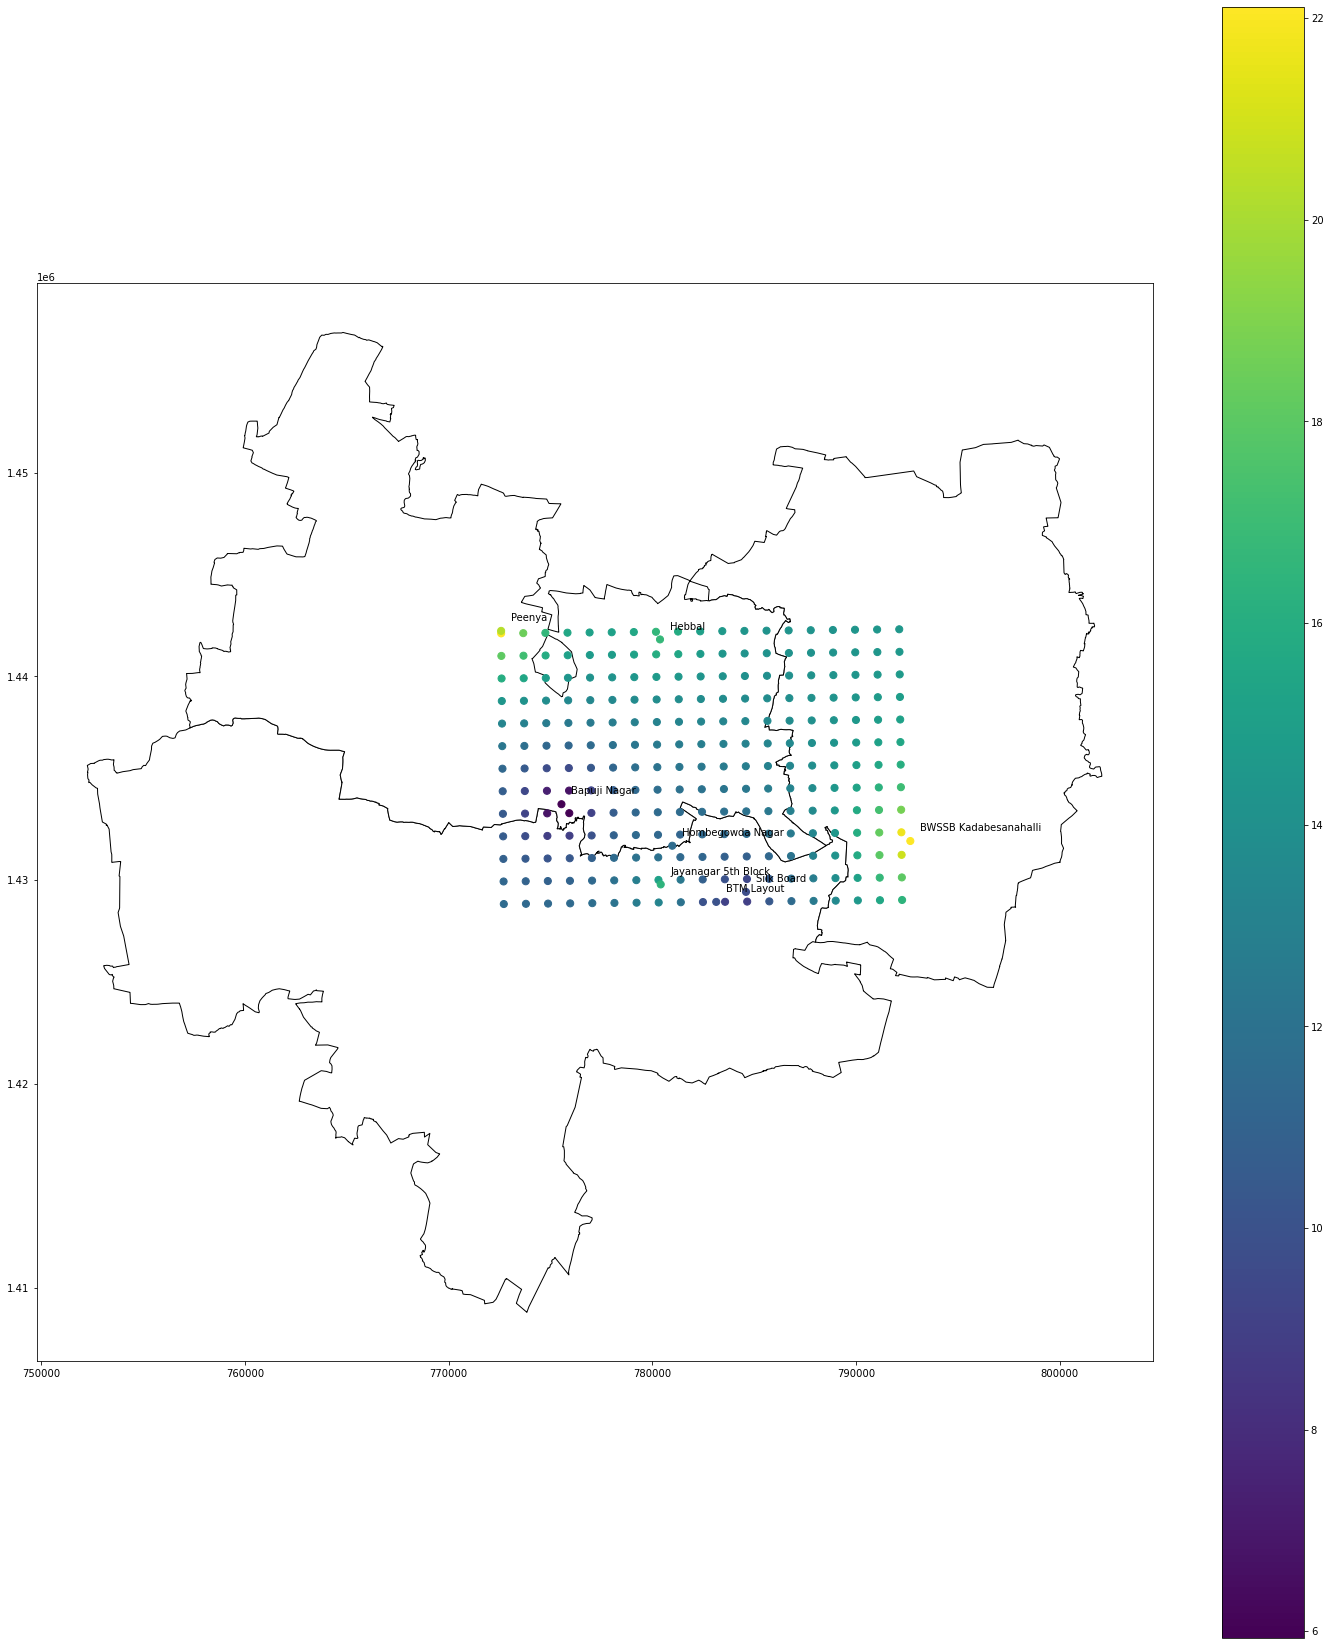
As we can see, both methods' results are the same.
And that's the end of the tutorial. In this tutorial, we learned the basics of IDW by manually implementing IDW from scratch and using built-in libraries to perform IDW. Although there are a lot of other methods to perform interpolation, IDW is one of the easiest-to-understand and most robust methods. Hence, it's one of the most popular methods.
Opinions expressed by DZone contributors are their own.
Comments