Predicting the Outcome of Cricket Matches Using AI
Learn how to apply artificial intelligence and predictive modeling techniques to predict outcomes of cricket matches based on venue, players, toss winner, and more.
Join the DZone community and get the full member experience.
Join For FreeIn this article, fundamental concepts of analytics and predictive modeling to IPL cricket matches will be applied to get meaningful information and predictions. Teams, matches, and factors affecting outcomes of matches will be analyzed. Some factors that affect match outcomes could be venue (stadium), city, toss winner, and toss decision (field/bat). Python 3+ has helpful analytics, predictive, and charting libraries. Libraries we'll focus on today include linear algebra (numpy), data processing for CSV (pandas), charting (MatPlotLib), statistical data visualization (seaborn), and machine learning modeling (scikit-learn). The source code and input statistical data are available on GitHub.
The following steps should be followed to set up an Azure environment for Jupyter notebook:
Provision Azure HDInsight cluster using Spark with linked Azure Storage blob container.
Upload source data
matches.csvto linked Azure Storage blob container using Azure Storage explorer.Launch Jupyter notebook from the HDInsight cluster blade. Under Quick links, click Cluster Dashboards. On the dashboard, click Jupyter notebook to enter your cluster login name and password. Click Upload to upload this file. Select the kernel as Python 3.6.
import numpy as np # linear algebra
import pandas as pd # data processing, CSV file I/O (e.g. pd.read_csv)
from pyspark.sql.types import *
#if you are using https://notebooks.azure.com, then upload in Jupyter notebook itself then use
#matches=pd.read_csv('../data/matches.csv')
#else Refer to Azure storage path to read CSV file
matches = spark.read.csv('wasb:///data/matches.csv.csv', inferschema=true)
matches.info()
First, we address missing data with a process called impute. There are numerous ways to fill missing data based on imaginary scenarios. Let's consider match-related columns -team1, team2, city, toss_decision, toss_winner, venue, and winner. We see that there are missing values in columns city and winner. Column city was updated manually based on venue details. Column winner was updated with the value draw.
Later, label each of team names with short abbreviations and then encode them as numerical values for predictive modeling purposes, as shown below.
encode = {'team1': {'MI':1,'KKR':2,'RCB':3,'DC':4,'CSK':5,'RR':6,'DD':7,'GL':8,'KXIP':9,'SRH':10,'RPS':11,'KTK':12,'PW':13},
          'team2': {'MI':1,'KKR':2,'RCB':3,'DC':4,'CSK':5,'RR':6,'DD':7,'GL':8,'KXIP':9,'SRH':10,'RPS':11,'KTK':12,'PW':13},
          'toss_winner': {'MI':1,'KKR':2,'RCB':3,'DC':4,'CSK':5,'RR':6,'DD':7,'GL':8,'KXIP':9,'SRH':10,'RPS':11,'KTK':12,'PW':13},
          'winner': {'MI':1,'KKR':2,'RCB':3,'DC':4,'CSK':5,'RR':6,'DD':7,'GL':8,'KXIP':9,'SRH':10,'RPS':11,'KTK':12,'PW':13,'Draw':14}}
matches.replace(encode, inplace=True)
We shall see the table output format as shown below. In first row, team1 vs. team2 is 2 (KKR) vs. 3 (RCB) played in M Chinnaswamy stadium in Bangalore city with the toss won by 3 (RCB). 3 (RCB) chose to field first. The match outcome was that (2) KKR won.

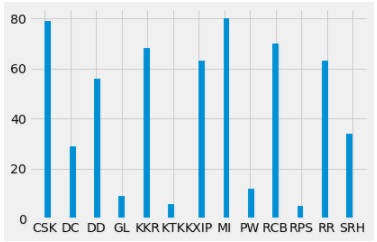
Here's the code to compute a team-wise graphical representation of total match wins using a histogram:
df['winner'].hist(bins=50)Output:
Toss winners most likely choose to field first in a 20 overs IPL match. Perception is that team choosing to field first and later chase the runs are most likely to win. To find if toss winners are most likely match winners? To find a correlation between toss and match winners, below code is used.
import matplotlib.pyplot as plt
fig = plt.figure(figsize=(8,4))
ax1 = fig.add_subplot(121)
ax1.set_xlabel('Team')
ax1.set_ylabel('Count of toss wins')
ax1.set_title("toss winners")
temp1.plot(kind='bar')
ax2 = fig.add_subplot(122)
temp2.plot(kind = 'bar')
ax2.set_xlabel('Team')
ax2.set_ylabel('count of matches won')
ax2.set_title("Match winners")
Output: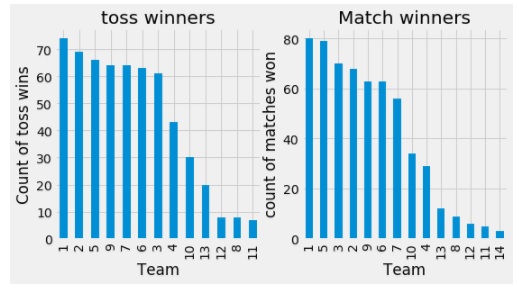
From the graph, most matches are won by 1 (MI) who also won most tosses. But this is not same for 2 (KKR) and 3 (RCB). With further discussions, it shall be noted that toss winning is not most important feature in match winning.
The scikit-learn open-source library provides machine learning in Python. This library requires all inputs to be numeric. All categorical variables should be converted into numeric variables using the concept of encoding with scikit-learn LabelEncoder. Later, a predictive model is created using a generic function called class_model that takes parameters model (algorithm), data, predictors input, and outcome predictable feature. Be aware of unexpected indent errors in Python while re-using the below code.
#Import models from scikit learn module:
from sklearn.linear_model import LogisticRegression
from sklearn.cross_validation import KFold   #For K-fold cross validation
from sklearn.ensemble import RandomForestClassifier
from sklearn.tree import DecisionTreeClassifier, export_graphviz
from sklearn import metrics

#Generic function for making a classification model and accessing performance:
def class_model(model, data, predictors, outcome):
  model.fit(data[predictors],data[outcome])
  predictions = model.predict(data[predictors])
  accuracy = metrics.accuracy_score(predictions,data[outcome])
  print('Accuracy : %s' % '{0:.3%}'.format(accuracy))
  kf = KFold(data.shape[0], n_folds=5)
  error = []
  for train, test in kf:
    train_predictors = (data[predictors].iloc[train,:])
    train_target = data[outcome].iloc[train]
    model.fit(train_predictors, train_target)
    error.append(model.score(data[predictors].iloc[test,:], data[outcome].iloc[test]))

  print('Cross validation Score : %s' % '{0:.3%}'.format(np.mean(error)))

  model.fit(data[predictors],data[outcome])
The k-fold cross (k=5) validation technique is used to reserve a sample set on which we do not train the model but it will be used to test the model before finalizing. Mean score error is used to determine the evaluation. Standard deviation could also be used for evaluation. More predictor variables may result in unseen training data. This unseen training data results in overfitting. The user needs to balance the training set and predictor variables based on the accuracy and cross-validation score.
A multiple model classifier was tested for given data. The RandomForestClassifier model showed an acceptable accuracy percentage of ~90%.
model = RandomForestClassifier(n_estimators=100)
outcome_var = ['winner']
predictor_var = ['team1', 'team2', 'venue', 'toss_winner','city','toss_decision']
classification_model(model, df,predictor_var,outcome_var)
Now, the model is trained using data frame (dataset) containing predictors variables like team1, team2, venue, toss_winner, city, and toss_decision to determine outcome variable winner. RandomForestClassifier also provides important features, like a matrix specifying numeric percentage influences for each of the predictor variables.
#feature importances: If we ignore teams, Venue seems to be one of important factors in determining winners
#followed by toss winning, city
imp_input = pd.Series(model.feature_importances_, index=predictor_var).sort_values(ascending=False)
print(imp_input)
Output:
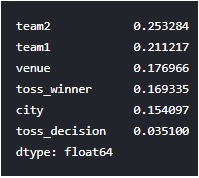
If we ignore team2 and team1, venue seems to have a higher value compared to toss_winners and toss_decision. This shows that venue is more important feature. toss_decision to field or bat first is the least important feature, comparatively. Let's plot a graph from the dataset to see if toss_winner is also match winner from the dataset.
import matplotlib.pyplot as mlt
mlt.style.use('fivethirtyeight')
df_fil=df[df['toss_winner']==df['winner']]
slices=[len(df_fil),(577-len(df_fil))]
mlt.pie(slices,labels=['Toss & win','Toss & lose'],startangle=90,shadow=True,explode=(0,0),autopct='%1.1f%%',colors=['r','g'])
fig = mlt.gcf()
fig.set_size_inches(6,6)
mlt.show()
Output:
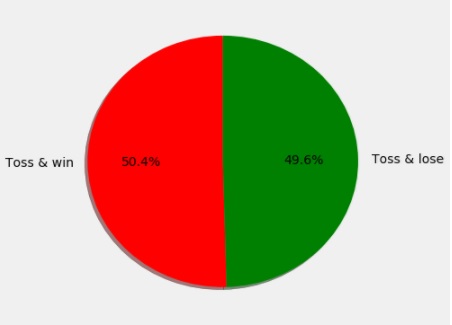
From dataset, toss_winners were also the match winner 50% of the time and it is not enough to determine the winner.
Let's consider the top two winning teams CSK and RCB and analyze the number of matches won against each other and how venue influenced their win? From the histogram bar chart, we saw that CSK won 79 matches and RCB won 70 matches. RCB is now compared with CSK on the number of matches won in different venues.
import seaborn as sns
team1=dicVal['CSK']
team2=dicVal['RCB']
mtemp=matches[((matches['team1']==team1)|(matches['team2']==team1))&((matches['team1']==team2)|(matches['team2']==team2))]
sns.countplot(x='venue', hue='winner',data=mtemp,palette='Set3')
mlt.xticks(rotation='vertical')
leg = mlt.legend( loc = 'upper right')
fig=mlt.gcf()
fig.set_size_inches(10,6)
mlt.show()
Output:
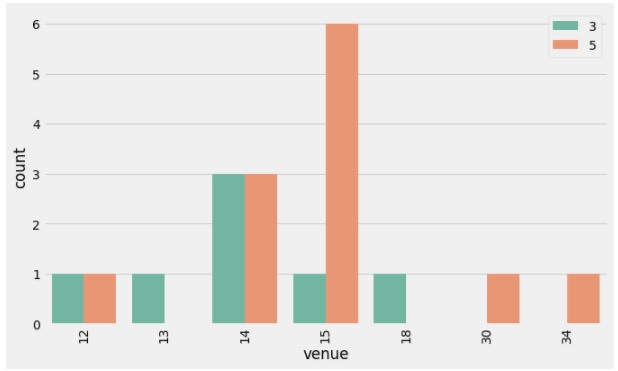
In the above graph, 5 (CSK) won six matches against one match won by 3 (RCB) in their home turf venue of 15 (MA Chidambaram Stadium, Chepauk). RCB won all of the matches in 18 (New Wanderers Stadium) and 13 (Kingsmead stadium). When 1 (MI) is compared with 5 (CSK), 1 (MI) have won more matches in their home turf 34 (Wankhede stadium) against 5 (CSK), as shown in the below graph.
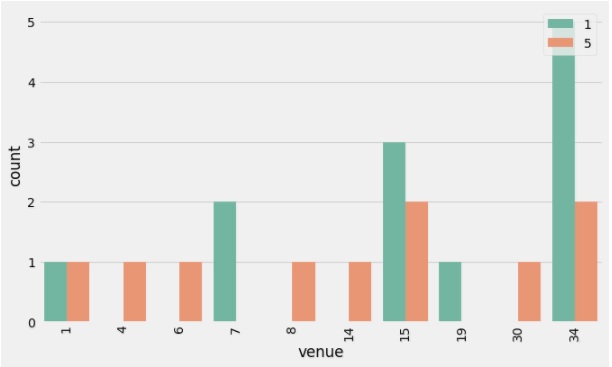
Clearly, venue is a more important feature compared to toss winner. The model is now ready for prediction. Below is the input to the model. The outcome variable will predict the winner.
#'team1', 'team2', 'venue', 'toss_winner','city','toss_decision'
team1='DC'
team2='DD'
toss_winner='DC'
input=[dicVal[team1],dicVal[team2],'23',dicVal[toss_winner],'14','0']
input = np.array(input).reshape((1, -1))
outcome=model.predict(input)
print(list(dicVal.keys())[list(dicVal.values()).index(outcome)]) #find key by value search output
#output:
#DD
Conclusion
Data-driven predictive models could be a way forward in IPL team management. Data-driven recommendations could also be developed for player selection. Predictive analytics could seek to pick probable winners and help manage risk better. Analytics bridges the gap between team managers and team coaches. These data insights and quantifications provide precise and timely answers. These compelling charts, reports, and predictive models can be automated for continuous updates by streaming input data. Again, the source code is available on GitHub.
Opinions expressed by DZone contributors are their own.
Comments