Java Container Application Memory Analysis
In this article, I cover types of memory usage for a Java container application and methods to analyze memory consumption.
Join the DZone community and get the full member experience.
Join For FreeFor container applications, it's hard to find problems resulting from memory overuse. In case usage goes beyond container memory limit, an application can silently fail without leaving any trace.
In this article, I’ll go through some of the techniques that can be used to identify the source of memory consumption in a Java container application.
Memory Type
In a typical Java application, memory can be broadly divided into heap and non-heap. Heap memory can be set by providing relevant JVM parameters when starting any Java application.
Non-heap memory consists of native memory used by JVM itself or by any library used within the application using JNI (Java Native Interface).
Method
For heap memory, heap dump can be taken and analyzed using heap dump analysis tools. One of the best tools for heap dump analysis is eclipse MAT.
Java provides a mechanism to track native memory allocation by enabling native memory tracking, but it may not reveal all memory allocated by native libraries.
Jemalloc is a utility that can be used to track memory allocated by native libraries. Native memory is allocated using a default memory allocator called malloc. Jemalloc is a general-purpose malloc implementation with which memory allocation tracking can be enabled. It tracks all native memory allocation and generates heap profile dumps.
These heap profiles can then be analyzed using Jeprof utility. Jeprof generates the heap allocation report, highlighting memory used by functions in the application.
Analysis
Below is a memory analysis of a sample container Java application. The application loads a sample Tensorflow model to enable native memory utilization and runs in a Docker container.
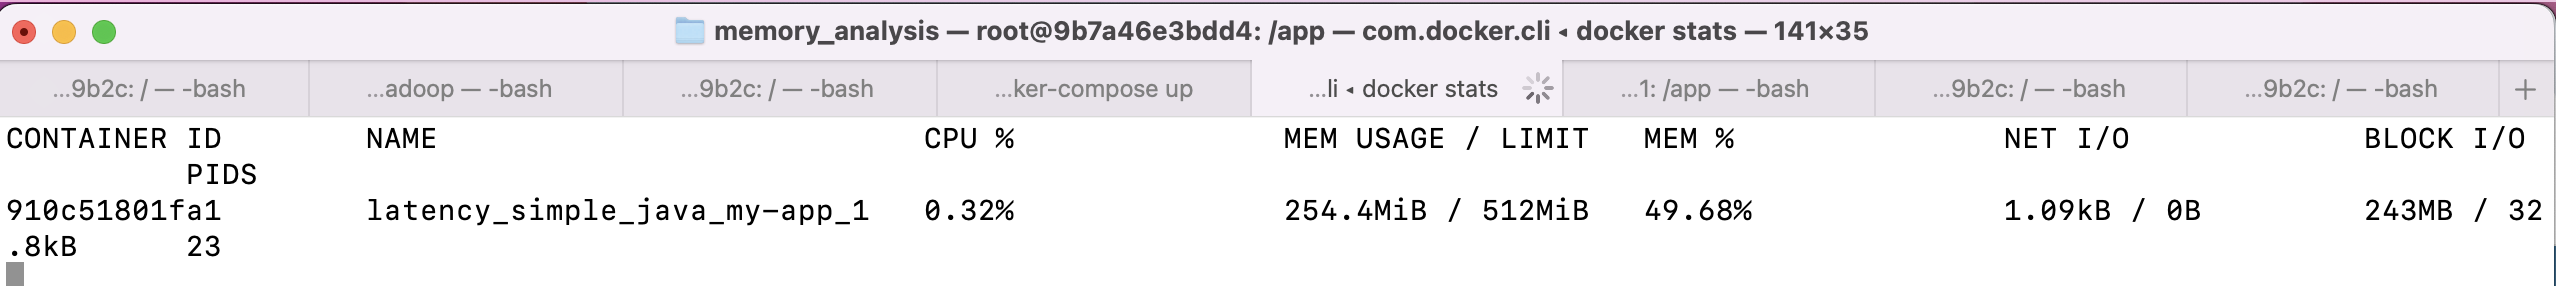
Below is the Docker memory consumption. It shows 254MB. Let's try to pinpoint the source of memory consumption.
Total Memory
To get a sense of the total memory being used by the application process, we can check Resident Set Size (RSS). It is the total committed memory that resides in the main memory or RAM. There are multiple utilities that can help check this like top, ps, or pmap.
Checking RSS does not help pinpoint the root source of usage. For the sample application, using the below command, the total RSS is 376MB.
ps --no-header -o rss $(pidof java)Heap Analysis
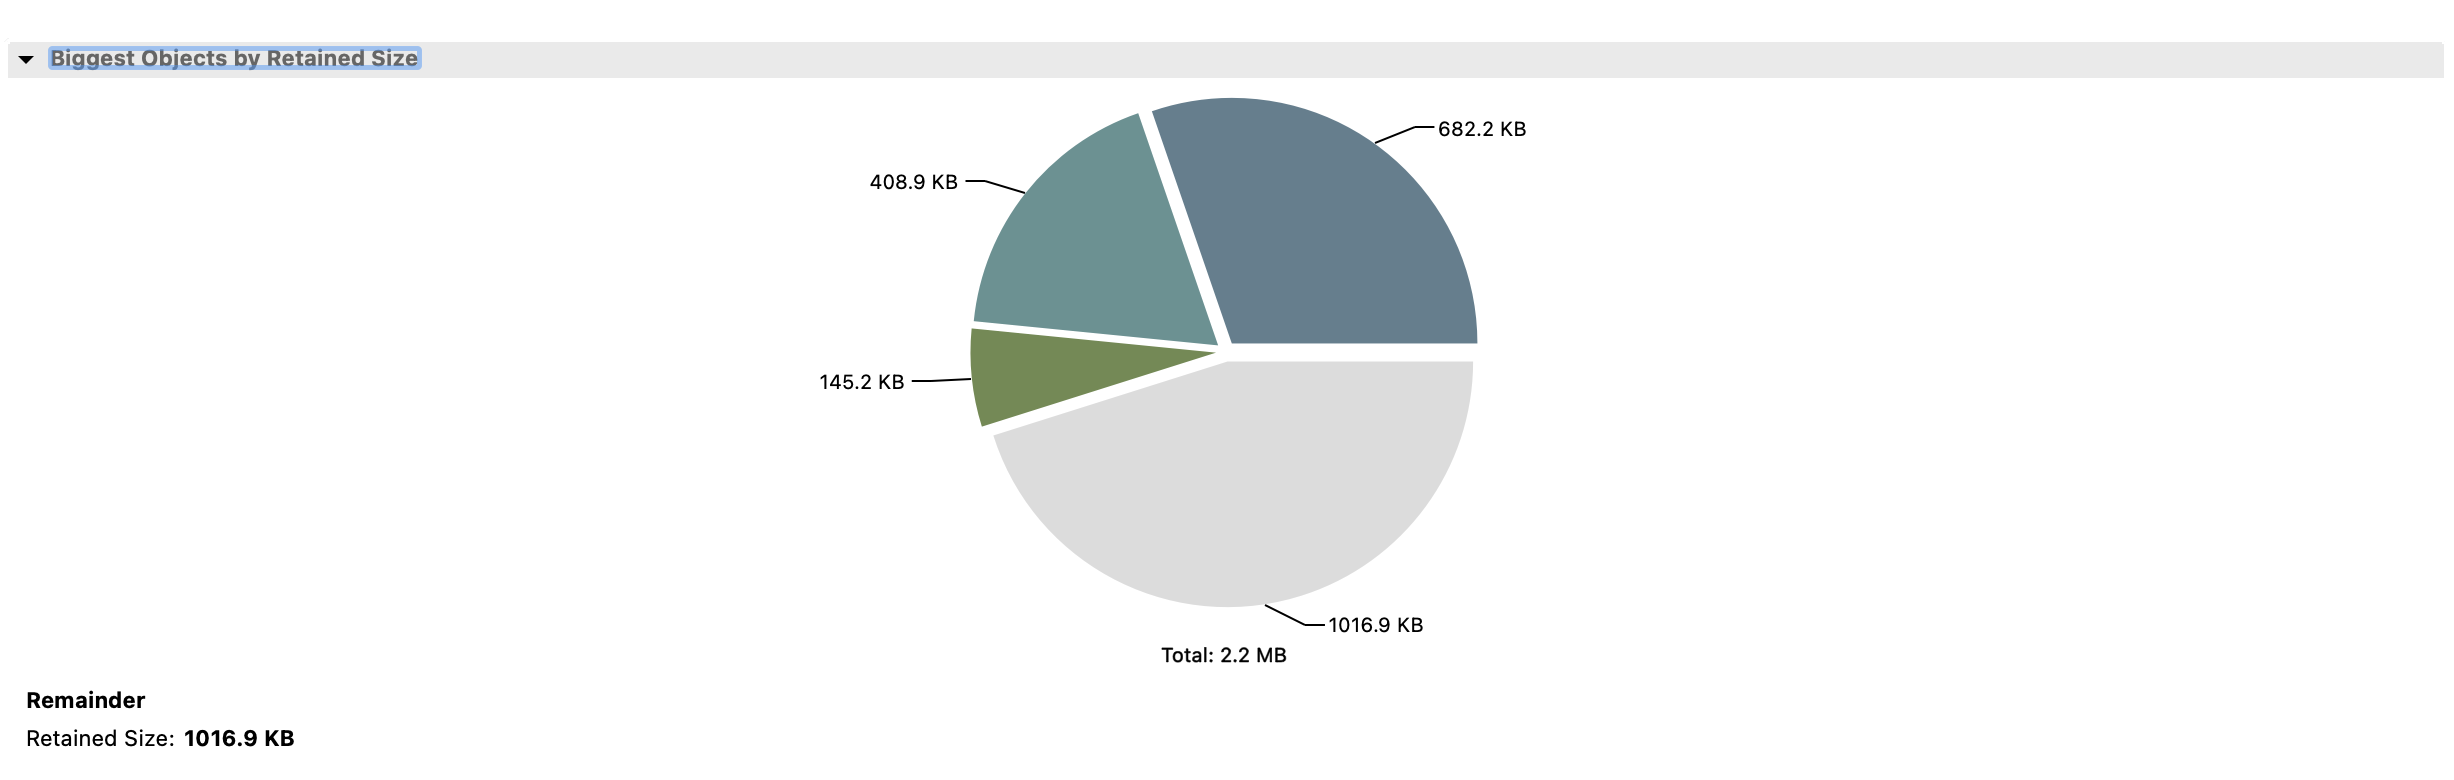
Below is heap memory consumption as generated by the eclipse MAT tool. The total retained heap is shown as 2.2MB, which is way below the total memory consumption shown by Docker and indicates the majority of consumption from the non-heap area.
Native Memory Analysis
Upon reviewing the native memory summary using the command below, the total memory usage appears to be approximately 99MB. However, this value is less than the total memory consumption and does not accurately identify the root cause of the issue.
jcmd $(pidof java) VM.native_memory \
    | grep -P "Total.*committed=" \
    | grep -o -P "(?<=committed=)[0-9]+(?=KB)"
Off-Heap Memory Analysis
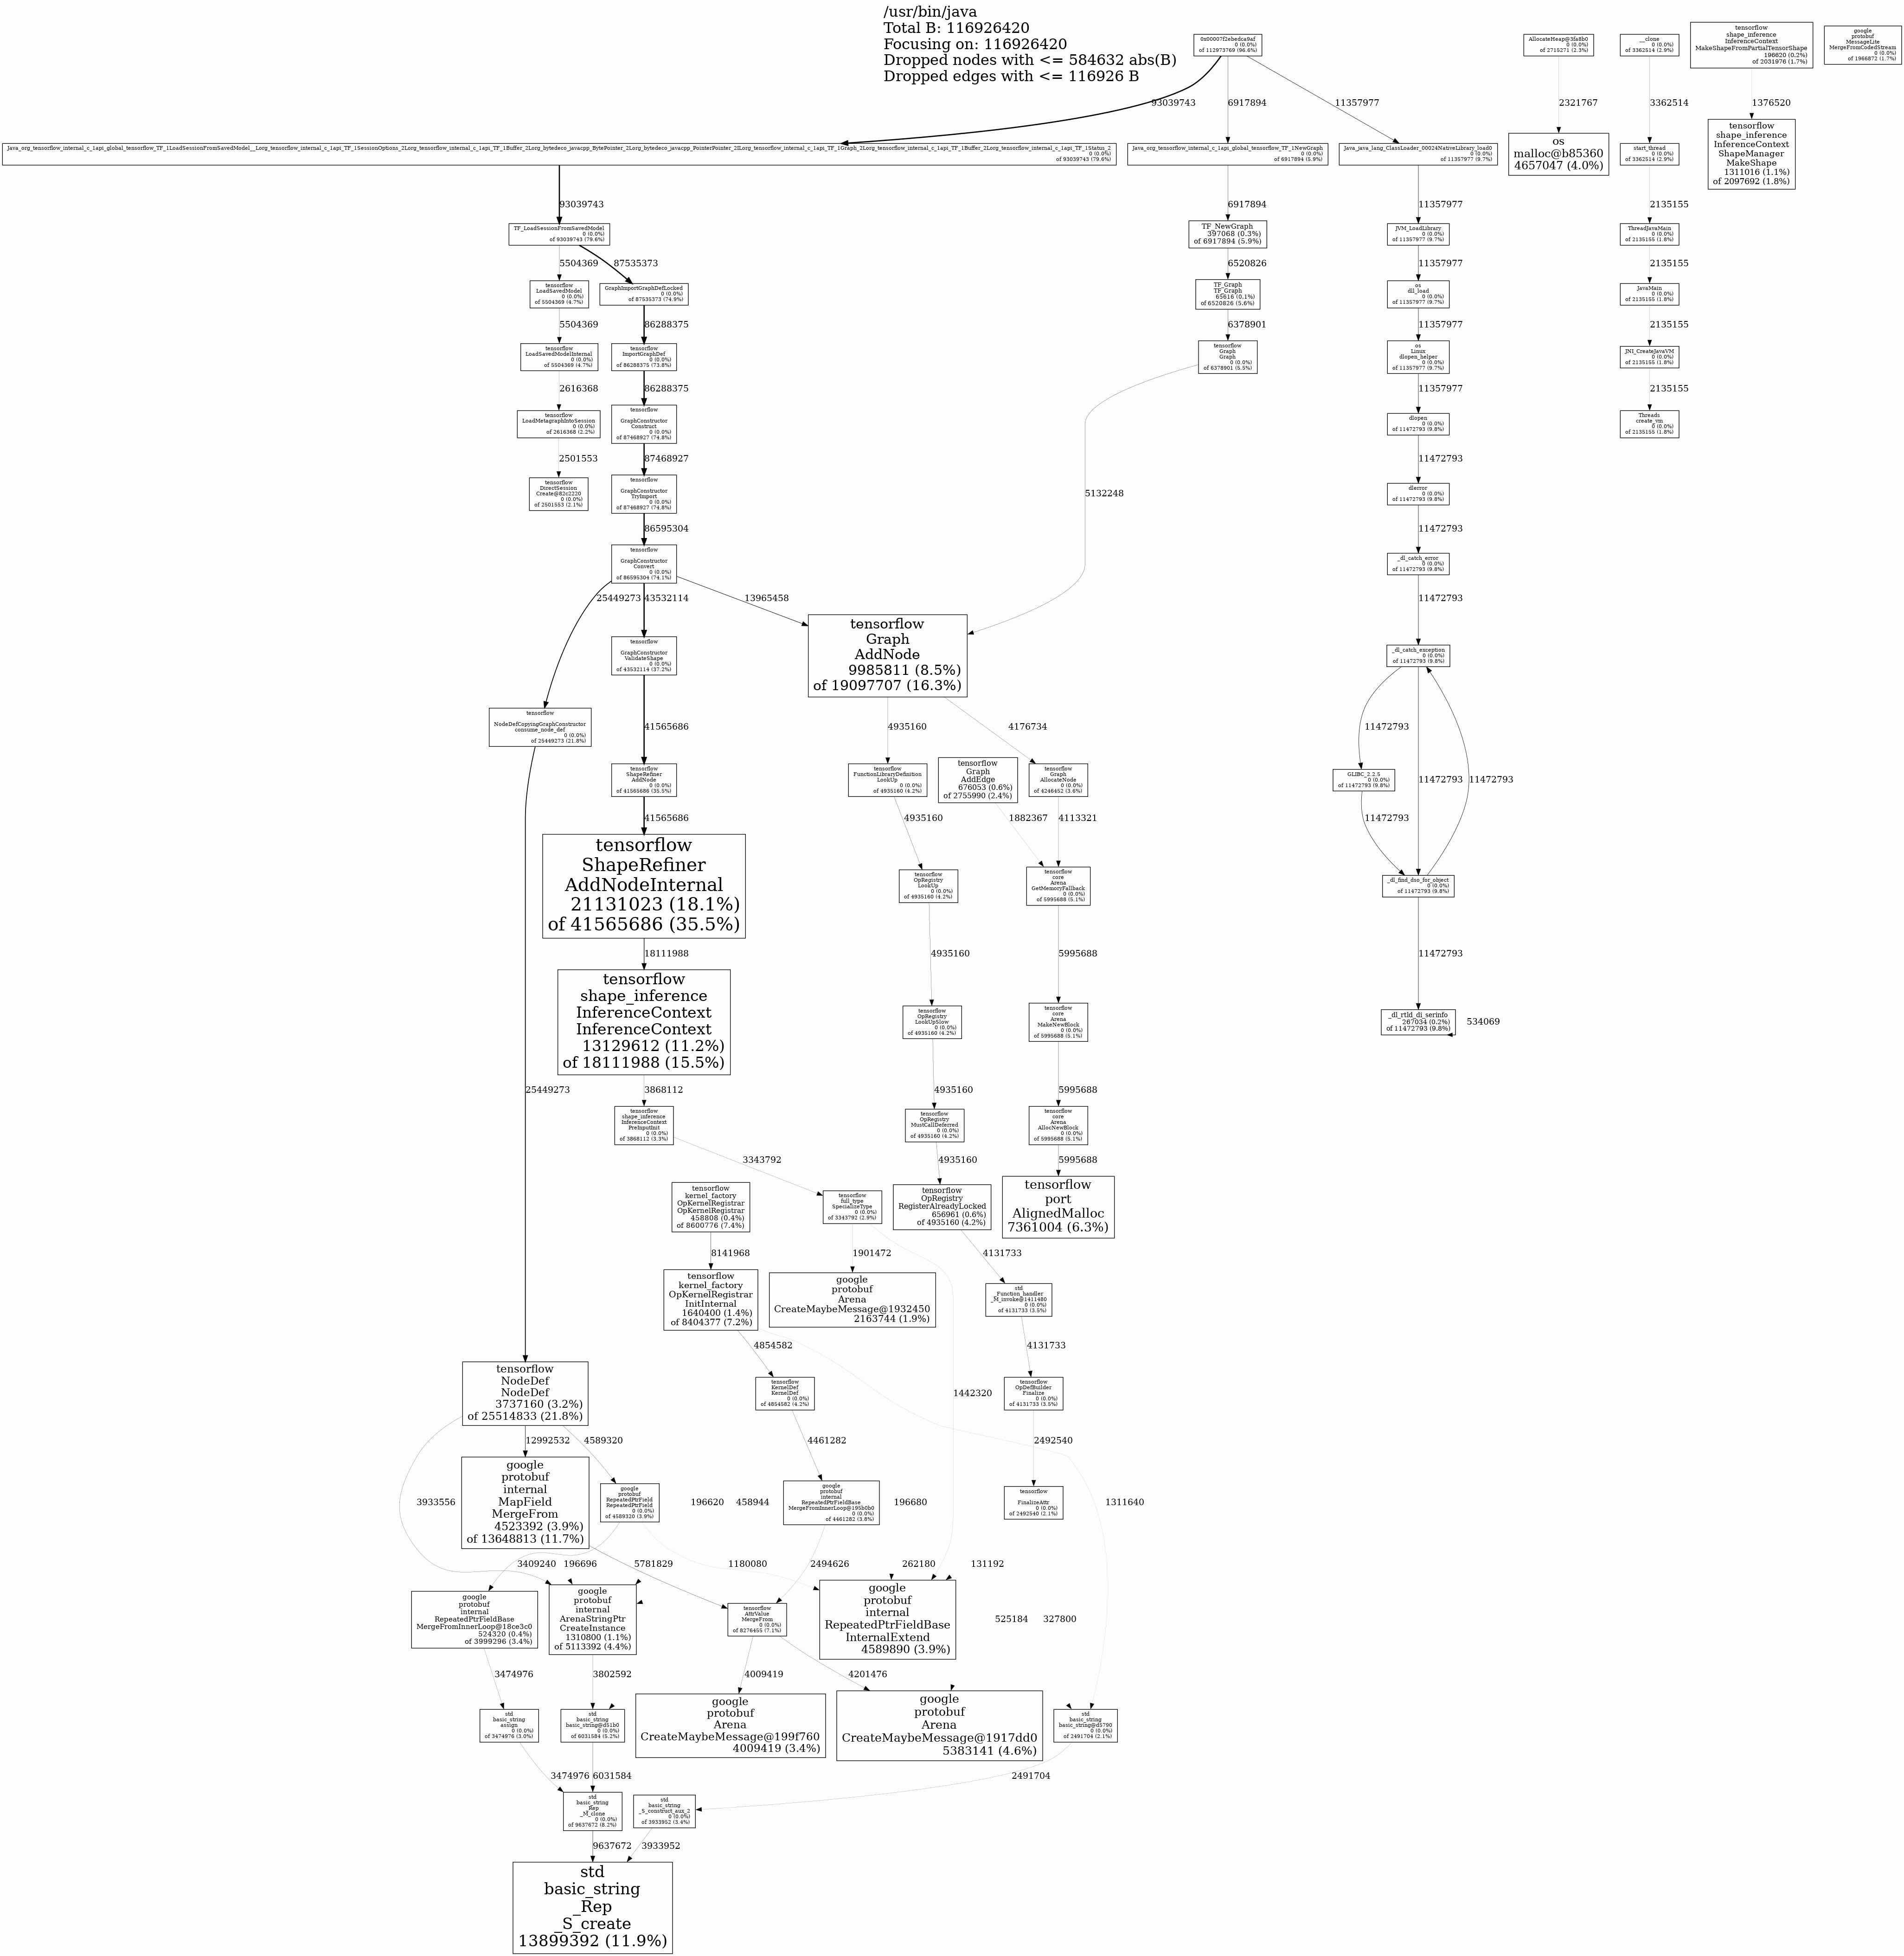
An analysis using Jemalloc and Jeprof reveals that native memory usage is primarily attributed to the Tensorflow library, with a total consumption of approximately 112MB.
This insight provides a clear indication of the source of native memory usage and can be further investigated to minimize any excessive consumption.
Conclusion
Java memory analysis is critical, especially for container-based applications. Knowing the source of memory consumption in an application can help us understand the memory requirement and lower application costs by removing unnecessary consumption.
When checking memory consumption, all types of memory and their sources need to be pinpointed. Heap dump analysis can pinpoint heap memory consumption sources, and Jemalloc and Jeprof are useful in pinpointing native memory consumption sources.
Sample Application Code Link
Opinions expressed by DZone contributors are their own.
Comments