The Invisible OOMKill: Why Your Java Pod Keeps Restarting in Kubernetes
A Kubernetes pod may restart due to an OOMKill when the Java process exceeds the container’s memory limit. JVM memory tuning and correct resource limits prevent crashes.
Join the DZone community and get the full member experience.
Join For FreeImagine deploying a robust Spring Boot microservice that passes every integration test in your local Docker environment, only to watch it crash loop endlessly shortly after launching to your Kubernetes production cluster. Everything ran fine on your laptop, but in the live environment, your pods start terminating en masse. Requests to your critical endpoints begin failing with 503 errors. Panic sets in as your service, the backbone of your transaction pipeline, is effectively brought down by an invisible foe.
In our recent migration to a cloud-native architecture, the culprit was a hidden memory configuration issue involving how the Java Virtual Machine interacts with Kubernetes container limits. A tiny mismatch in resource allocation, something that went unnoticed during development, led to a chain reaction of OOMKilled events in production.
In this article, we will walk through the scenario step by step, including how the problem manifested and how we diagnosed the root cause. We will discuss the configuration that was to blame and the fixes and best practices that emerged from the post-mortem. Along the way, we will highlight common Kubernetes pitfalls for Java developers that can similarly wreak havoc if left unchecked.
Symptoms: When Pods Turn Against You
The first sign of trouble was our monitoring dashboard lighting up with red alerts. Shortly after deploying our new payment service, we noticed patterns like mass restarts where pods that had started successfully were suddenly restarting every few minutes. This was not a one-off fluke since it was happening across all replicas simultaneously.
Our ingress controller started returning 503 Service Unavailable responses. Essentially, Kubernetes was killing the pods before they could serve traffic. Digging into application logs revealed nothing unusual. There were no stack traces or Java exceptions. The logs simply stopped abruptly. However, checking the Kubernetes pod status revealed the cryptic message Reason: OOMKilled.
This error essentially means the container exceeded its memory limit and was terminated by the Linux kernel. At first glance, we were not sure why this would happen. We had set the JVM heap size to 512 MB, and our Kubernetes memory limit was set to 1 GB. Surely there was enough headroom. Why would the kernel kill the process when the heap was only half the limit?
The impact of this issue was severe. Since our app relied on steady uptime for processing transactions, widespread pod instability meant no requests could be completed. In effect, our service was down for all users until the issue was resolved.
Reproducing and Observing the Failure
In our staging environment, we tried to reproduce the sequence of events. We deployed the same Docker image and applied the same Kubernetes manifests. We watched the memory usage via kubectl top pods. Sure enough, as the load increased, the container memory usage climbed steadily until it hit the limit and the pod vanished.
Interestingly, the application worked fine under low load. The issue only surfaced during peak traffic when non-heap memory usage spiked. This was a crucial clue. It hinted that the JVM heap was not the only consumer of memory within the container. We realized that focusing solely on heap size was a mistake.
Understanding JVM vs. Container Memory
At this point, it is helpful to explain how the JVM accounts for memory within a container. Many Java developers assume that the max heap flag controls the total memory usage of the process. However, the JVM requires memory for more than just the heap.
Metaspace is used for class metadata. Thread Stacks require memory for each thread. Code cache is used for JIT-compiled code. Garbage collector structures need internal data structures for GC. Direct buffers handle NIO direct memory.
In older Java versions, the JVM was not container-aware. It would calculate memory limits based on the host machine RAM, not the container limit. While modern Java versions have improved container awareness, they still require explicit configuration to ensure the non-heap memory fits within the Kubernetes cgroup limit.
In our case, the JVM heap was set to 512 MB, but the non-heap memory usage under load grew to approximately 600 MB. Total usage was 1.1 GB. Kubernetes Limit was 1 GB. The result was OOMKilled.
The Misconfigured Manifest and How It Failed
Let us look at a simplified version of the Kubernetes deployment manifest that led to this issue.
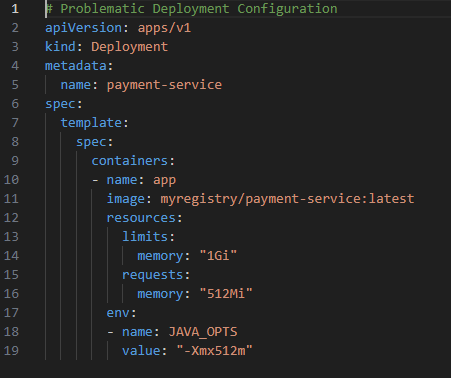
We set the Kubernetes memory limit to 1Gi. We set the JVM max heap to 512m. On paper, this looks safe. However, we failed to account for the JVM off-heap memory footprint. When the application loaded large libraries or processed high volumes of concurrent requests, the non-heap memory expanded, pushing the total process size over the 1Gi cgroup limit.
Unlike the OAuth token issue, where the server rejected us, here the Linux kernel simply killed the process without warning the application. There was no chance to log an error or gracefully shut down. This silent failure made debugging incredibly difficult since the application never got a chance to speak.
How We Fixed It: Correct Memory Alignment
The fix for this issue was twofold. We needed to adjust the Kubernetes limits and tune the JVM flags to respect those limits dynamically.
First, we increased Container Limits. We raised the memory limit to provide sufficient headroom for non-heap usage. Second, we decided to use a percentage-based heap. Instead of a fixed max heap value, we configured the JVM to use a percentage of the container's available memory.
Here is the corrected configuration we applied. We used the MaxRAMPercentage flag so the JVM automatically calculates the heap size based on the cgroup limit detected at runtime. This prevents the configuration from becoming stale if we change the Kubernetes limits later. We also increased the total limit to ensure the remaining 25 percent was sufficient for metaspace and threads.
This change allowed the JVM to adapt to the environment automatically. It removed the hard-coded assumption about available memory. This is critical in cloud environments where resource limits might change based on scaling policies.
Preventing Similar Issues: Best Practices for Java on Kubernetes
We learned several valuable lessons during this incident. We incorporated these into our development standards to prevent recurrence.
- Always account for non-heap memory: Never set the max heap equal to the container memory limit. Always leave at least 20-25 percent of the container memory for off-heap usage. This buffer is essential for stability.
- Use modern base images: Ensure you are using JDK versions that support container awareness. Java 8 update 191 or later is required. Java 11 or 17 is better. Consider using distroless images or Jib to reduce the attack surface and image size.
- Configure liveness probes carefully: A common pitfall is setting liveness probes too aggressively. If your Java app pauses for garbage collection, it might miss a probe timeout and get killed unnecessarily. Add initial delay and failure thresholds to accommodate GC pauses.
- Monitor memory trends: Implement monitoring using Prometheus and Grafana. Track both container memory usage bytes and JVM-specific metrics like JVM memory used bytes. Alert when usage approaches 80 percent of the limit. This gives you time to react before the kernel steps in.
- Simulate load in staging: One reason this bug slipped by is that in development, we rarely simulated production-level concurrency. To prevent such surprises, we now use tools like k6 or JMeter in our staging cluster to validate memory stability under load.
- Secure your secrets: Ensure you store sensitive configuration securely. In Kubernetes, use Secrets mounted as environment variables or files rather than hardcoding them in Docker images. This prevents accidental exposure during debugging.
- Handle graceful shutdowns: Configure your Spring Boot app to handle SIGTERM signals properly. Kubernetes sends this signal before killing a pod. Ensure your application stops accepting new requests and finishes processing in-flight requests before shutting down.
The Human Element in Incident Response
Beyond the technical fixes, we also improved our response process. We established a blameless post-mortem culture. This encouraged team members to share mistakes without fear. We documented the incident in our internal knowledge base. This ensures new team members learn from our experience. We also added a checklist for production deployments. This checklist includes verifying JVM flags and memory limits. These process changes are just as important as the code changes.
Conclusion
Kubernetes is powerful, but with power comes complexity. Our Java service went down due to a tiny memory alignment bug, something easy to overlook but with catastrophic consequences in production. The hidden issue was simply that we were not accounting for the JVM total memory footprint versus the container cgroup limit. Once identified, the fix was a configuration change, yet it brought to light the importance of thoroughly understanding how your runtime interacts with the orchestration layer.
In the aftermath, we reinforced our processes. We simulate real-world load in testing and added robust monitoring around memory usage. We kept an eye on JVM flags for containerized environments. By sharing this story, we hope to spare others that moment of dread when you realize your service at the front door to your business logic has unexpectedly locked out your users due to a silent kernel kill.
In the end, our system is now stable and more resilient. We treat container resources with greater care. We always align JVM flags with Kubernetes limits. We guard them like the infrastructure keys to the kingdom that they are. We never assume something as critical as resource management will just work without thorough validation. Kubernetes got the best of us once, but with these lessons learned, we are determined not to let a sneaky configuration issue slip by again. Happy and safe coding.
Opinions expressed by DZone contributors are their own.
Comments