Monitoring Java Microservices on EKS Using New Relic APM and Kubernetes Metrics
Monitor Java microservices on Amazon EKS using New Relic APM. Set up JVM agents, tune GC settings, and track Kubernetes metrics with dashboards and alerts.
Join the DZone community and get the full member experience.
Join For FreeAmazon EKS makes running containerized applications easier, but it doesn’t give you automatic visibility into JVM internals like memory usage or garbage collection. For Java applications, observability requires two levels of integration:
- Cluster-level monitoring for pods, nodes, and deployments
- JVM-level APM instrumentation for heap, GC, threads, latency, etc.
New Relic provides both via Helm for infrastructure metrics, and a lightweight Java agent for full JVM observability.
In containerized environments like Kubernetes, surface-level metrics (CPU, memory) aren’t enough. For Java apps, especially those built on Spring Boot, the real performance story lies inside the JVM. Without insight into heap usage, GC behavior, and thread activity, you're flying blind.
New Relic bridges this gap by combining infrastructure-level monitoring (via Prometheus and kube-state-metrics) with application-level insights from the JVM agent. This dual visibility helps teams reduce mean time to resolution (MTTR), avoid OOMKilled crashes, and tune performance with confidence.
This tutorial covers:
- Installing New Relic on EKS via Helm
- Instrumenting your Java microservice with New Relic’s Java agent
- JVM tuning for container environments
- Monitoring GC activity and memory usage
- Creating dashboards and alerts in New Relic
- Optional values.yaml file, YAML bundle, and GitHub repo
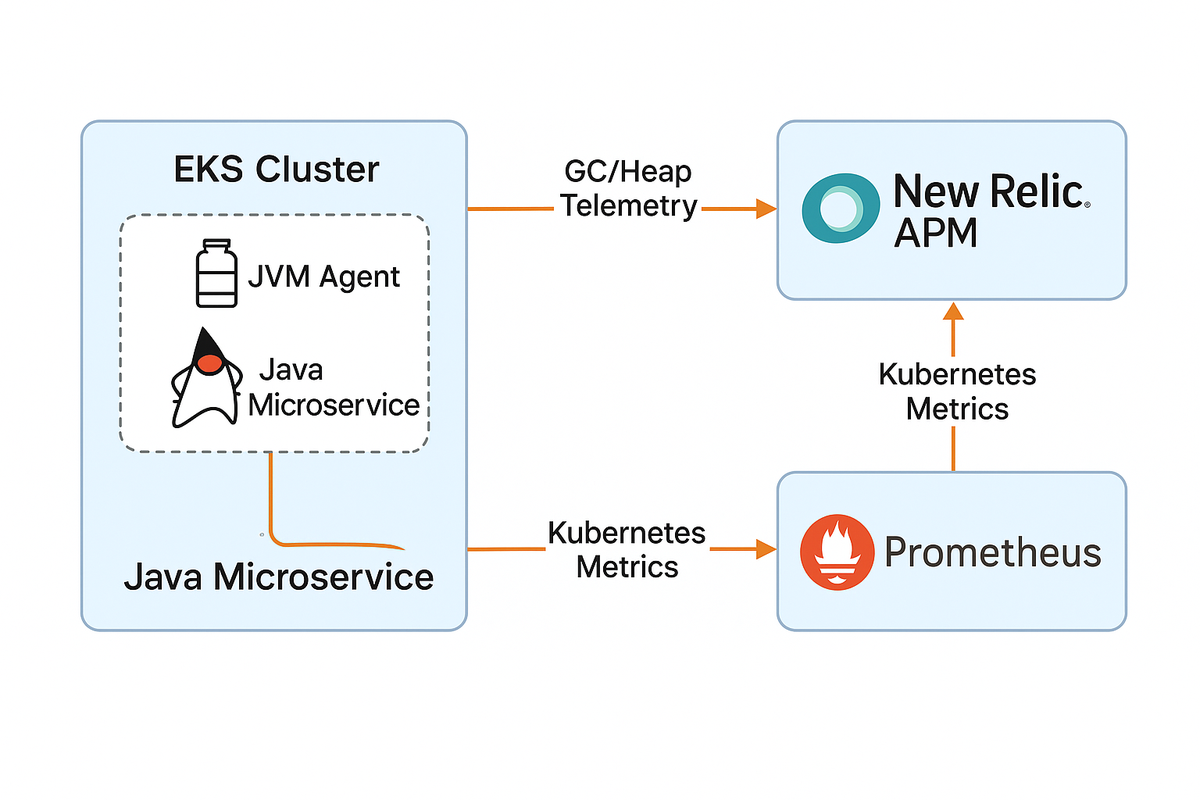
Figure 1: Architecture of JVM monitoring on Amazon EKS using New Relic.
The Java microservice runs inside an EKS pod with the New Relic JVM agent attached. It sends GC, heap, and thread telemetry to New Relic APM. At the same time, Prometheus collects Kubernetes-level metrics, which are forwarded to New Relic for unified observability.
Prerequisites
- Amazon EKS cluster with kubectl and helm configured
- A Java-based app (e.g., Spring Boot) deployed in EKS
- New Relic account (free tier is enough)
- Basic understanding of JVM flags and Kubernetes manifests
Install New Relic’s Kubernetes Integration (Helm)
This installs the infrastructure monitoring components for cluster, pod, and container-level metrics.
Step 1: Add the New Relic Helm repository
helm repo add newrelic https://helm-charts.newrelic.com
helm repo update
Step 2: Install the monitoring bundle
helm install newrelic-bundle newrelic/nri-bundle \
  --set global.licenseKey=<NEW_RELIC_LICENSE_KEY> \
  --set global.cluster=<EKS_CLUSTER_NAME> \
  --namespace newrelic --create-namespace \
  --set newrelic-infrastructure.enabled=true \
  --set kube-state-metrics.enabled=true \
  --set prometheus.enabled=true
Replace <NEW_RELIC_LICENSE_KEY> and <EKS_CLUSTER_NAME> with your actual values.
Instrument Your Java Microservice With the New Relic Agent
Installing the Helm chart sets up cluster-wide observability, but to monitor JVM internals like heap usage, thread activity, or GC pauses, you need to attach the New Relic Java agent.
This gives you:
- JVM heap, GC, thread metrics
- Response times, error rates, transaction traces
- GC pauses and deadlocks
Dockerfile (add agent):
ADD https://download.newrelic.com/newrelic/java-agent/newrelic-agent/current/newrelic-java.zip /opt/
RUN unzip /opt/newrelic-java.zip -d /opt/
JVM startup args:
-javaagent:/opt/newrelic/newrelic.jarRequired environment variables:
- name: NEW_RELIC_APP_NAME
  value: your-app-name
- name: NEW_RELIC_LICENSE_KEY
  valueFrom:
    secretKeyRef:
      name: newrelic-license
      key: license_key
Create the secret:
kubectl create secret generic newrelic-license \
   --from-literal=license_key=<YOUR_NEW_RELIC_LICENSE_KEY>
Capture Kubernetes Metrics
New Relic Helm install includes:
- newrelic-infrastructure → Node, pod, container metrics
- kube-state-metrics → Kubernetes objects
- prometheus-agent → Custom metrics support
Verify locally:
kubectl top pods
kubectl top nodes
In New Relic UI, go to: Infrastructure → Kubernetes
JVM Tuning for GC and Containers
To avoid OOMKilled errors and track GC behavior, tune your JVM for Kubernetes:
Recommended JVM Flags:
-XX:+UseContainerSupport
-XX:MaxRAMPercentage=75.0
-XshowSettings:vm
-XX:+PrintGCDetails
-XX:+PrintGCDateStamps
-Xloggc:/tmp/gc.log
Make sure /tmp is writable or mount it via emptyDir.
Pod resources:
resources:
  requests:
    memory: "512Mi"
    cpu: "250m"
  limits:
    memory: "1Gi"
    cpu: "500m"
Align MaxRAMPercentage with limits.memory.
Why JVM Monitoring Matters in Kubernetes
Kubernetes enforces resource limits on memory and CPU, but by default, the JVM doesn’t respect those boundaries. Without proper tuning, the JVM might allocate more memory than allowed, triggering OOMKilled errors.
Attaching the New Relic Java agent gives you visibility into GC pauses, heap usage trends, and thread health all of which are critical in autoscaling microservice environments. With these insights, you can fine-tune JVM flags like `MaxRAMPercentage`, detect memory leaks early, and make data-driven scaling decisions.
Dashboards and Alerts in New Relic
Create an alert for GC pause time:
- Go to Alerts & AI → Create alert
- Select metric: JVM > GC > Longest GC pause
- Set threshold: e.g., pause > 1000 ms
Suggested Dashboards:
- JVM heap usage
- GC pause trends
- Pod CPU and memory usage
- Error rate and latency
Use New Relic’s dashboard builder or import JSON from your repo.
Forwarding GC Logs to Amazon S3
While New Relic APM provides GC summary metrics, storing full GC logs is helpful for deep memory analysis, tuning, or post-mortem debugging. Since container logs are ephemeral, the best practice is to forward these logs to durable storage like Amazon S3.
Why S3?
- Persistent log storage beyond pod restarts
- Useful for memory tuning, forensic reviews, or audits
- Cost-effective compared to real-time log ingestion services
Option: Use Fluent Bit with S3 Output Plugin
1. Enable GC logging with:
-Xloggc:/tmp/gc.log2. Mount /tmp with emptyDir in your pod
3. Deploy Fluent Bit as a sidecar or DaemonSet
Make sure your pod or node has an IAM role with s3:PutObject permission to the target bucket.
This setup ensures your GC logs are continuously shipped to S3 for safe, long-term retention even after the pod is restarted or deleted.
Troubleshooting Tips
|
Problem |
Fix |
|
APM data not showing |
Verify license key, agent path, app traffic |
|
JVM metrics missing |
Check -javaagent setup and environment vars |
|
GC logs not collected |
Check -Xloggc path, permissions, volume mount |
|
Kubernetes metrics missing |
Ensure Prometheus is enabled in Helm values |
Check logs with:
kubectl logs <pod-name> --container <container-name>Conclusion
New Relic allows you to unify infrastructure and application observability in Kubernetes environments. With JVM insights, GC visibility, and proactive alerts, DevOps and SRE teams can detect and resolve performance issues faster.
After setting up JVM and Kubernetes monitoring, consider enabling distributed tracing to get visibility across service boundaries. You can also integrate New Relic alerts with Slack, PagerDuty, or Opsgenie to receive real-time incident notifications.
Finally, use custom dashboards to compare performance across dev, staging, and production environments, helping your team catch regressions early and optimize for reliability at scale.
Opinions expressed by DZone contributors are their own.
Comments