Java Threads: Are They Memory Efficient?
A developer runs through an experiment that tested the memory use of Java threads and how to optimize your use of Java threads in your code.
Join the DZone community and get the full member experience.
Join For FreeJava applications tend to contain hundreds (sometimes thousands) of threads. The majority of these threads are in a WAITING or TIMED_WAITING (i.e., dormant) state, while only a small portion are actively executing lines of code. So, we were curious to know whether dormant threads consume less memory than active threads.
To figure out the answer to this question, we conducted a small study.
What Is Stored in the Thread’s Stack?
Before you read further, you should first know what information is stored in the thread’s stack. To get a complete picture of what information is stored in the thread’s stack, you can refer to this article. In a nutshell, the following is stored in the thread’s stack:
- Local variables that are created in the method.
- The code path that is currently being executed by the thread.
Study
To facilitate our study, we wrote two simple programs. Let’s review these two programs and their performance characteristics.
1. Threads With Empty Stack Frames
We created a simple Java program that will create 1000 threads. All the threads in this program will have their stack frames almost empty so that it doesn’t have to consume any memory.
public class EmptyStackFrameProgram {
public void start() {
// Create 1000 threads
for (int counter = 0; counter < 1000; ++counter) {
new EmptyStackFrameThread().start();
}
}
}
public class EmptyStackFrameThread extends Thread {
public void run() {
try {
// Just sleep forever
while (true) {
Thread.sleep(10000);
}
} catch (Exception e) {
}
}
}
In this Java program, 1000 threads are created in the EmptyStackFrameProgram class. All the EmptyStackFrameThread threads go into an infinite sleep, and they don’t do anything. This means that their stack frame will be almost empty because they aren’t executing any new lines of code or creating any new local variables.
Note: We are putting the threads into infinite sleep so they will not die down, which is essential to study their memory usage.
2. Threads With Loaded Stack Frames
Here is another simple Java program that will create 1000 threads. All the threads in this program will have their stack frames fully loaded with data so that they will consume a lot more memory than the earlier program.
public class FullStackFrameProgram {
public void start() {
// Create 1000 threads with full stack
for (int counter = 0; counter < 1000; ++counter) {
new FullStackFrameThread().start();
}
}
}
public class FullStackFrameThread extends Thread {
public void run() {
try {
int x = 0;
simpleMethod(x);
} catch (Exception e) {
}
}
/**
* Loop for 10,000 times and then sleep. So that stack will be filled up.
*
* @param counter
* @throws Exception
*/
private void simpleMethod(int x) throws Exception {
// Creating local variables to fill up the stack.
float y = 1.2f * x;
double z = 1.289898d * x;
// Looping for 10,000 iterations to fill up the stack.
if (x < 10000) {
simpleMethod(++x);
}
// After 10,000 iterations, sleep forever
while (true) {
Thread.sleep(10000);
}
}
}
In this Java program, 1000 threads are created in the FullStackFrameProgram class. All the FullStackFrameThread threads invoke the simpleMethod(int counter)10,000 times. After 10,000 invocations, threads will go into infinite sleep. Since the thread is invoking the simpleMethod(int counter), 10,000 times, each thread will have 10,000 stack frames and each stack frame will be filled up with local variables ‘x’, ‘y’, ‘z’.
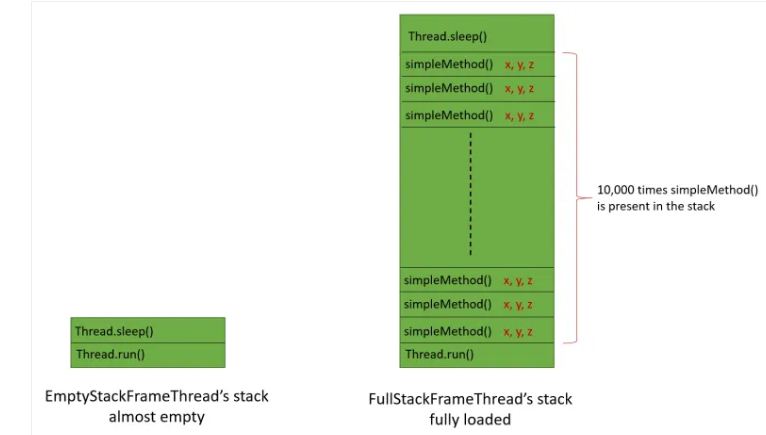
Fig: EmptyStackFrameThread and FullStackFrameThread stack
The above diagram shows the visualization of EmptyStackFrameThread’s stack and FullStackFrameThread’s stack. You can notice EmptyStackFrameThread contains only two stack frames. On the other hand, FullStackFrameThread contains 10,000+ stack frames. Besides that, each stack frame of FullStackFrameThread will contain the local variables x, y, z. This will cause the FullStackFrameThread stack to be fully loaded. Thus, one would expect the FullStackFrameThread stack to consume more memory.
Memory Consumption
We executed the above two programs with following settings:
- Configured the thread’s stack size to 2 MB (i.e., passed -Xss2m JVM argument to both programs).
- Used OpenJDK 1.8.0_265, 64-Bit Server VM.
- Run both the programs simultaneously on AWS ‘t3a.medium’ EC2 instances.
Below you can see the program’s memory consumption reported by the system monitoring tool ‘top’ .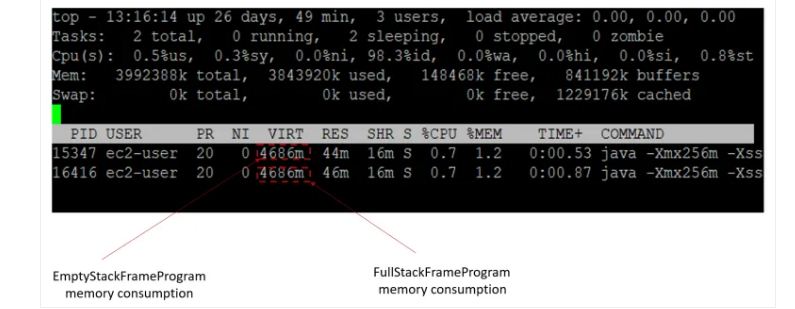
Fig: Memory consumption of both programs are same
You'll notice both the programs are consuming exactly 4686 MB of memory. This indicates both program threads consume the same amount of memory, even though FullStackFrameThread is hyperactive, whereas EmptyStackFrameThread is almost dormant.
To validate this theory, we further analyzed both the programs using the JVM root cause analysis tool yCrash. Below is the thread analysis report generated by the yCrash tool.
Fig: yCrash reporting that EmptyStackFrameThread stack is almost empty
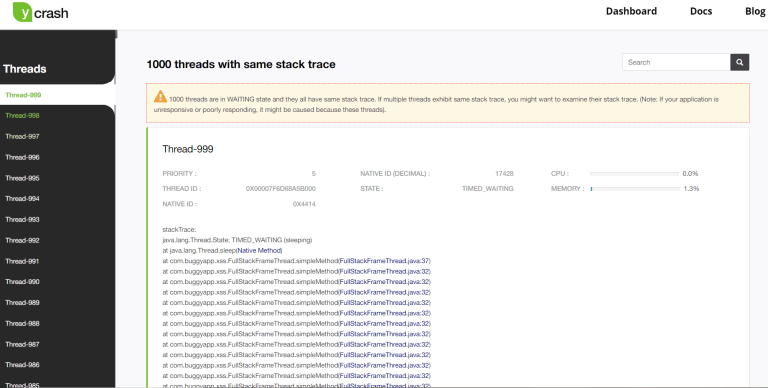
Fig: yCrash reporting that the FullStackFrameThread stack is almost full
yCrash also clearly points out that EmptyStackFrameProgram contains 1,000 threads with two stack frames, whereas FullStackFrameProgram contains 1,000 threads with 10,000 stack frames.
Conclusion
This study clearly indicates that memory is allocated to threads at the time of creation, and memory is not allocated based on the thread’s runtime demand. Both hyper working threads and almost dormant threads consume the same amount of memory. Modern Java applications tend to create hundreds (sometimes thousands) of threads. But most of those threads are in a WAITING or TIMED_WAITING state and do nothing. Given that threads occupy the maximum amount of allocated memory right when they are created, as an application developer you can do the following to optimize your application’s memory consumption:
- Create only the *necessary* threads for your application.
- Try to come up with optimal stack size (i.e., -Xss) for your application threads. So, if you are configuring a thread’s stack size (i.e., -Xss) to 2 MB, and, in runtime, your application uses only 512 KB, you will be wasting 1.5 MB of memory for each thread in your application. If your application has 500 threads, you will be wasting 750 MB (i.e., 500 threads x 1.5 MB) of memory per JVM instance, which is not cheap in the modern cloud computing era.
You can use tools like yCrash to tell you how many threads are active and how many threads are in a dormant state. It can also tell you how deep each thread’s stack goes. Based on these reports, you can come up with an optimal thread count and a thread’s stack size for your application.
Opinions expressed by DZone contributors are their own.
Comments