jinfo: Command-line Peeking at JVM Runtime Configuration
Join the DZone community and get the full member experience.
Join For FreeIn several recent blogs (in my reviews of the books Java EE 7 Performance Tuning and Optimization and WildFly Performance Tuning in particular), I have referenced my own past blog posts on certain Oracle JDK command-line tools. I was aghast to discover that I had never exclusively addressed the nifty jinfo tool and this post sets to rectify that troubling situation. I suspect that the reasons I chose not to write about jinfo previously include limitations related to jinfo discussed in my post VisualVM: jinfo and So Much More.
In the Java SE 8 version of jinfo running on my machine, the primary limitation of jinfo on Windows that I discussed in the post Acquiring JVM Runtime Information has been addressed. In particular, I noted in that post that the -flags option was not supported on Windows version of jinfo at that time. As the next screen snapshot proves, that is no longer the case (note the use of jps to acquire the Java process ID to instruct jinfoto query).
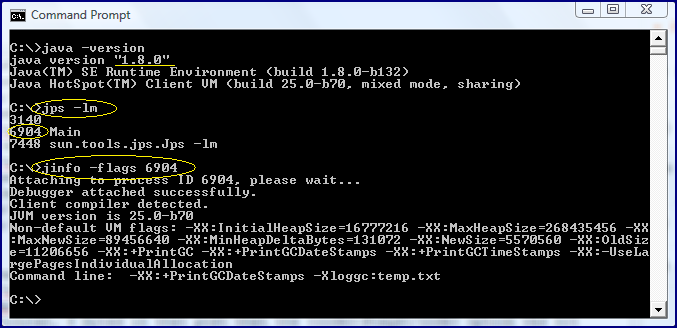
As the above screen snapshot demonstrates, the jinfo -flags command and option show the flags the explicitly specified JVM options of the Java process being monitored.
If I want to find out about other JVM flags that are in effect implicitly (automatically), I can run java -XX:+PrintFlagsFinal to see all default JVM options. I can then query for any one of these against a running JVM process to find out what that particular JVM is using (same default or overridden different value). The next screen snapshot demonstrates how a small portion of the output provided from running java -XX:+PrintFlagsFinal.

Let's suppose I notice a flag called PrintHeapAtGC in the above output and want to know if it's set in my particular Java application (-XX:+PrintHeapAtGC means it's set and -XX:-PrintHeapAtGC means it's not set). I can have jinfo tell me what its setting is (note my choice to use jcmd instead of jps in this case to determine the Java process ID):

Because of the subtraction sign (-) instead of an addition sign (+) after the colon and before "PrintHeapAtGC", we know this is turned off for the Java process with the specified ID. It turns out that jinfo does more than let us look; it also let's us touch. The next screen snapshot shows changing this option using jinfo.
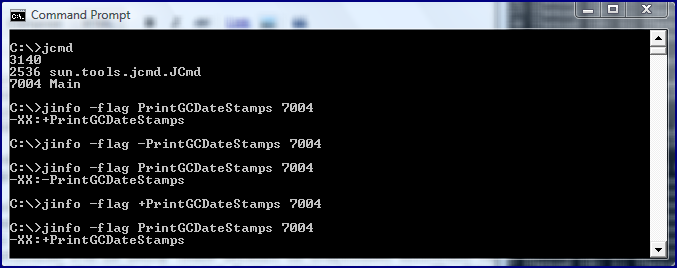
As the previous screen snapshot indicates, I can turn off and on the boolean-style JVM options by simply using the same command to view the flag's setting but preceding the flag's name with the addition sign (+) to turn it on or with the substraction sign (-) to turn it off. In the example just shown, I turned off thePrintGCDateStamps, turned it back on again, and monitored its setting between those changes. Not all JVM options are boolean conditions. In those cases, their new values are assigned to them by concatenating the equals sign (=) and new value after the flag name. It's also important to note that the target JVM (the one you're trying to peek at and touch with jinfo will not allow you to change all its JVM option settings). In such cases, you'll likely see a stack trace with message "Command failed in target VM."
In addition to displaying a currently running JVM's options and allowing the changing of some of these, jinfoalso allows one to see system properties used by that JVM as name/value pairs. This is demonstrated in the next screen snapshot with a small fraction of the output shown.

Perhaps the easiest way to run jinfo is to simply provide no arguments other than the PID of the Java process in question and have both JVM options (non-default and command-line) and system properties displayed. Running jinfo -help provides brief usage details. Other important details are found in the Oracle documentation on the jinfo tool. These details includes the common (when it comes to these tools) reminder that this tool is "experimental and unsupported" and "might not be available in future releases of the JDK." We are also warned that jinfo on Windows requires availability of dbgeng.dll or installed Debugging Tools For Windows.
Although I have referenced the handy jinfo command line tool previously in posts VisualVM: jinfo and So Much More and Acquiring JVM Runtime Information, it is a handy enough tool to justify a post of its very own. As a command-line tool, it enjoys benefits commonly associated with command-line tools such as being relatively lightweight, working well with scripts, and working in headless environments.
Published at DZone with permission of Dustin Marx. See the original article here.
Opinions expressed by DZone contributors are their own.
Comments