JMeter Real-Time Monitoring, Integration With Grafana+InfluxDB 2.0 (Flux)
A developer discusses the newest additions to JMeter, InfluxDB 2.0 and the Flux language, and he used them with Grafana in an open source testing project.
Join the DZone community and get the full member experience.
Join For FreeWe know that JMeter is one of the most popular and best tools to load and test functional behavior and measure performance. I love JMeter so much and a lot of real projects have been created using this tool. JMeter gives capabilities, like: building different load patterns through plugins, offline HTML reporting, scaling (master and slave nodes), access to a big community, and custom plugins. But we have no real-time monitoring out-of-the-box. This is not a problem; we can build a solution using an integration with Grafana + InfluxDB. This solution provides great capabilities and saves time.
Why do we need real-time monitoring?
- It helps to react immediately.
- Illustrates the system health under test.
- Measure performance and metrics.
- Improves error analysis and reduces the time to perform a root cause investigation.
The Architecture
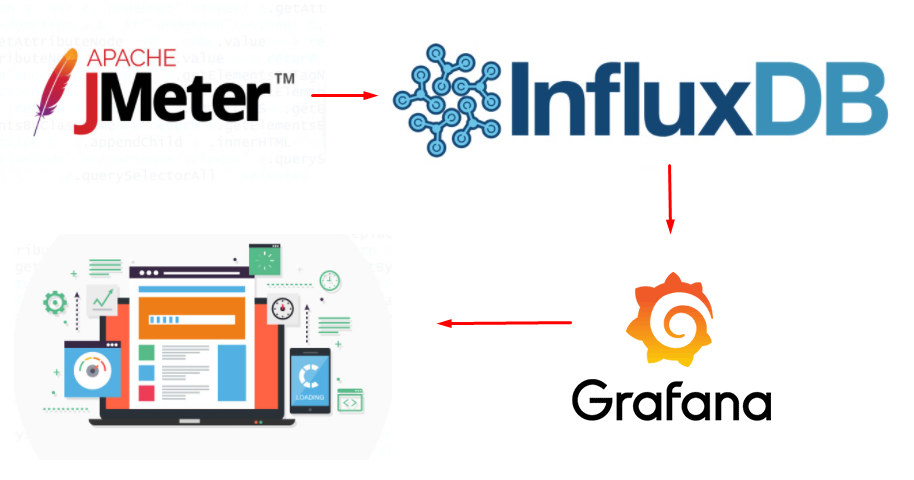
The solution is very simple:
- JMeter sends the metrics to the time series database through a custom plugin.
- Grafana reads the stored data.
- All-important metrics are available in the browser.
We now have an InfluxDB v2.0 release with a new language, Flux (previously InfluxDB 1.8 or less was commonly used). The new release brings a lot of opportunities from a technology stack perspective and security point of view. The newest hardware and infrastructure monitoring system uses the latest release.
So, I decided to support the JMeter plugin and to use the latest JMeter technologies, InfluxDB v2.0 and Flux, in my open source testing project. I am happy to share that the new JMeter plugin and Dashboard have been released:
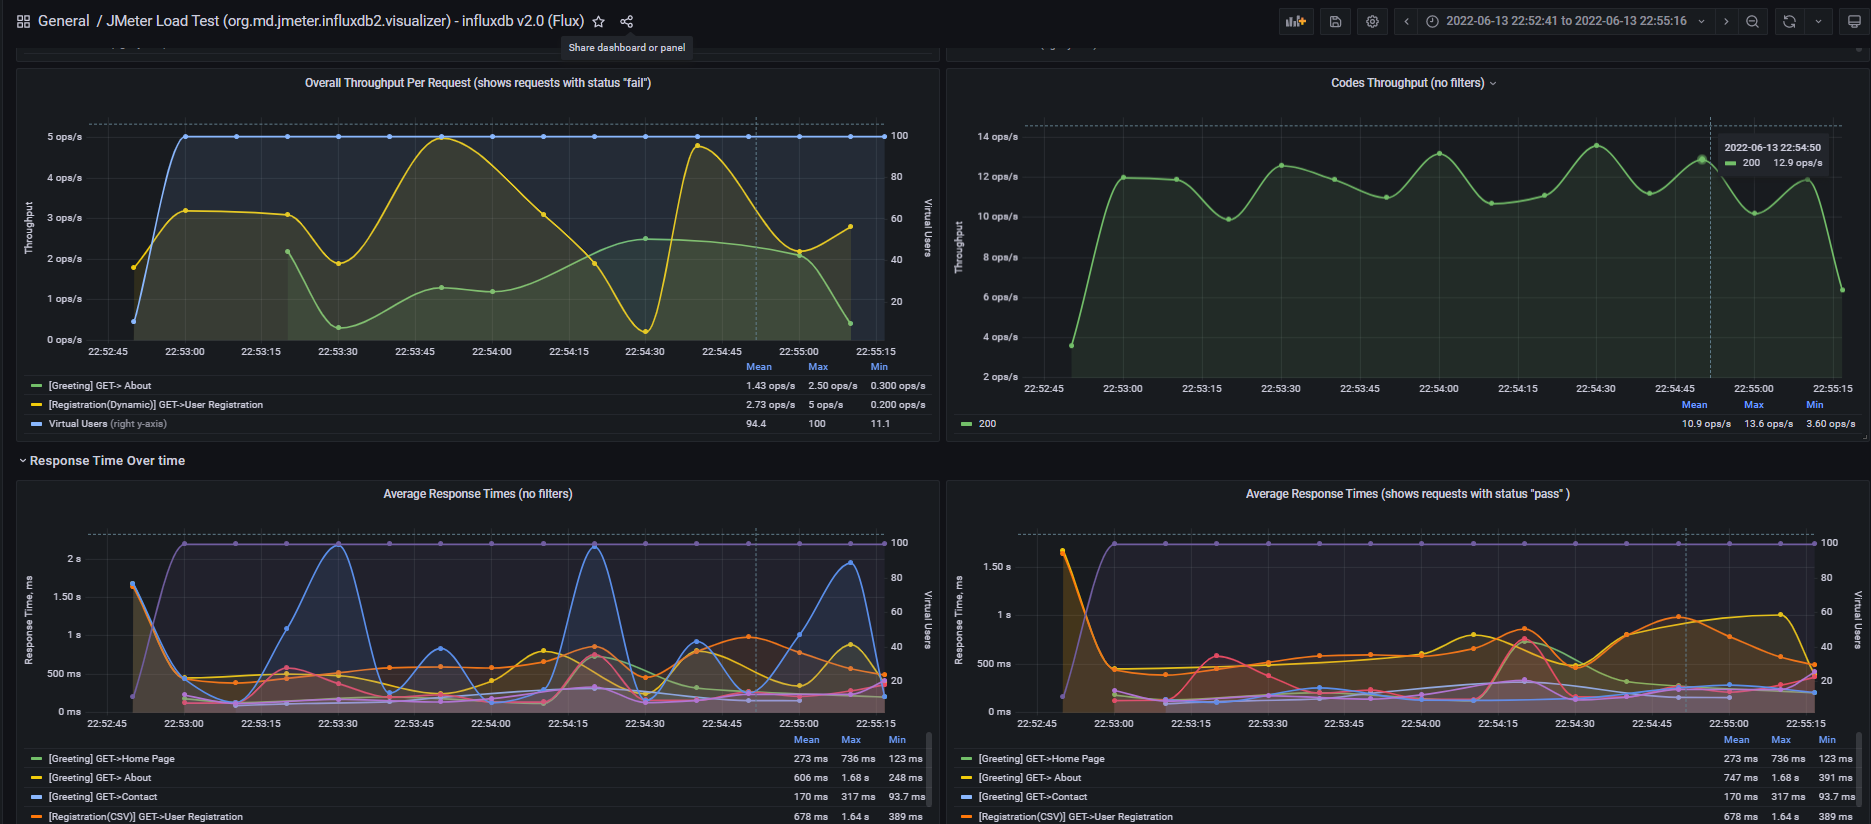
The plugin supports the InfluxDB v2.0. The dashboard was built using the Flux language, which generates amazing charts:
Monitor Throughput With Active Users

Overview and Analysis of the Response Time
With distribution as well.
Aggregate Report
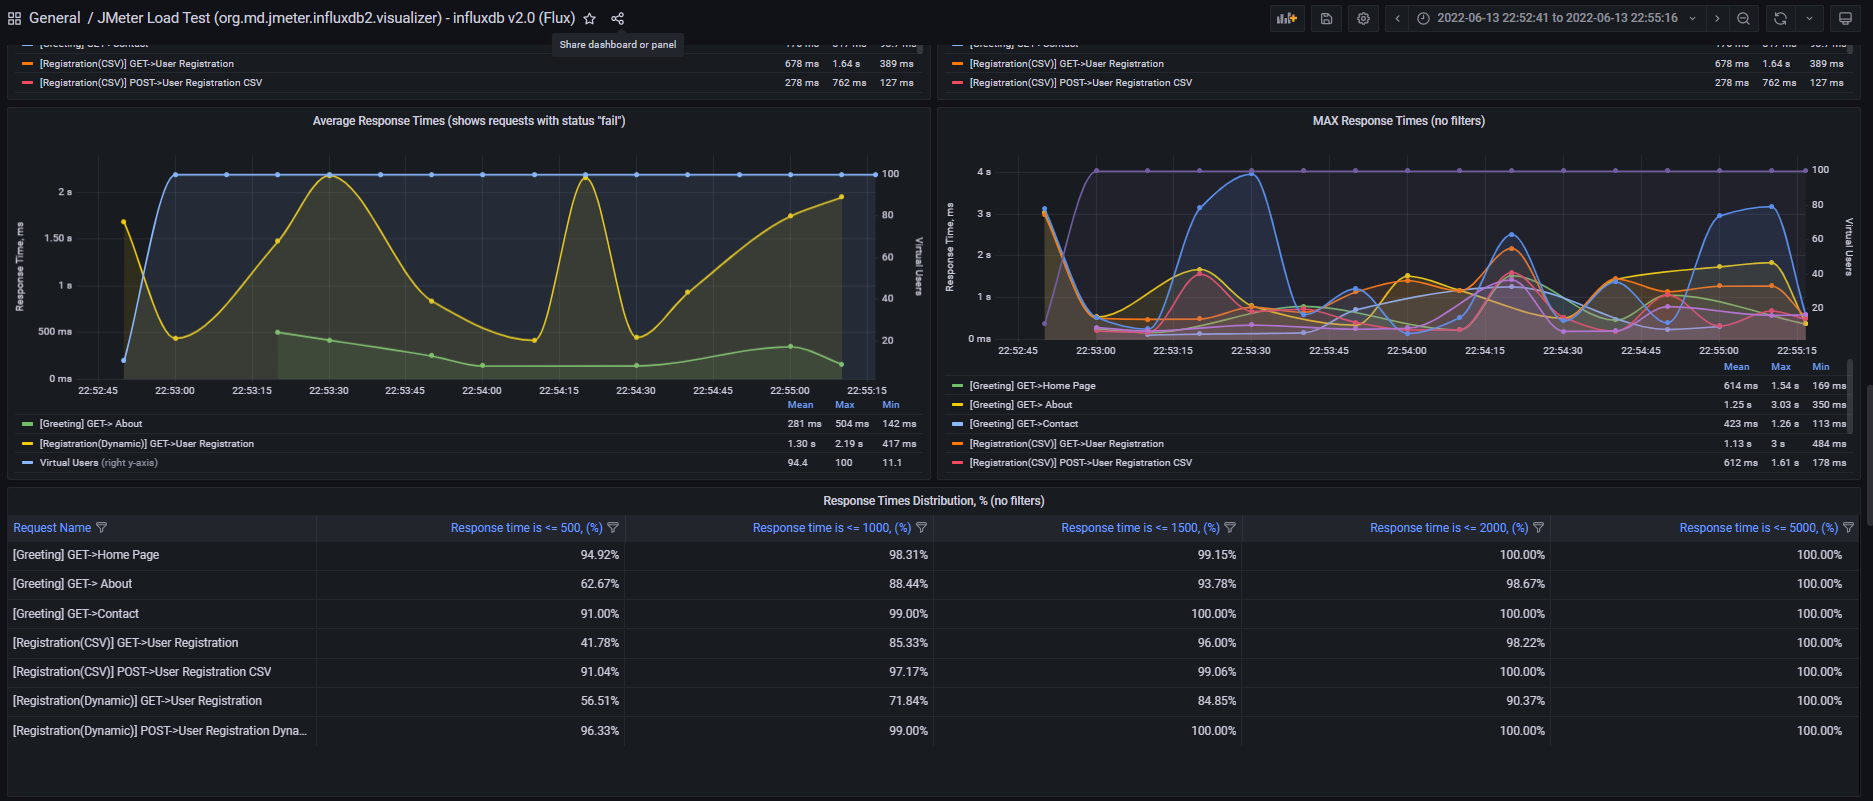
Investigate Errors
The table is interactive, so it's possible to filter data in the columns and see details for the specific error.


Check Individual Request Details![]()

You can significantly improve your performance testing process. Happy testing, enjoy!
Best Regards,
Michael Derevyanko
Opinions expressed by DZone contributors are their own.
Comments