The Pod Prometheus Never Saw: Kubernetes' Sampling Blind Spot
Prometheus sampling gaps are irreducible — reducing the scrape interval just moves the threshold. The Kubernetes watch API eliminates it entirely.
Join the DZone community and get the full member experience.
Join For FreeThe Fix That Doesn't Fix It
Reducing your Prometheus scrape interval from 15 seconds to 5 seconds does not fix the sampling blind spot. It moves it. Any pod whose entire lifetime falls within one 5-second scrape gap is still structurally invisible — not because of misconfiguration, not because of missing rules, but because poll-based collection has an irreducible sampling gap that no interval setting eliminates.
This article explains exactly why that is, what it costs in production, and what actually fixes it.
What Is the H5 Evidence Horizon?
Kubernetes evidence horizons are deterministic points after which specific diagnostic context becomes permanently unrecoverable. H5 — the scrape-interval sampling blind spot — is the only horizon that prevents observability data from being created in the first place. Unlike H1 (LastTerminationState rotation at ~90 seconds) or H2 (scheduler event pruning at 1 hour), H5 has no timer and no API call. It fires silently for every pod whose entire lifetime falls within one Prometheus scrape gap. The full evidence horizon taxonomy is documented at opscart.com/kubernetes-evidence-horizons-h2-h3-h4-h5/.
Why Poll-Based Observability Has an Irreducible Blind Spot
Prometheus collects metrics by sending HTTP requests to targets at a fixed interval. The default scrape interval in kube-prometheus-stack is 15 seconds. Every 15 seconds, Prometheus asks the world: "What is your current state?"
This model works exceptionally well for persistent, long-running workloads. A deployment that has been running for hours will be scraped hundreds of times. Its CPU trends, memory patterns, and request rates are captured with high fidelity.
It fails completely for ephemeral workloads — and Kubernetes generates ephemeral workloads by design.
The math is straightforward. Given a scrape interval S and a pod lifetime L:
- If L > S: the pod will be scraped at least once, generating at least one data point
- If L < S: the pod may generate zero data points — not because of any failure in Prometheus, but because it never existed between two consecutive scrape cycles
This is not a probability statement. It is deterministic. A pod with a 6-second lifetime and a 15-second scrape interval will generate exactly zero Prometheus data points if its entire lifetime falls within one scrape gap. There is no configuration change that fixes this for that specific pod in that specific gap.
The only way to eliminate the blind spot entirely is to move from a poll-based model to an event-driven model. And this is precisely the architectural distinction that most observability discussions miss.
The Ghost Pod Experiment
To validate this claim empirically, I ran a controlled experiment on a 3-node Minikube cluster (Kubernetes 1.31, Apple M-series hardware).
Setup:
- Pod memory limit: 64Mi
- Pod memory allocation: 128Mi (guaranteed OOMKill)
- Prometheus scrape interval: 15s (kube-prometheus-stack default)
- Pod name: ghost-pod, namespace: oma-sampling
What happened:
The pod started, allocated memory beyond its limit, and was OOMKilled by the kernel at T+5s. Total observed pod lifetime: 6 seconds.
Prometheus result:
# Query executed the morning after the experiment
$ promql: container_cpu_usage_seconds_total{pod="ghost-pod"}
{}    # empty — 0 data points

$ promql: kube_pod_container_status_last_terminated_reason{pod="ghost-pod"}
{}    # empty — 0 data points

$ kubectl get pod ghost-pod -n oma-sampling
Error from server (NotFound): pods "ghost-pod" not found
Zero data points. No alert. No record. From Prometheus's perspective, ghost-pod never existed.
Event-driven result:
An OMA (Operational Memory Architecture) collector subscribed to the Kubernetes watch API captured the following at the moment of occurrence:
OOMKill P001 captured at T+5s
  pod:          ghost-pod
  namespace:    oma-sampling
  exit_code:    137
  memory_limit: 64Mi
  node:         opscart-m03
  timestamp:    2026-04-18T23:38:06Z
The causal evidence — exit code, resource limits, node placement — captured at occurrence. No scrape gap. No sampling window. The watch API delivers every pod state transition at the moment it fires, regardless of timing.
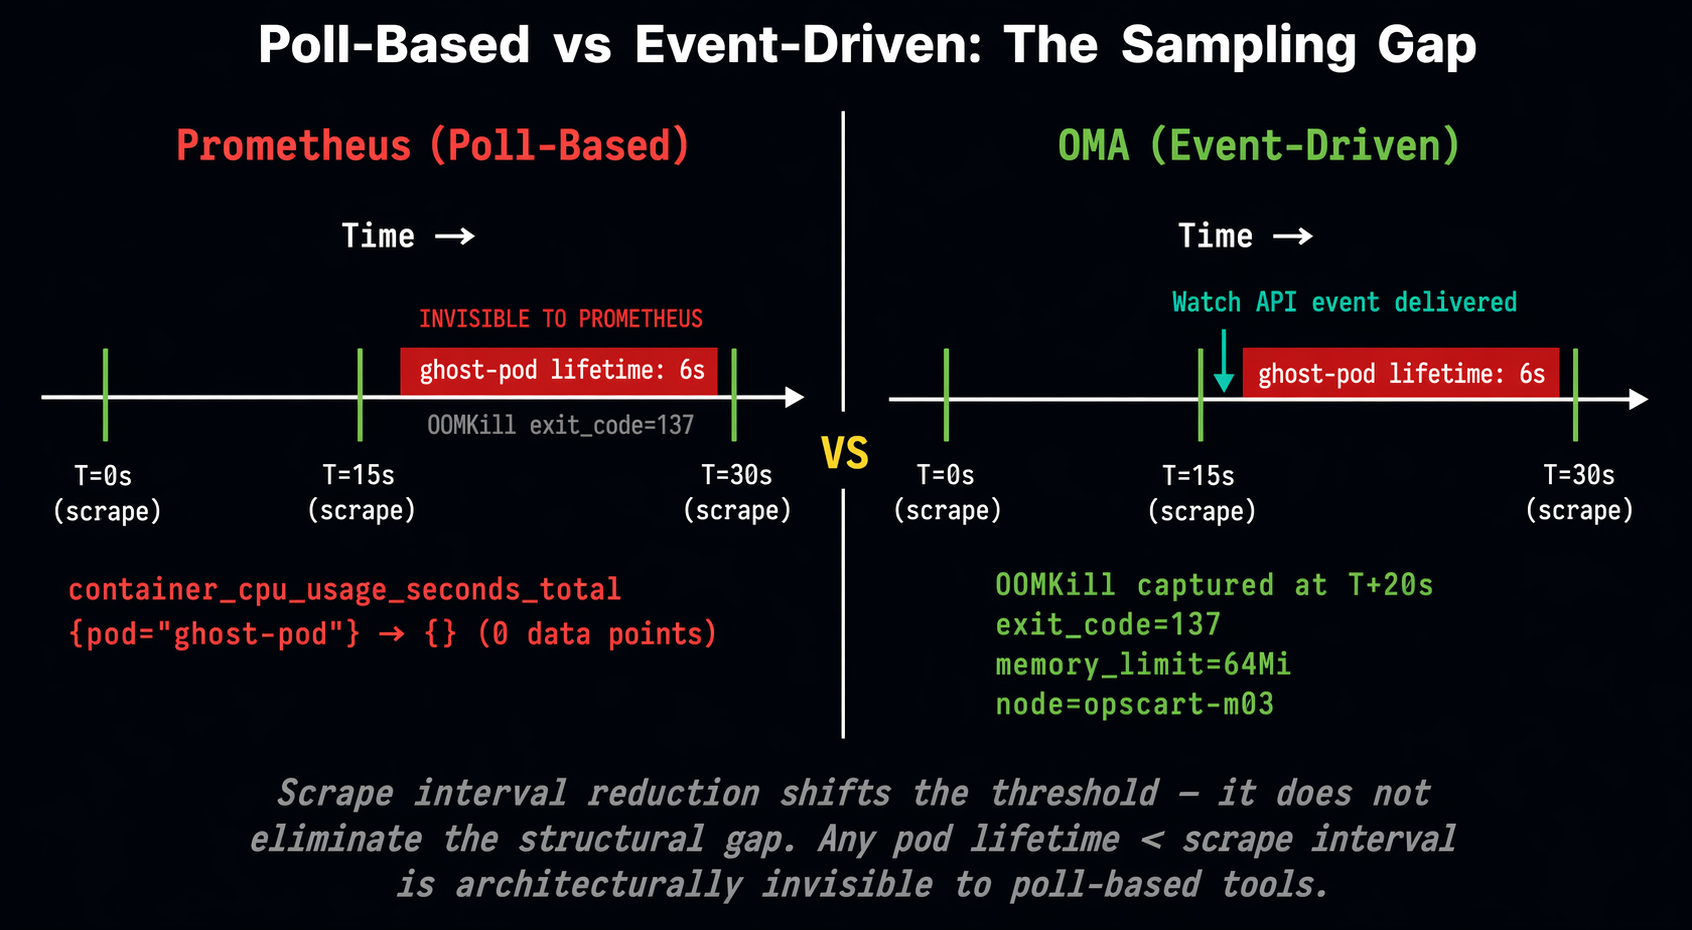
Poll-based vs event-driven architecture: a pod with a 6-second lifetime falls entirely within one 15-second Prometheus scrape gap, generating zero data points. An event-driven collector subscribed to the Kubernetes watch API captures the OOMKill at occurrence — no sampling gap exists by architecture.
"Just Reduce the Scrape Interval"
This is the most common response when engineers first encounter the H5 blind spot. It deserves a direct answer.
Reducing the scrape interval from 15s to 5s does not eliminate the blind spot. It shifts the threshold from 15 seconds to 5 seconds. Any pod whose lifetime falls within one 5-second scrape gap is still structurally invisible.
Consider the real-world distributions:
CrashLoopBackOff with OOMKill on startup: A pod that allocates memory before its first checkpoint can OOMKill in under 1 second. No scrape interval short of continuous polling catches this.
Init container failures: Init containers that fail immediately may have lifetimes measured in milliseconds. These are architecturally invisible to any poll-based system, regardless of scrape interval.
Batch job bursts: Short-lived Job pods in a batch processing cluster can complete their entire lifecycle — start, run, succeed, or fail — within a single scrape gap at any reasonable interval.
Reducing the scrape interval also has real costs:
- Storage: Prometheus metric storage grows proportionally with scrape frequency. Moving from 15s to 5s triples your time-series storage requirements.
- Cardinality: More frequent scrapes of high-cardinality metrics (per-pod, per-container) increase label cardinality and query latency.
- Target load: Every scrape is an HTTP request to your metrics endpoints. High scrape frequencies create measurable load on instrumented services.
You are paying a real cost to shift the threshold — not to eliminate it. For workloads with sub-second or sub-5-second lifetimes, no scrape interval is fast enough.
Why the Watch API Is Structurally Different
The Kubernetes watch API is not a faster poll. It is a fundamentally different delivery mechanism.
When you run kubectl get pods --watch, you are not asking Kubernetes "what is the current pod state every N seconds." You are opening a long-lived HTTP connection to the API server and subscribing to a stream of state change events. Every time a pod transitions — from Pending to Running, from Running to Terminated, from any state to OOMKilled — the API server pushes that transition to every active watcher.
The delivery is at-occurrence. There is no polling interval. There is no sampling gap. If a pod OOMKills at T=17.3 seconds, the watch API delivers that event at T=17.3 seconds — not at the next scrape boundary.
This means the H5 blind spot does not exist for event-driven collectors by architecture. A pod with a 6-second lifetime generates exactly one OOMKill transition event. That event is delivered to every watcher at the moment it fires. The watcher captures it. Done.
The practical implication: event-driven collection provides complete coverage of pod lifecycle events regardless of pod lifetime, without any configuration tuning.
What Sampling Blind-Spot Costs in Production
The blind spot has three concrete operational consequences.
Undetected crash loops. A pod in CrashLoopBackOff with a very short failure cycle can OOMKill dozens of times per hour without generating a single Prometheus alert. The restart counter increments in kubectl get pods output, but if nobody is looking at that specific pod, the pattern goes undetected. By the time an engineer investigates, the pod may have crashed hundreds of times with no metric record of any individual failure.
Incomplete capacity planning. Short-lived batch pods that OOMKill during processing spikes are invisible to Prometheus-based capacity analysis. Your memory utilization reports show only long-running pods. The actual peak memory demand — which caused the batch pod OOMKills — never appears in your capacity data.
Silent compliance gaps. In pharmaceutical and financial production environments with audit requirements, unrecorded container failures are a compliance problem. An auditor asking "what failed in this namespace between 2 AM and 4 AM on this date" deserves a complete answer. A Prometheus query that returns empty results for pods that actually OOMKilled is not a complete answer.
The Structural Fix
The H5 blind spot cannot be patched within a poll-based architecture. The fix is additive: complement Prometheus with an event-driven collector that subscribes to the Kubernetes watch API.
This does not mean replacing Prometheus. Prometheus remains the right tool for what it does — metric aggregation, trend analysis, alerting on long-running workloads. The event-driven collector handles what Prometheus cannot: discrete lifecycle events for pods of any duration.
The implementation I've validated uses a Go-based collector subscribing to CoreV1().Pods(namespace).Watch(). On each Modified event, the collector inspects ContainerStatus for OOMKill signals and captures the full forensic context synchronously — before the pod restarts and overwrites LastTerminationState.
// Simplified watch loop
watcher, _ := clientset.CoreV1().Pods(namespace).Watch(
    ctx, metav1.ListOptions{})

for event := range watcher.ResultChan() {
    pod := event.Object.(*corev1.Pod)
    for _, cs := range pod.Status.ContainerStatuses {
        if cs.LastTerminationState.Terminated != nil {
            reason := cs.LastTerminationState.Terminated.Reason
            if reason == "OOMKilled" {
                captureOOMKillEvidence(pod, cs)
            }
        }
    }
The watch API delivers the event at occurrence. The capture is synchronous. No polling gap. No sampling threshold. Ghost pods are no longer invisible.
Full implementation with reproducible Minikube scenarios is at github.com/opscart/k8s-causal-memory.
H5 in Context: The Evidence Horizon Taxonomy
H5 is one of five evidence destruction mechanisms I've identified and formalized as an evidence horizon taxonomy. The full taxonomy:
| Horizon | Trigger | What's lost |
|---|---|---|
| H1 | Pod restart (~90s) | OOMKill forensics, limits, ConfigMaps |
| H2 | Event TTL (1hr/1000) | Scheduler placement rationale |
| H3 | Debug session exit | kubectl debug exit code, duration |
| H4 | Kubelet restart | In-memory operational state |
| H5 | Scrape interval | Sub-interval pod lifetimes |
H5 is unique in the taxonomy: H1 through H4 destroy the Kubernetes API state that previously existed. The scrape-interval blind spot prevents observability data from being created in the first place. It is the only horizon that requires no destruction event — the evidence simply never reaches any persistent store.
The full taxonomy with empirical validation across Minikube and AKS 1.32.10 is documented in the canonical OpsCart article: Beyond the 90-Second Gap and in the research preprint at Zenodo DOI: 10.5281/zenodo.19685352.
Conclusion
The H5 blind spot is not a Prometheus bug. It is not a configuration problem. It is an irreducible consequence of poll-based collection applied to a platform that generates arbitrarily short-lived workloads.
Kubernetes is designed to self-heal faster than humans can observe. A pod that OOMKills in 6 seconds and restarts in 2 is working exactly as designed. Prometheus, also working exactly as designed, sees nothing.
The architectural answer is equally straightforward: subscribe to the Kubernetes watch API. Receive events at occurrence. No scrape interval. No sampling gap. No ghost pods.
Every pod that crashes in your cluster deserves a record. The watch API ensures it gets one.
Resources:
- github.com/opscart/k8s-causal-memory — open-source implementation with reproducible H5 scenario
- Beyond the 90-Second Gap — full evidence horizon taxonomy (OpsCart canonical)
- Research preprint — 30-run statistical analysis, AKS 1.32.10 validation
Published at DZone with permission of Shamsher Khan. See the original article here.
Opinions expressed by DZone contributors are their own.
Comments