Understanding Prometheus Metric Types: A Guide for Beginners
A beginner-friendly guide to Prometheus metric types, like counters, gauges, histograms, and summaries, with practical examples and common mistakes to avoid.
Join the DZone community and get the full member experience.
Join For FreePrometheus is a tool that helps you track how your systems are working. Think of it as a tool that collects numbers about your applications and servers. This guide will help you understand the different types of metrics and how to use them.
The Four Basic Types of Prometheus Metrics
1. Counters - Numbers That Only Go Up
A counter is a number that only goes up or resets to zero on restart, just like a car's odometer that keeps adding miles. It's perfect for tracking things that only increase, like total API requests, error counts, or tasks completed. When a counter resets to zero (like during a system restart), Prometheus can detect this reset and handle calculations correctly. Counters are the simplest metric type and should be used whenever you're counting the total occurrences of something.

# Example of a counter
http_requests_total{method="POST", endpoint="/api/users"} 2387
What to Know
- Only increases or resets to zero
- Used for counting total events
- Common uses: counting requests, errors, completed tasks
Basic Rules
- Always add
_totalto counter names - Use only for numbers that increase
- Never use for numbers that need to go down
Real Examples
# Wrong way: Using a counter for current users
active_users 23
# Why it's wrong: Current users can go up OR down, but counters can only go up

# Right way: Using a counter for total logins
user_logins_total{status="success"} 10483
# Why it's right: Total logins only increase, perfect for a counter
2. Gauges - Numbers That Go Up and Down
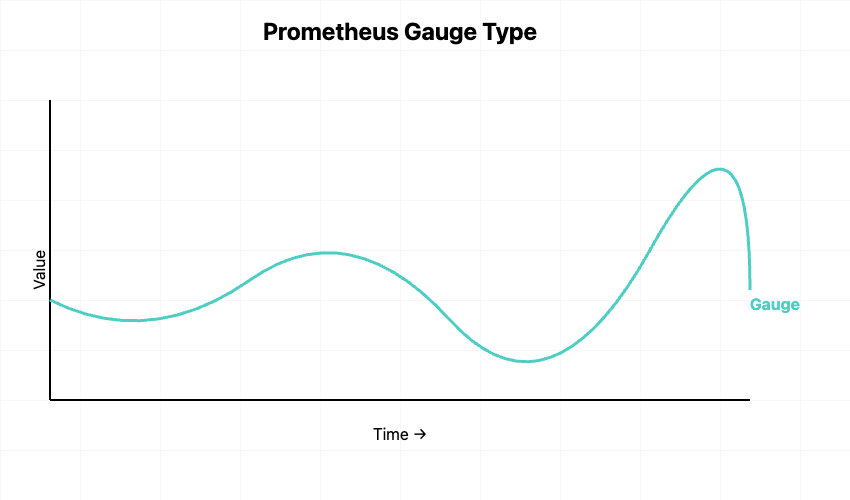
A gauge is a number that can go both up and down, like a thermometer or fuel gauge in your car. It represents a current value at any point in time, such as memory usage, active requests, or CPU temperature. You can think of a gauge as taking a snapshot of something that changes frequently. Unlike counters, gauges are perfect for metrics that can increase or decrease based on system behavior.
# Example of a gauge
node_memory_usage_bytes{instance="server-01"} 1234456789
What to Know
- Can increase or decrease
- Shows current value at any time
- Good for measuring current state
Basic Rules
- Use for values that change up and down
- Good for usage and saturation metrics
- Don't use for counting total events
Real Examples
# Right way: Tracking CPU temperature
cpu_temperature_celsius{core="0"} 54.5
# Why it's right: Temperature naturally goes up and down

# Right way: Current database connections
db_connections_current{database="users"} 47
# Why it's right: Active connections change both up and down
3. Histograms - Tracking Value Ranges
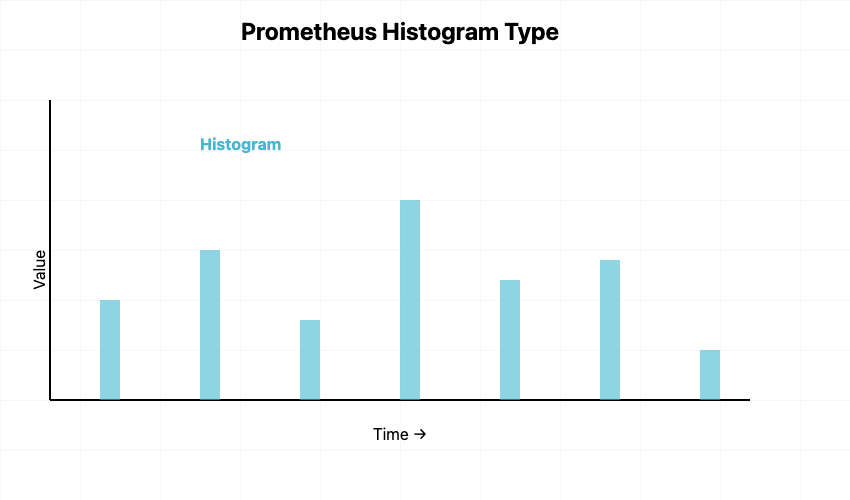
A histogram groups measurements into ranges (called buckets), like sorting test scores into A, B, C, D, and F grades. It automatically tracks how many values fall into each range, plus keeps a count of all values and their sum. Histograms are especially useful for measuring things like request duration or response size, where you want to understand the distribution of values. The key feature of histograms is that they let you calculate percentiles later using the histogram_quantile function.
# Example of a histogram
http_request_duration_seconds_bucket{le="0.1"} 24054  # Requests faster than 0.1s
http_request_duration_seconds_bucket{le="0.5"} 33444  # Requests faster than 0.5s
http_request_duration_seconds_bucket{le="1.0"} 34001  # Requests faster than 1.0s
What to Know
- Groups values into ranges (buckets)
- Creates count and sum automatically
- Helps calculate percentiles
Basic Rules
- Pick ranges that make sense for your data
- Good for response times and sizes
- Don't create too many ranges (it uses more memory)
Real Examples
# Wrong way: Too many buckets
api_response_time_bucket{le="0.1"} 100
api_response_time_bucket{le="0.2"} 150
api_response_time_bucket{le="0.3"} 180
# Why it's wrong: Too many small buckets use extra memory and don't add value

# Right way: Meaningful bucket sizes
api_response_time_bucket{le="0.5"} 1000   # Half second
api_response_time_bucket{le="1.0"} 1500   # One second
api_response_time_bucket{le="2.0"} 1700   # Two seconds
# Why it's right: Buckets match meaningful response time targets
4. Summaries - Calculating Percentiles
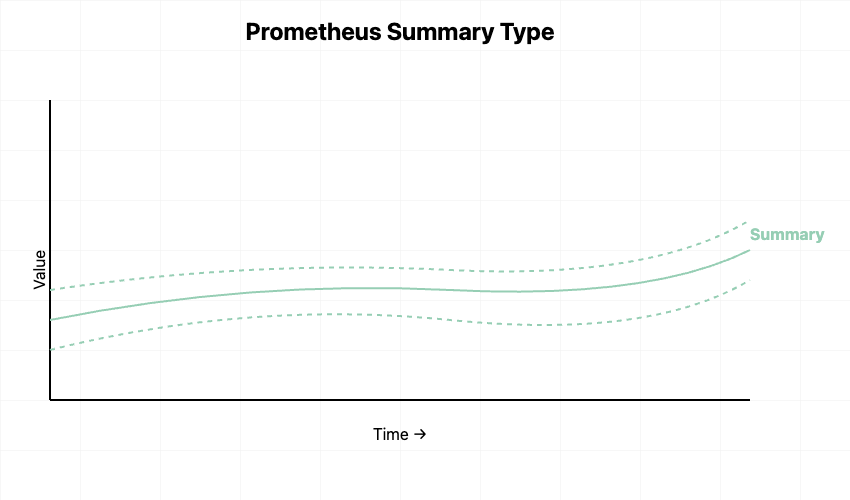
A summary is similar to a histogram but calculates percentiles directly when collecting the data, like having a calculator that immediately tells you your test score's ranking in the class. It tracks the total count and sum like a histogram, but instead of buckets, it stores exact percentile values (like 50th, 90th, 99th percentile). Summaries are more resource-intensive than histograms because they calculate percentiles on the fly, but they provide more accurate percentile calculations. Use summaries when you need exact percentiles and can't calculate them later.
# Example of a summary
http_request_duration_seconds{quantile="0.5"} 0.05   # 50% of requests
http_request_duration_seconds{quantile="0.9"} 0.1    # 90% of requests
http_request_duration_seconds_count 34010            # Total count
What to Know
- Calculates exact percentiles
- Includes total count and sum
- Uses more computer resources than histograms
Basic Rules
- Use when you need exact percentiles
- Consider histograms for most cases
- Be careful with labels (they use memory)
Common Mistakes to Avoid
1. Counter vs. Gauge Confusion
# Wrong way: Using counter for temperature
temperature_total{location="room"} 25
# Why wrong: Temperature goes up and down, counters can't go down

# Right way: Using gauge for temperature
temperature{location="room"} 25
# Why right: Gauges can show current temperature properly
2. Too Many Labels
# Wrong way: Too much detail
http_requests_total{user_id="12345", path="/api/users", method="GET", status="200", browser="chrome"}
# Why wrong: Creates too many combinations, uses lots of memory

# Right way: Important details only
http_requests_total{path="/api/users", method="GET", status="200"}
# Why right: Keeps useful information without too many combinations
Simple Recipes for Common Tasks
Calculating Rates
# Request rate per second over 5 minutes
rate(http_requests_total[5m])

# Error rate percentage
(rate(http_errors_total[5m]) / rate(http_requests_total[5m])) * 100
Tracking Resource Usage
# Average memory usage by application
avg(process_memory_bytes) by (app_name)

# Maximum CPU usage in the last hour
max(cpu_usage_percent[1h])
Key Points to Remember
1. Use Counter when:
- Counting total events
- Tracking errors
- Measuring completed tasks
2. Use Gauges when:
- Measuring current values
- Tracking things that go up and down
- Showing resource usage
3. Use Histograms when:
- Measuring response times
- Looking at value ranges
- Need approximate percentiles
4. Use Summaries when:
- Need exact percentiles
- Willing to use more computer resources
- Can't calculate percentiles later
Start with counters and gauges for basic monitoring. Add histograms and summaries when you need to track response times or understand how your values are spread out. Remember, good monitoring starts with choosing the right type of metric for what you want to measure.
Opinions expressed by DZone contributors are their own.
Comments