Essential Monitoring Tools, Troubleshooting Techniques, and Best Practices for Atlassian Tools Administrators
This article explores leveraging various monitoring tools to identify, diagnose, and resolve issues in these essential development and collaboration platforms.
Join the DZone community and get the full member experience.
Join For FreeEffective monitoring and troubleshooting are critical for maintaining the performance and reliability of Atlassian products like Jira and Confluence and software configuration management (SCM) tools like Bitbucket. This article explores leveraging various monitoring tools to identify, diagnose, and resolve issues in these essential development and collaboration platforms.
Before we discuss the monitoring tools, let's clarify the importance of monitoring.
Monitoring Atlassian tools is crucial for several reasons:
- Proactive issue detection
- Performance optimization
- Capacity planning
- Security and compliance
- Minimizing downtime
By implementing robust monitoring practices, IT teams can ensure smooth operations, enhance user experience, and maximize the value of Atlassian investments.
Essential Monitoring Tools
1. Atlassian's Built-in Monitoring Tools
Atlassian provides several built-in tools for monitoring and troubleshooting:
Troubleshooting and Support Tools
This app, included by default in Atlassian products, offers features like log analysis, health checks, and support zip creation. It helps identify common issues and provides links to relevant knowledge-based articles.
![Troubleshooting and support tools]()
Instance Health Check
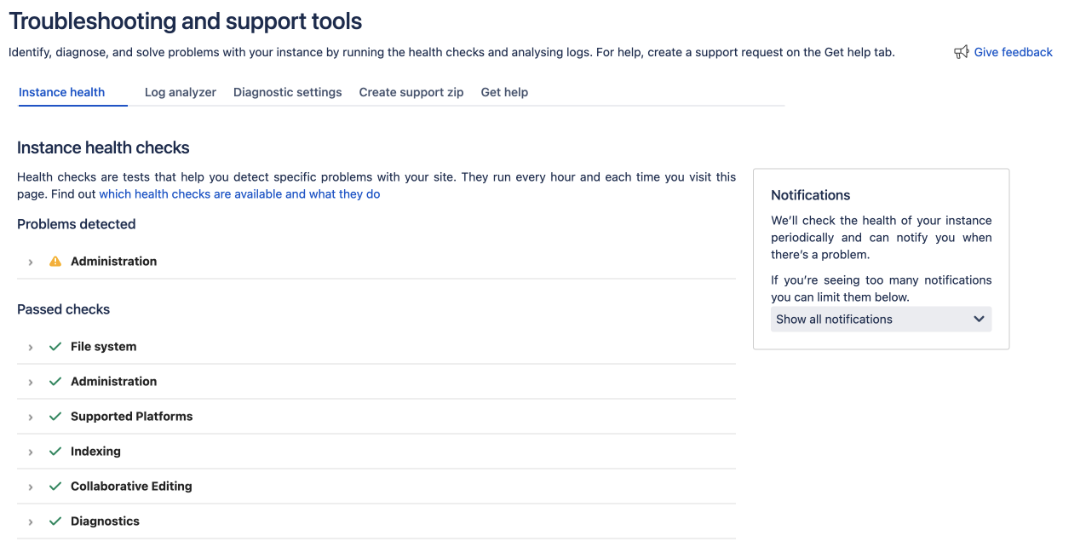
This feature, available in the administration console, scans for potential problems and offers recommendations for resolving them.
Application Metrics
Atlassian products expose various performance metrics via JMX (Java Management Extensions). External monitoring tools can be utilized to gather and examine these metrics.
2. Log Analysis
Log files contain a resource of information for troubleshooting. Critical log files to monitor include:
- Application logs (e.g., atlassian-jira.log, atlassian-confluence.log)
- Tomcat logs (catalina.out)
- Database logs
Log aggregation tools like ELK Stack (Elasticsearch, Logstash, Kibana) or Splunk can centralize, search, and analyze log data from multiple sources.
3. Prometheus and Grafana
Prometheus and Grafana are popular open-source tools for monitoring and visualization:
- Prometheus: Collects and stores time-series data from configured targets
- Grafana: Creates dashboards and visualizations based on the collected metrics
Atlassian provides documentation on setting up Prometheus and Grafana to monitor Jira and Confluence. This combination allows for:
- Real-time performance monitoring
- Custom dashboards for different stakeholders
- Alerting based on predefined thresholds
4. Application Performance Monitoring (APM) Tools
APM solutions offer comprehensive visibility into how applications are functioning and how users are experiencing them. Popular options include:
- Dynatrace
- AppDynamics
- New Relic
These tools can help identify bottlenecks, trace transactions, and determine the root cause for performance issues across the application stack.
5. Infrastructure Monitoring
Monitoring the underlying infrastructure is crucial for maintaining optimal performance. Key areas to monitor include:
- CPU, memory, and disk usage
- Network performance
- Database performance
Monitoring tools like Nagios, Zabbix, or cloud-native solutions (e.g., AWS CloudWatch) can monitor infrastructure components.
6. Synthetic Monitoring and User Experience
Synthetic monitoring involves simulating user interactions to identify issues proactively. Synthetic monitoring tools like Selenium or Atlassian's own Statuspage can be used to:
- Monitor critical user journeys
- Check availability from different geographic locations
- Measure response times for crucial operations
The section below will examine some of the frequent issues with Atlassian tools and troubleshooting techniques for these common issues.
Troubleshooting Techniques
1. Performance Degradation
When facing performance issues:
- Check system resources (CPU, memory, disk I/O) for bottlenecks.
- Analyze application logs for errors or warnings.
- Review recent configuration changes.
- Examine database performance metrics.
- Use APM tools to identify slow transactions or API calls.
2. Out of Memory Errors
For out-of-memory errors:
- Analyze garbage collection logs.
- Review memory usage trends in monitoring tools.
- Check for memory leaks using profiling tools.
- Adjust JVM memory settings if necessary.
3. Database-Related Issues
When troubleshooting database problems:
- Monitor database connection pool metrics.
- Analyze slow query logs.
- Check for database locks or deadlocks.
- Review database configuration settings.
4. Integration and Plugin Issues
For issues related to integrations or plugins:
- Check plugin logs for errors.
- Review recent plugin updates or configuration changes.
- Disable suspect plugins to isolate the issue.
- Monitor plugin-specific metrics if available.
In the section below, let's look at some of the best practices for effective monitoring.
Best Practices for Effective Monitoring
- Establish baselines: Create performance baselines during normal operations to quickly identify deviations.
- Set up alerts: Configure alerts for critical metrics to enable rapid response to issues.
- Use dashboards: Create custom dashboards for different teams (e.g., operations, development, management) to provide relevant insights.
- Regular health checks: Perform periodic health checks using Atlassian's built-in tools and third-party monitoring solutions.
- Monitor trends: Look for long-term performance metrics trends to address potential issues proactively.
- Correlate data: Use tools like PerfStack to correlate configuration changes with performance metrics.
- Continuous improvement: Review and refine your monitoring strategy based on lessons learned from past incidents.
Conclusion
Effective monitoring and troubleshooting of Atlassian tools necessitate a blend of built-in features, third-party tools, and best practices. Organizations can ensure optimal performance, minimize downtime, and provide the best possible user experience by implementing a comprehensive monitoring strategy. Remember that monitoring is an ongoing process. As your Atlassian environments evolve, so should your monitoring and troubleshooting approaches. Keep yourself updated on new tools and techniques, and be ready to adapt your strategy as necessary to align with your organization's evolving needs.
Opinions expressed by DZone contributors are their own.
Comments