Kibana Hacks: 5 Tips and Tricks
In this article, we look at a list of workarounds I found useful for tackling specific pain points or missing features in Kibana.
Join the DZone community and get the full member experience.
Join For FreeKibana is a great visualization tool. It gives users almost complete freedom to slice and dice the data indexed in Elasticsearch in any way or fashion they like.
As with any software, though, some tasks are not as simple as we'd like them to be. Sometimes this is due to lack of experience or knowledge and sometimes this is due to missing functionality.
Below is a list of workarounds I found useful for tackling specific pain points or missing features in Kibana. If you're just getting acquainted with Kibana, I suggest you first refer to our Getting Started with Kibana piece before you start to use these workarounds.
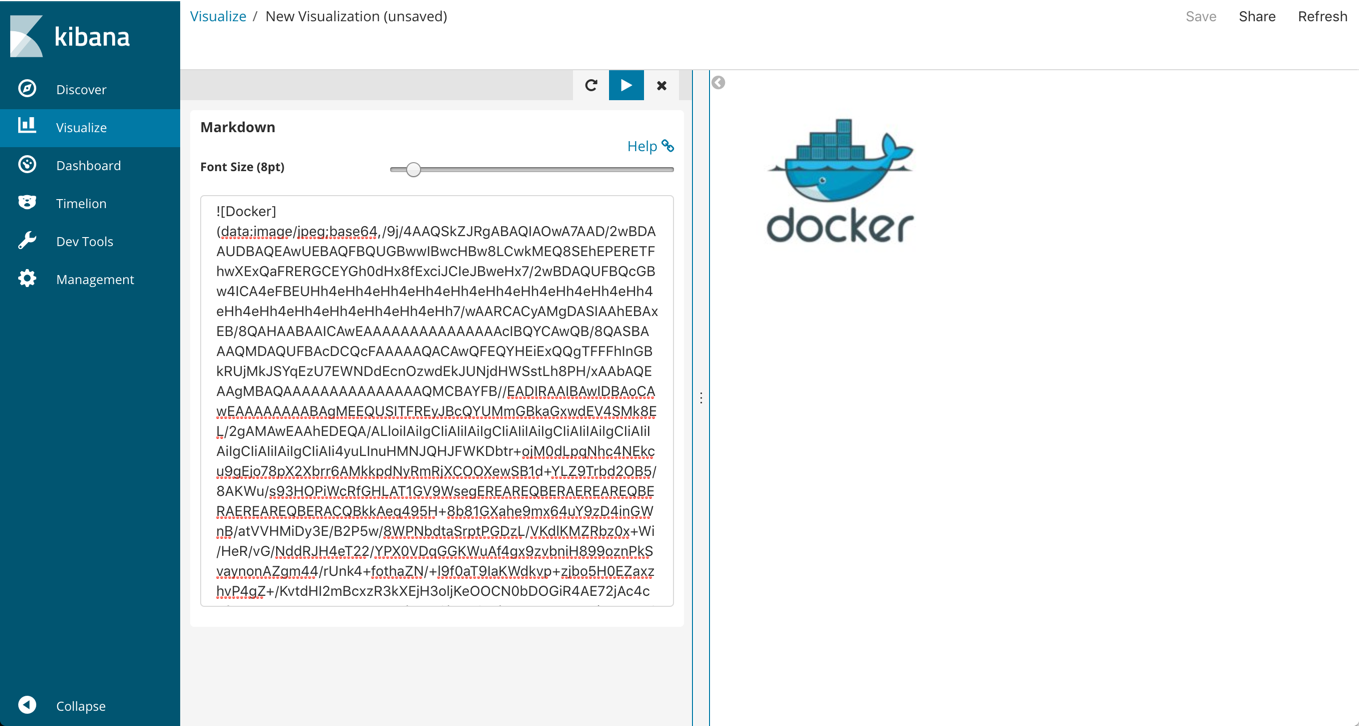
Embedding Images
The new Kibana Canvas will make it really easy to add a nice custom touch to our dashboards by adding images, but until that feature is GA, there is a relatively simple workaround. It involves a markdown visualization and base64 encoding.
So first, use an online encoding tool to upload the image you want to add to your Kibana dashboard. Then, create a new Markdown visualization and use the following syntax:
Inserting Links
Changing the format of a specific field to URL format enables us to hyperlink the field in a visualization. This is the only way to currently link a field from within a specific visualization.
When using multiple dashboards, this can prove quite handy. If you have one main overview dashboard used for monitoring the general health of your system and additional child dashboards that are more specific in nature, you can use this workaround to drill down into specific subsets of your data.
There are two main steps you need to perform - retrieve a target URL and change the format of the field.
To retrieve the target URL to link the field to, open the dashboard you want to link to, and click the Share button at the top.
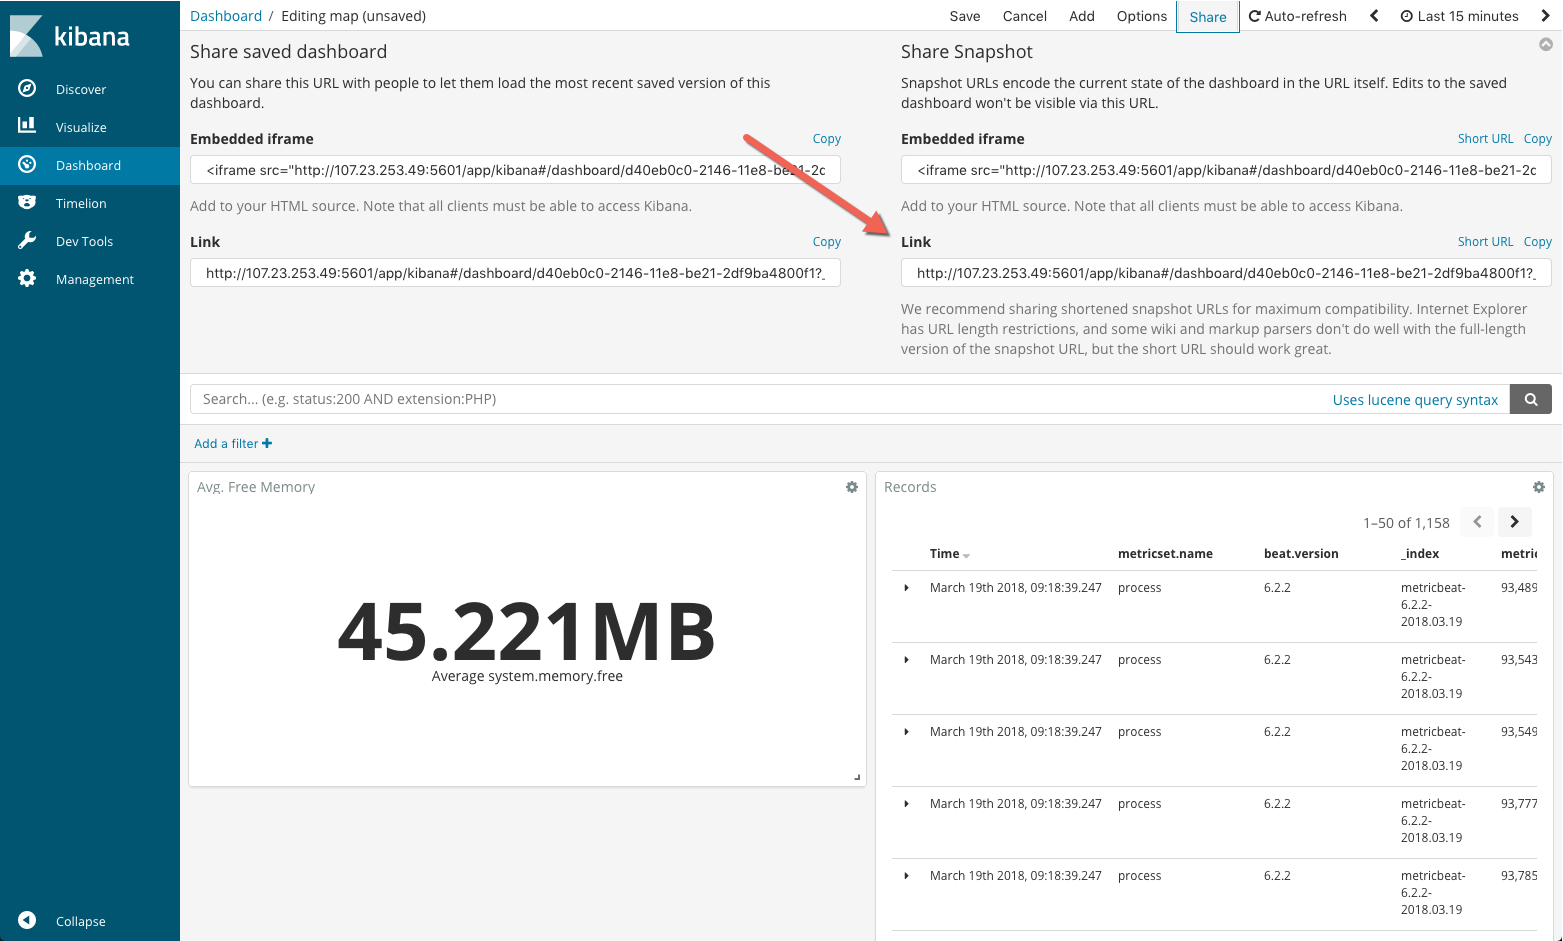
Copy the Share Snapshot URL and paste it in an editor. Out of this long URL, edit only the query section as follows:
query:(language:lucene,query:'fieldName:{{value}}')Be sure to replace fieldName with the name of the field you want to be hyperlinked and copy the entire resulting URL.
Next, open the Management → Index Patterns page in Kibana, locate the field you want to hyperlink and click the Edit icon on the right.
Enter the following settings:
- Format - open the drop-down menu and select.
- Type - leave as 'Link.'
- URL Template - enter the target URL you retrieved in the first step.
- Label Template - enter {{value}}.
Click the Update Field button, and you're done. The field will now be linked to the dashboard you wanted.
Adding Log Messages to Dashboards
When building visualizations, it's easy to focus on the charts, graphs, and coordinate maps. After all, who doesn't like a flashy and colorful dashboard?
In some cases, though, being able to see the log messages themselves in a dashboard can prove useful, especially for event correlation and drilling down into specific events. Surprisingly, and despite the fact that this capability is hiding in plain sight, many Kibana users are not aware that this is even an option.
So, how is it done?
First, make sure you save a search in the Discover page. Be sure to add the fields you want to be displayed in the message display area.
Then, when editing your dashboard, simply click Add as if you were adding a regular visualization but in this case select the Saved Search tab. You will see a list of all your saved searches.
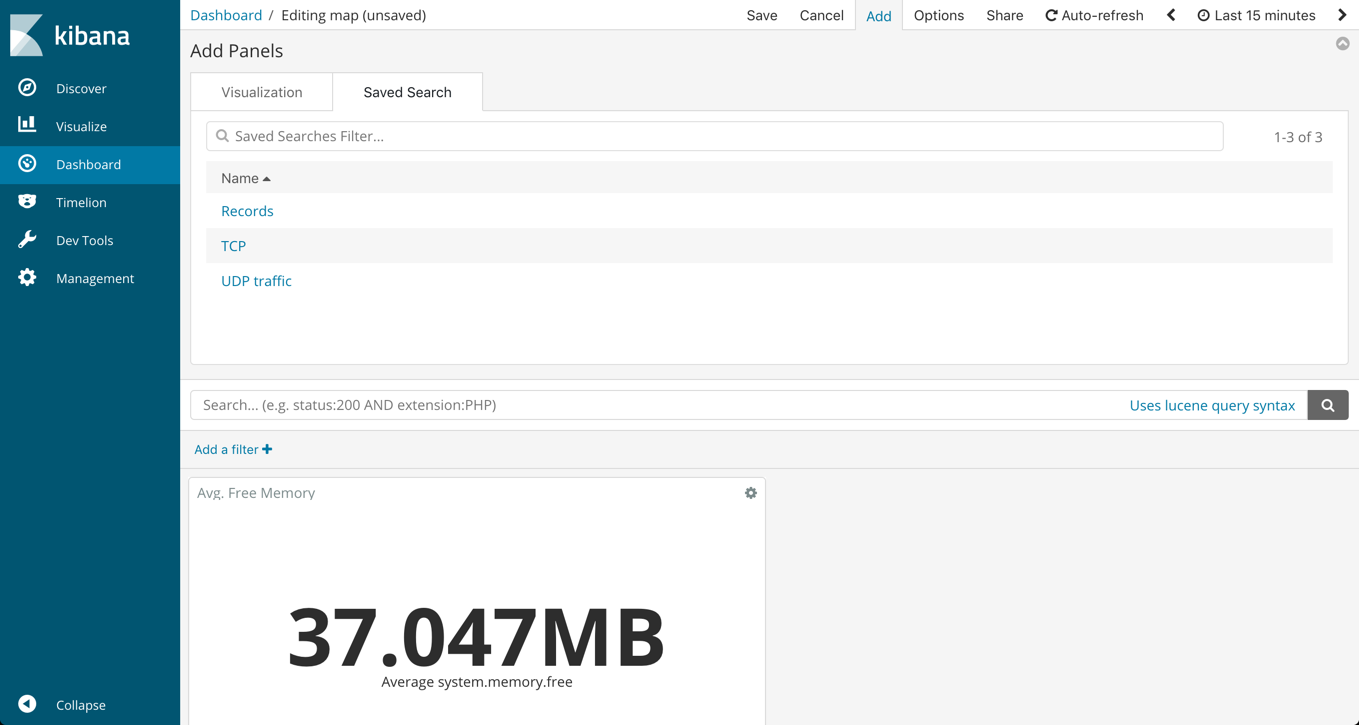
Select your saved search to add a list of relevant logs to your dashboard.
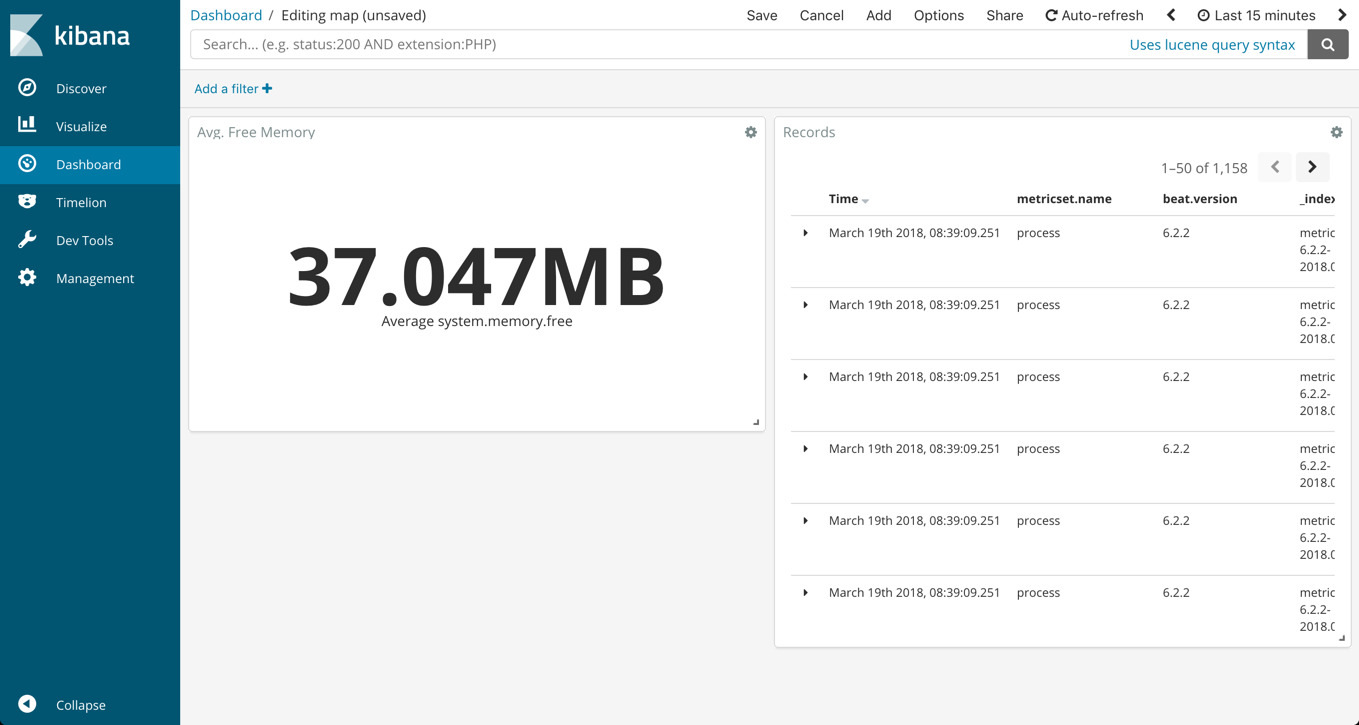
Formatting Fields
Formatting fields can make all the difference.
Take this Metric visualization showing an average aggregation of free memory on my server.
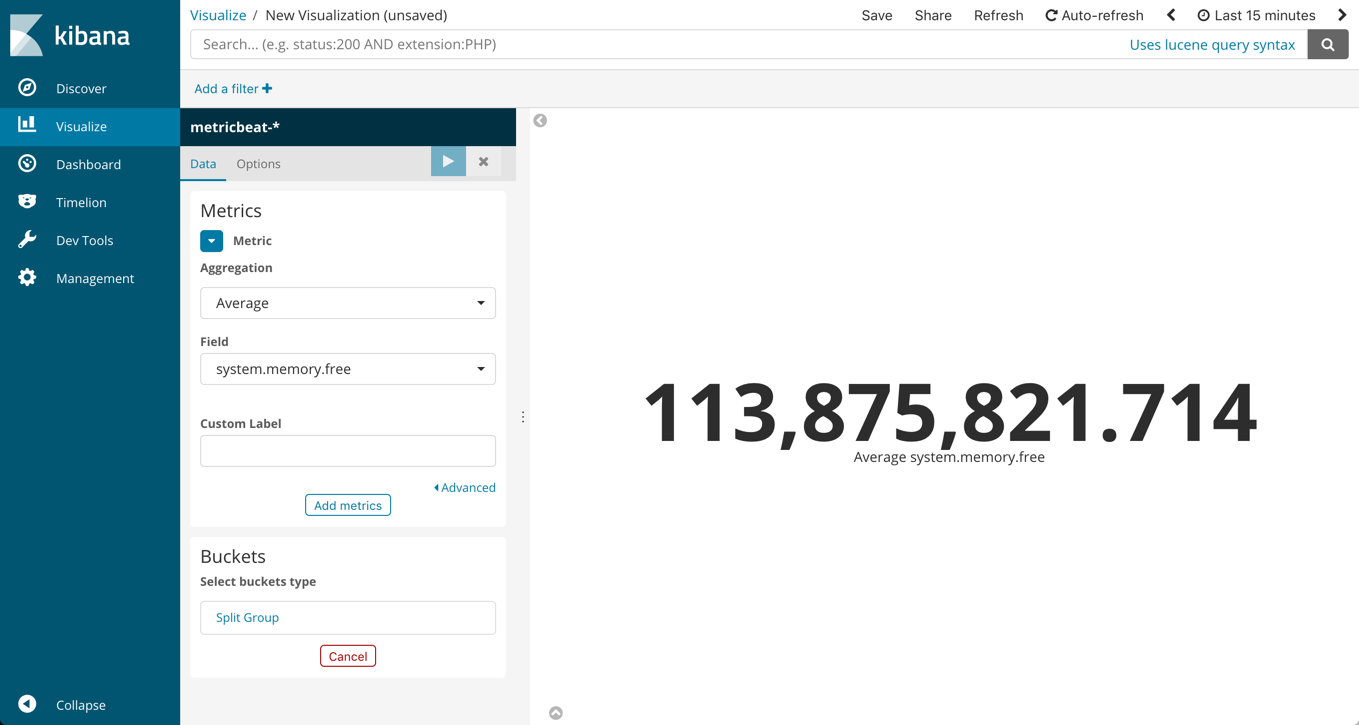
A pretty impressive number, but try and add that to a dashboard. Unless I make the font way smaller or have a very large screen, there is no way it will be displayed intact.
Under Management → Index Patterns, we can find the field in question and edit the way its values are displayed.
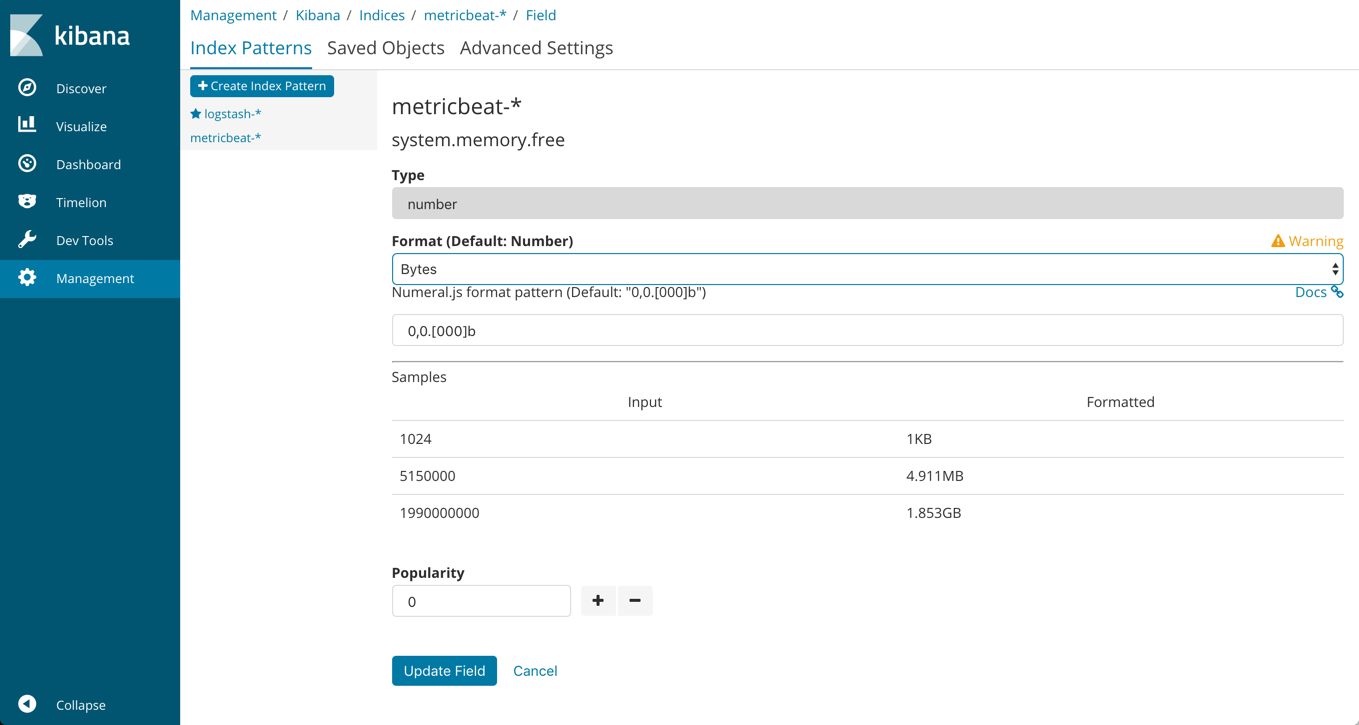
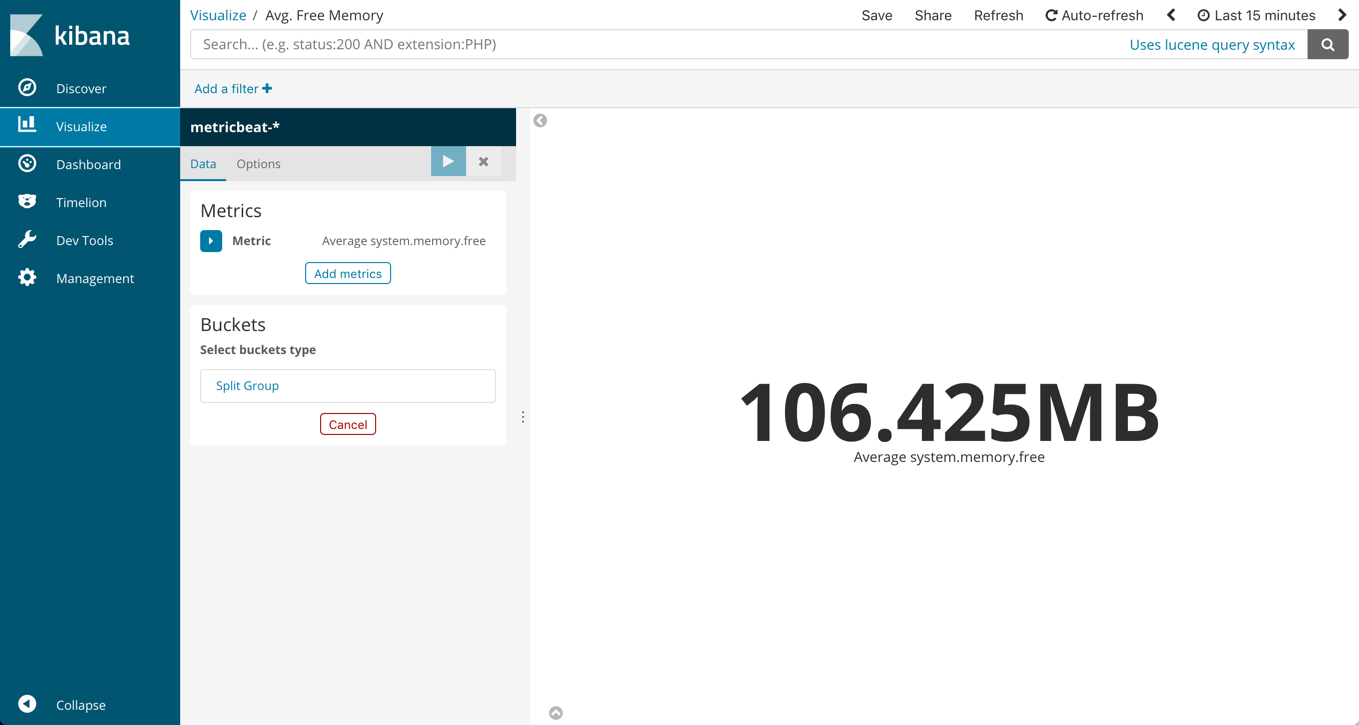
In this case, all we have to do is change the numeral.js format pattern by selecting Bytes from the drop-down menu. The samples section shows us what the value will look like in the end-result. Lo and behold, updating the field gives us a much easier-on-the-eye metric visualization.
Changing Kibana's Look and Feel
I personally like Kibana's look, especially in the recent versions 5.x and 6.x. Some organizations, though, have multiple ELK deployments, each used by different organizations and for different use cases, and changing Kibana's appearance can help differentiate between the different deployments.
If you're a JavaScript and CSS wizard, this is not too difficult. You can, for example, change Kibana's background color and the logo displayed in the top-left corner.
The styles for these elements are defined in Less stylesheets, located in:
$KIBANA_HOME/src/ui/public/chrome/directives/global_nav/
Stop Kibana, make your edits and then remove the bundles directory at:
$KIBANA_HOME/optimize/bundles
Once you're done, start Kibana. A new bundles directory will be created with your updated stylesheets. This will take a while so hang in there.
A word of advice - backup the original settings just in case it turns out your CSS is a bit rusty.
That's it folks. I hope you find at least some of these hacks as useful as I did. I'm sure there are other interesting workarounds and tips that are worth sharing, so if you guys think you have something worth mentioning, please let me know!
Published at DZone with permission of Daniel Berman. See the original article here.
Opinions expressed by DZone contributors are their own.
Comments