KubeCon: Quick Guide to Prometheus Day North America
This post provides an overview of Prometheus Day North America, a day centered around all of the CNCF projects related to Prometheus and observability.
Join the DZone community and get the full member experience.
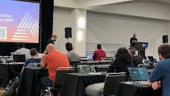
Join For FreeOn October 25, I was on-site in Detroit at KubeCon and CloudNativeCon pre-event Prometheus Day North America. It was on-site at the Huntington Place Convention Center in room 360, which is on the river with views across the water into Canada (just a bit of geography, as many attendees I spoke with were not aware that Detroit was so close to the northern US border).
The full schedule for Open Observability Day is available online, but I wanted to share an overview impression of what it was like to be there.

The day is centered around all of the CNCF projects related to Prometheus and observability. Let's look closer at my impressions of the sessions I found interesting.
The day started with Richard Hartmann, the director of community at Grafana Labs, giving a welcome message and some housekeeping for the on-site attendees. After this, the two short 10-minute keynotes kicked off the day.
Below you'll find an impression of the day as I cover a few of the sessions that I really enjoyed.
Reality Check: Is It Time To Raise Your Metrics Game?
Martin Mao, CEO of Chronosphere, and Yash Kumaraswamy, Senior Staff Engineer from Robinhood, tag teamed nicely to feature Robinhood's experiences with developing great ROI while raising their metrics game across the organization.

In closing, Martin announced the full open sourcing of the PromLens project, the upstream project that has been in Chronosphere's platform for some time now. Together in collaboration with creator Julius Volgt, it's available on GitHub under the Prometheus organization with full instructions on how to build it from scratch. Read more about how to make the PromLens Query Builder open-source for all.
Film Premiere of Inside Prometheus: An Open Source System That Changed Technology
A special screening of the Prometheus origin story was shown for the first time ever, live at the Prometheus event. It features some of the big names involved with Chronosphere's evolution: Rob Skillington, CTO of Chronosphere, and Julius Volz, co-founder of the Prometheus project.
This is a great feature documentary film that covers one of the core origin stories of a world-changing open-source project known as Prometheus, that changed how the world does cloud native observability.
Achieving Zero-Instrumentation Monitoring With eBPF
Kemal Akkoyun from Polar Signals provided a very cool look at how you can sidecar eBPF for tracing your application without any sort of instrumenting. The ability to attach eBPF programs to trace points as well as kernel and user application probe points allows unprecedented visibility into the runtime behavior of applications and the system itself. It's closely tied with the Linux kernel and is a very interesting technology for the tracing, profiling, and security aspects of your applications and systems.
Automate Your SLO Validation With Prometheus and Flagger
Sanskar Jaiswal and Kingdon Patrick Barrett, both from Weaveworks, gave a really fun talk on progressive deployments. Basically, the talk covered having an application running and then gradually spinning up a new instance in stages — 10-30-50-80-100% — to provide you with breakpoints in testing without wasting full resources. You only proceed once the current stage completes and passes testing. Covering innovative work with Prometheus and Flagger, this talk included a live demo on stage, which was brave with the lagging connectivity on site!
Keda With Prometheus: Scaling Your Kubernetes Application With Custom Metrics
David Lorite Solanas and Jesus Angel Samitier, both from Sysdig, talked about adding more information from your customer metrics collections to what you would normally have using Kubernetes High-Performance Autoscaler (HPA). They discussed how HPA does have some shortcomings that can be fixed using Keda. It can use custom metrics to scale an application, even with a secure Prometheus remote endpoint. This is a nice idea for fine-tuning your HPA experiences, and Keda is in the CNCF incubating projects listing.
Centralized vs Decentralized Prometheus Scraping Architecture With DoorDash
Rabun Kosar from DoorDash and Ales Koprivnikar from Chronosphere presented a showcase on the advantages of centralized versus decentralized scraping of Prometheus metrics at a massive cloud-native scale. Rabun dived into the details of how DoorDash approaches this across their massive Kubernetes deployments (example provided at +35k scraping targets at peak use) with a real focus on customer satisfaction. This was super interesting, in that the scale of this use case is proving the approach can be a hybrid of both centralized and decentralized metrics collecting.
Prometheus in the MLOps Lifecycle
Rishit Dagli from Narayana Junior College and Shivay Lamba from Meilisearch shared some research they are doing in the machine learning operations domain. They covered the differences in monitoring ML domains, where models are the applications and data distribution is much different than the normal application monitoring. It was interesting to see the different ways Prometheus is used in the wild.
This overview does not include all of the talks held but gives a nice impression. I must admit, I was unable to capture all of the sessions due to networking that happens during the breaks. Several times I got into in-depth discussions that kept me out in the halls or at a booth longer than the breaks were planned for, but that's a great part of these events!
Published at DZone with permission of Eric D. Schabell. See the original article here.
Opinions expressed by DZone contributors are their own.
Comments