Mastering Kubernetes Observability: Boost Performance, Security, and Stability With Tracestore, OPA, Flagger, and Custom Metrics
This guide walks you through using Tracestore, OPA, Flagger, and custom metrics to make Kubernetes more observable, with better tracing, policy control, and performance.
Join the DZone community and get the full member experience.
Join For FreeIn modern microservices architectures, achieving comprehensive observability is not just an option—it's a necessity. As applications scale dynamically within Kubernetes environments, tracking performance issues, enforcing security policies, and ensuring smooth deployments become complex challenges. Traditional monitoring solutions alone cannot fully address these challenges.
This guide explores four powerful tools that significantly improve observability and control in microservices environments:
Tracestore: Provides deep insights into distributed tracing, enabling developers to track request flows, identify latency issues, and diagnose bottlenecks across microservices.OPA(Open Policy Agent): Ensures security and governance by enforcing dynamic policy controls directly within Kubernetes environments.Flagger: Enables automated progressive delivery, minimizing deployment risks through intelligent traffic shifting and rollback strategies.- Custom Metrics: Captures application-specific metrics, offering enhanced insights that generic monitoring tools may overlook.
Developers often struggle with diagnosing latency issues, securing services, and ensuring stable deployments in dynamic Kubernetes environments. By combining Tracestore, OPA, Flagger, and Custom Metrics, you can unlock enhanced visibility, improve security enforcement, and streamline progressive delivery processes.
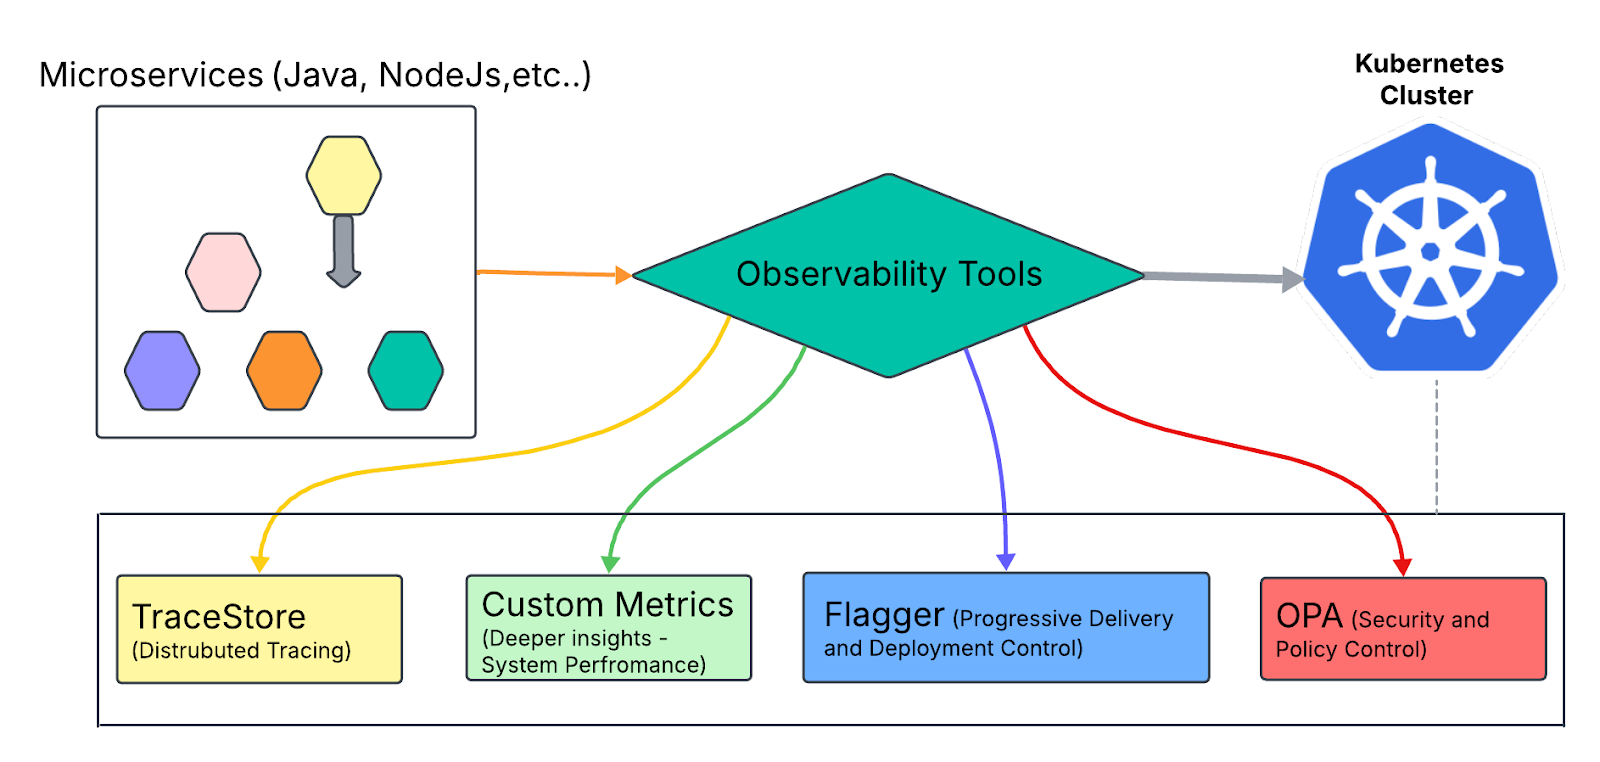
This diagram illustrates how Observability Tools integrate with a Kubernetes Cluster and Microservices (Java, Node.js, etc.). Key tools like TraceStore (Distributed Tracing), Custom Metrics (Performance Insights), Flagger (Deployment Control), and OPA (Policy Enforcement) enhance system visibility, security, and stability.
Why These Tools Are Essential for Microservices Observability
The combination of these tools addresses crucial pain points that traditional observability approaches fail to resolve:
Tracestorevs.Jaeger: WhileJaegeris a well-known tracing tool,Tracestoreintegrates seamlessly with OpenTelemetry, providing greater flexibility with streamlined configurations, ideal for modern cloud-native applications.OPAvs.Kyverno:OPAexcels in complex policy logic and dynamic rule enforcement, offering advanced flexibility thatKyverno's simpler syntax may not provide in complex security scenarios.Flaggervs.Argo Rollouts:Flagger's automated progressive delivery mechanisms, especially withIstioandLinkerdintegration, offer developers a streamlined way to deploy changes safely with minimal manual intervention.
The Unique Value of These Tools
- Improved Developer Insights:
Tracestoreenhances visibility by tracking transactions across microservices, ensuring better root-cause analysis for latency issues. - Enhanced Security Posture:
OPAdynamically enforces security policies, reducing vulnerabilities without frequent manual updates to application logic. - Faster and Safer Deployments:
Flagger’s canary deployment automation allows developers to deploy features faster, with automatic rollback for failing releases. - Business-Centric Observability: Custom Metrics empower developers to align performance data with critical business KPIs, ensuring that engineering efforts focus on what matters most.
By integrating these tools, developers gain a comprehensive, proactive observability strategy that improves application performance, strengthens security enforcement, and simplifies deployment processes. This guide focuses on code snippets, best practices, and integration strategies tailored to help developers implement these solutions directly in their applications.
Step 1: Tracestore Implementation for Developers
Why Prioritize Tracestore?
In modern microservices architectures, tracking how requests flow across services is essential to diagnose performance issues, identifying latency bottlenecks, and maintain application reliability. Traditional debugging methods often struggle in distributed environments, where failures may occur across multiple interconnected services.
Tracestore addresses these challenges by enabling distributed tracing, allowing developers to visualize request paths, track dependencies, and pinpoint slow or failing services in real-time. By integrating Tracestore, developers gain valuable insights into their application's behavior, enhancing troubleshooting efficiency and improving system reliability.
Without Distributed Tracing: Identifying performance bottlenecks and tracing errors in microservices without context propagation is extremely challenging. Developers are forced to rely on fragmented logs, delaying issue resolution.
With Distributed Tracing: By propagating trace context headers across services, developers can achieve complete request visibility, improving latency analysis and fault isolation.
Without Distributed Tracing: No Visibility Across Services
Without distributed tracing, requests across services lack trace context, making it difficult to track the flow of requests. This leads to fragmented logs, limited visibility, and complex debugging when issues arise. The diagram below illustrates how requests are processed without trace context, resulting in no clear insight into service interactions.
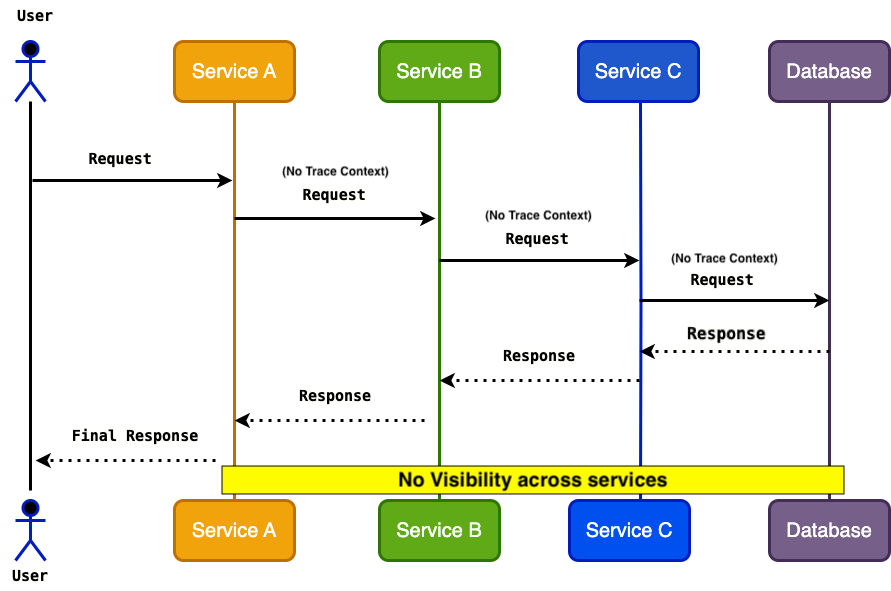
Service Communication Without Distributed Tracing — This diagram shows a microservices environment where requests are processed without trace context. As a result, developers face no visibility across services, making it difficult to diagnose issues, track failures, or identify performance bottlenecks.
With Distributed Tracing: Visibility Across Services
This diagram illustrates how trace context (e.g., traceparent header) is injected and forwarded across multiple services. Each service propagates the trace context through outgoing requests to ensure continuity in the trace flow. The database call includes the trace context, ensuring full visibility across all service interactions, which helps developers trace issues, measure latency, and diagnose bottlenecks effectively.
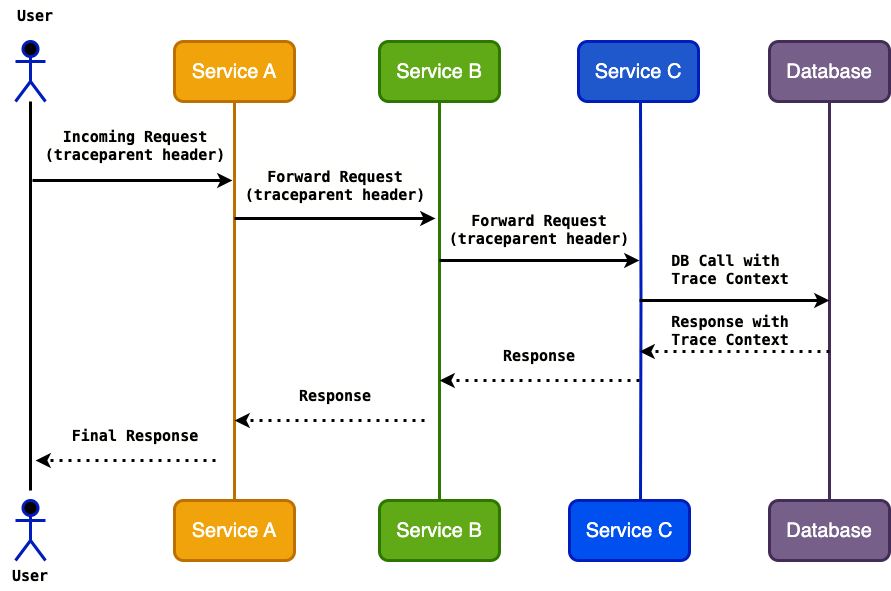
Trace Context Propagation in a Microservices Architecture - Demonstrates how trace context flows across services via traceparent headers, enabling end-to-end request tracking for improved observability.
Java Application - Tracestore Integration (Spring Boot)
This code snippet demonstrates how to integrate OpenTelemetry for distributed tracing in a Spring Boot application using Java. Let's break down each part for better understanding:
Dependencies:
<dependency>
    <groupId>io.opentelemetry</groupId>
    <artifactId>opentelemetry-sdk</artifactId>
    <version>1.20.0</version>
</dependency>
<dependency>
    <groupId>io.opentelemetry</groupId>
    <artifactId>opentelemetry-exporter-otlp</artifactId>
    <version>1.20.0</version>
</dependency>
Explanation:
opentelemetry-sdk— This is the core OpenTelemetry SDK required to create traces and manage spans in Java applications. It includes the key components likeTracerProvider, context propagation, and sampling strategies.opentelemetry-exporter-otlp— This exporter sends trace data to an OpenTelemetry Collector or directly to an observability backend (e.g., Jaeger, Tempo) using the OTLP (OpenTelemetry Protocol).
Both dependencies are crucial for enabling trace generation and exporting the data to your monitoring platform.
Configuration in Code:
@Configuration
public class OpenTelemetryConfig {
    @Bean
    public OpenTelemetry openTelemetry() {
        return OpenTelemetrySdk.builder()
            .setTracerProvider(SdkTracerProvider.builder().build())
            .build();
    }
    @Bean
    public Tracer tracer(OpenTelemetry openTelemetry) {
        return openTelemetry.getTracer("my-application");
    }
}
Explanation:
@ConfigurationAnnotation: Marks this class as a Spring Boot configuration class where beans are defined.@Bean public OpenTelemetry openTelemetry()- This method creates and configures an instance ofOpenTelemetrySdk, which is the core entry point for instrumenting code. The TracerProvider is initialized usingSdkTracerProvider.builder()to create and manage tracer instances, ensuring each service instance has a dedicated tracer. The.build()method finalizes the configuration.@Bean public Tracer tracer()- This method defines aTracerbean that will be injected into application components requiring tracing.getTracer("my-application")assigns a service name (my-application) that identifies this application in the observability backend.
Instrumenting REST Template With Tracing
@Configuration
public class RestTemplateConfig {
    @Bean
    public RestTemplate restTemplate() {
        return new RestTemplateBuilder()
            .interceptors(new RestTemplateInterceptor())
            .build();
    }
}
Explanation: The RestTemplateInterceptor intercepts outbound HTTP calls and adds a trace span. The span ensures the trace context is propagated to downstream services.
Cron Job Example With Tracestore
@Component
public class ScheduledTask {
    private final Tracer tracer;
    public ScheduledTask(Tracer tracer) {
        this.tracer = tracer;
    }
    @Scheduled(fixedRate = 5000)
    public void performTask() {
        Span span = tracer.spanBuilder("cronjob-task").startSpan();
        try (Scope scope = span.makeCurrent()) {
            System.out.println("Executing scheduled task");
        } finally {
            span.end();
        }
    }
}
Node.js Application - Tracestore Integration
This code snippet demonstrates how to integrate OpenTelemetry for distributed tracing in a Node.js application. Let's break down the dependencies, configuration, and their significance for effective observability.
Dependencies Installation:
npm install @opentelemetry/api @opentelemetry/sdk-trace-node @opentelemetry/exporter-trace-otlp-http
Explanation:
@opentelemetry/api— Provides the core API interfaces for tracing. This ensures the application follows OpenTelemetry standards for tracing APIs.@opentelemetry/sdk-trace-node— The Node.js SDK implementation that integrates directly with Node’s ecosystem to create and manage spans.@opentelemetry/exporter-trace-otlp-http— Exports trace data to an OpenTelemetry Collector or directly to an observability backend (e.g., Jaeger, Tempo) using the OTLP (OpenTelemetry Protocol).
These dependencies form the foundation for trace instrumentation and data export in Node.js applications.
Configuration in tracer.js
const { NodeTracerProvider } = require('@opentelemetry/sdk-trace-node');
const { OTLPTraceExporter } = require('@opentelemetry/exporter-trace-otlp-http');
const { SimpleSpanProcessor } = require('@opentelemetry/sdk-trace-base');
const provider = new NodeTracerProvider();
const exporter = new OTLPTraceExporter({ url: 'http://otel-collector:4317' });
provider.addSpanProcessor(new SimpleSpanProcessor(exporter));
provider.register();
Explanation:
NodeTracerProviderInitialization: TheNodeTracerProvideris the primary tracing provider for Node.js applications, responsible for creating and managing tracers. This provider handles lifecycle management, sampling, and context propagation.OTLPTraceExporterConfiguration: TheOTLPTraceExportersends trace data to the OpenTelemetry Collector or observability backend. The URL'http://otel-collector:4317'points to the OTLP endpoint in the OpenTelemetry Collector, which efficiently processes and forwards trace data.SimpleSpanProcessorSetup: TheSimpleSpanProcessoris a lightweight span processor that exports spans immediately as they finish. For production environments, consider switching toBatchSpanProcessorfor improved performance via batch data exports.provider.register()Registration: Registers the tracer provider globally in the Node.js application. This step ensures that any instrumented modules, middleware, or libraries automatically utilize the defined tracer.
Configuration for otel.host and Key Properties
Impact of Configuration on Scalability and Performance
otel.exporter.otlp.endpointConsiderations: For scalable architectures, ensure the endpoint points to a load-balanced OpenTelemetry Collector service to handle increased trace data volume efficiently.otel.exporter.otlp.protocolChoices: Usehttp/protobuffor lightweight, high-performance transmission in high-traffic environments. ConsidergRPCfor improved reliability with built-in retries and flow control.otel.traces.samplerStrategies: Useparentbased_always_onfor detailed tracing in development. Switch toparentbased_traceidratiowith a ratio (e.g.,0.1) in production to reduce overhead while still capturing meaningful insights.
Adding Custom Attributes to Spans
Sample Code:
app.get('/payment/:id', (req, res) => {
    const span = tracer.startSpan('payment-processing');
    span.setAttribute('payment_id', req.params.id);
    span.setAttribute('user_role', req.user.role);
    try {
        processPayment(req.params.id);
        res.send('Payment Processed');
    } catch (error) {
        span.recordException(error);
    } finally {
        span.end();
    }
});
Explanation: setAttribute() attaches useful data to the span for better trace visibility. recordException() captures errors for deeper analysis.
Trace ID Propagation in Microservices
Outgoing Request (Client Side):
const { context, trace, propagation } = require('@opentelemetry/api');
const axios = require('axios');
app.get('/trigger-service', async (req, res) => {
    const span = tracer.startSpan('trigger-service-call');
    try {
        const headers = {};
        propagation.inject(context.active(), headers);
        const response = await axios.get('http://other-service/api', { headers });
        res.json(response.data);
    } finally {
        span.end();
    }
});
Incoming Request (Server Side):
const { context, propagation, trace } = require('@opentelemetry/api');
app.get('/api', (req, res) => {
    const extractedContext = propagation.extract(context.active(), req.headers);
    const span = tracer.startSpan('incoming-request', { parent: extractedContext });
    try {
        res.send('Data Retrieved');
    } finally {
        span.end();
    }
});
OpenTelemetry Data Flow in a Microservices Architecture — This diagram illustrates the flow of trace data from the application code to the observability backend. The OpenTelemetry SDK generates trace data, which is exported via OTLP to the OpenTelemetry Collector. The collector processes and forwards the data to observability backends like Jaeger or Tempo for visualization and analysis.
Trace Context Propagation Pitfalls
While propagating the trace context, developers should watch out for common issues like:
- Missing Headers in Async Flows: In environments using async processing (e.g., message queues or event-driven systems), headers containing the
traceparentvalue may be lost. Solutions include injecting the trace context as part of the message payload and using middleware or interceptors to capture and propagate the trace context efficiently. - Service Boundary Drops: If services use different frameworks or libraries that don't standardize trace propagation, you may experience gaps in traces. Using OpenTelemetry’s
Context Propagation APIhelps maintain trace continuity across such environments.
Step 2: OPA (Open Policy Agent) for Developers
Why Use OPA for Security and Policy Enforcement?
Open Policy Agent (OPA) is a powerful tool for enforcing security policies and ensuring consistent access management in Kubernetes environments. By leveraging Rego logic, OPA dynamically validates requests, prevents unauthorized access, and strengthens compliance measures. Below are the Key Benefits of OPA for Security and Policy Enforcement
- Admission Control: Prevents unauthorized deployments by validating manifests before they're applied to the cluster.
- Access Control: Ensures only authorized users and services can access specific endpoints or resources.
- Data Filtering: Limits sensitive data exposure by enforcing filtering rules at the API layer.
Practical Example: In a multi-tenant SaaS environment, OPA can:
- Deny requests that attempt to access resources outside the user's assigned tenant.
- Enforce RBAC rules dynamically based on request parameters without modifying the application code.
OPA’s flexible Rego policies enable developers to define complex logic that adapts to evolving security and operational requirements.
Example Use Case: Consider a multi-tenant SaaS application where customers have isolated data and permissions. Using OPA, developers can:
- Deny requests that attempt to access resources outside the user's assigned tenant.
- Enforce RBAC rules dynamically based on request parameters without modifying the application code.
OPA’s flexible Rego policies enable developers to define complex logic that adapts to evolving security and operational requirements.
Understanding OPA Webhook
OPA Webhooks are designed to enforce policy decisions before resources are created or modified in Kubernetes. When a webhook is triggered, OPA evaluates the incoming request against the defined policy rules and returns an allow or deny decision.
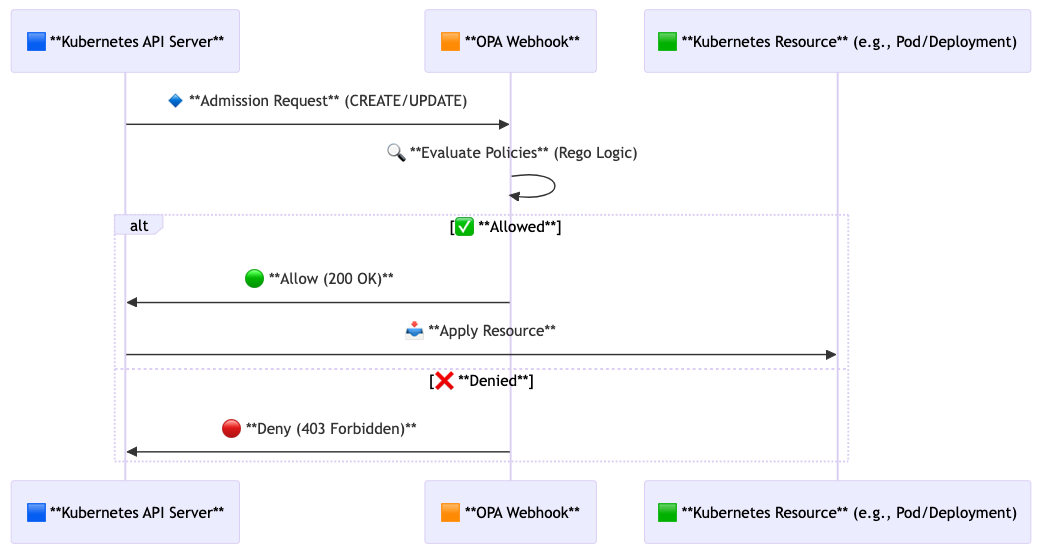
This diagram showcases the OPA webhook evaluation process during Kubernetes admission control, ensuring secure policy enforcement before resource creation.
OPA Webhook Configuration Example
apiVersion: admissionregistration.k8s.io/v1
kind: MutatingWebhookConfiguration
metadata:
  name: opa-webhook
webhooks:
  - name: "example-opa-webhook.k8s.io"
    clientConfig:
      url: "https://opa-service.opa.svc.cluster.local:443/v1/data/authz"
    rules:
      - operations: ["CREATE", "UPDATE"]
        apiGroups: [""]
        apiVersions: ["v1"]
        resources: ["pods"]
    failurePolicy: Fail
Where Rego Policies are Configured
Rego policies are stored in designated policy repositories or inside Kubernetes ConfigMaps. For example:
Example Policy ConfigMap:
apiVersion: v1
kind: ConfigMap
metadata:
  name: opa-policy-config
  namespace: opa
  labels:
    openpolicyagent.org/policy: rego
  annotations:
    openpolicyagent.org/policy-status: "active"
data:
  authz.rego: |
    package authz
    default allow = false
    allow {
        input.user == "admin"
        input.action == "read"
    }
    allow {
        input.user == "developer"
        input.action == "view"
    }
Deployment YAML With OPA as a Sidecar
To integrate OPA as a sidecar, modify your deployment YAML as shown below:
apiVersion: apps/v1
kind: Deployment
metadata:
  name: sample-app
spec:
  replicas: 2
  selector:
    matchLabels:
      app: sample-app
  template:
    metadata:
      labels:
        app: sample-app
    spec:
      containers:
      - name: sample-app
        image: sample-app:latest
        ports:
        - containerPort: 8080
      - name: opa-sidecar
        image: openpolicyagent/opa:latest
        args:
        - "run"
        - "--server"
        - "--config-file=/config/opa-config.yaml"
        volumeMounts:
        - mountPath: /config
          name: opa-config-volume
        - mountPath: /policies
          name: opa-policy-volume
      volumes:
      - name: opa-config-volume
        configMap:
          name: opa-config
      - name: opa-policy-volume
        configMap:
          name: opa-policy-config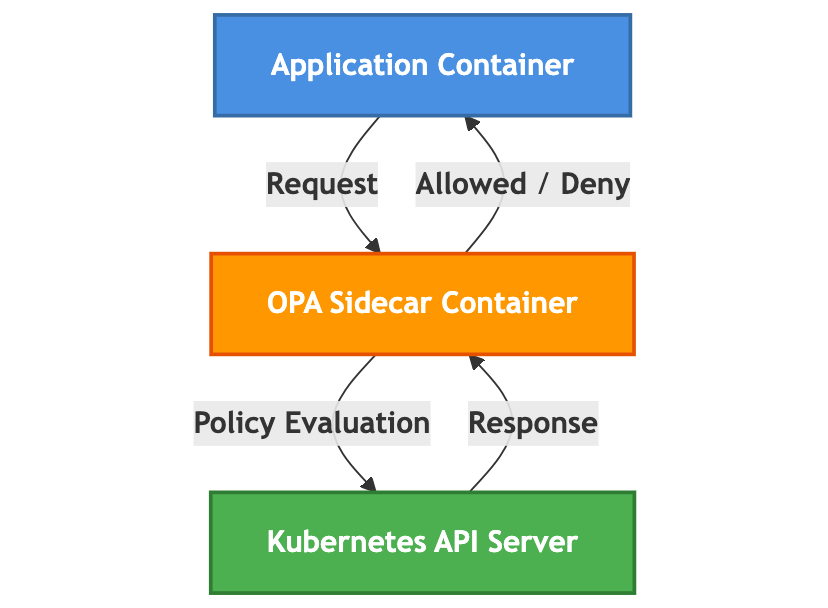
This diagram highlights the OPA sidecar's role in intercepting application requests and enforcing security policies in Kubernetes environments.
Sample OPA Policy (Rego) for Access Control
OPA policies are written in Rego language. Below are example policies for controlling API endpoint access.
authz.rego
package authz
default allow = false
allow {
    input.user == "admin"
    input.action == "read"
}
allow {
    input.user == "developer"
    input.action == "view"
}
allow {
    input.role == "finance"
    input.action == "approve"
}
allow {
    input.ip == "192.168.1.1"
    input.method == "GET"
}
allow {
    input.role == "editor"
    startswith(input.path, "/editor-area/")
}
allow {
    input.role == "viewer"
    startswith(input.path, "/public/")
}
Explanation of Rules
AdminRule: Grants read access to users with the admin role.DeveloperRule: Allows viewing actions for users with the developer role.FinanceRole Rule: Grants approve permissions to users in the finance role.IP-Based RestrictionRule: AllowsGETrequests fromIP 192.168.1.1. Useful for internal-only API endpoints.Editor AccessRule: Grants access to endpoints starting with/editor-area/for users with theeditorrole.Viewer AccessRule: Permits access to/public/endpoints for users with theviewerrole.
Each rule ensures clear conditions to improve security, role management, and resource control.
Java Integration - OPA Policy Enforcement
OPA rules can be integrated into Java applications using HTTP requests to communicate with the OPA sidecar.
Sample Java Code for Access Control
import org.springframework.web.bind.annotation.*;
import org.springframework.http.ResponseEntity;
import org.springframework.http.HttpStatus;
import org.springframework.web.client.RestTemplate;
@RestController
@RequestMapping("/secure")
public class SecureController {
    @PostMapping("/access")
    public ResponseEntity<String> checkAccess(@RequestBody Map<String, String> request) {
        RestTemplate restTemplate = new RestTemplate();
        String opaEndpoint = "http://localhost:8181/v1/data/authz";
        ResponseEntity<Map> response = restTemplate.postForEntity(opaEndpoint, request, Map.class);
        boolean allowed = (Boolean) response.getBody().get("result");
        if (allowed) {
            return ResponseEntity.ok("Access Granted");
        }
        return ResponseEntity.status(HttpStatus.FORBIDDEN).body("Access Denied");
    }
}
Node.js Integration - OPA Policy Enforcement
OPA can also be integrated into Node.js applications using HTTP requests to query the OPA sidecar.
Sample Node.js Code for Access Control
const express = require('express');
const axios = require('axios');
const app = express();
app.use(express.json());
app.post('/access', async (req, res) => {
    const opaEndpoint = 'http://localhost:8181/v1/data/authz';
    try {
        const response = await axios.post(opaEndpoint, { input: req.body });
        if (response.data.result) {
            res.status(200).send('Access Granted');
        } else {
            res.status(403).send('Access Denied');
        }
    } catch (error) {
        res.status(500).send('OPA Evaluation Failed');
    }
});
app.listen(3000, () => console.log('Server running on port 3000'));
Explanation:
- The
/accessendpoint forwards user actions and roles to theOPAsidecar. - The
OPAresponse defines whether the request is accepted or rejected.
Best Practices for OPA Integration
- Minimize Complex Logic in Policies: Keep your
Regopolicies simple, with clear rules to avoid performance bottlenecks. - Utilize Versioning for Policies: To prevent compatibility issues, version your policy files and bundles.
- Leverage OPA’s Decision Logging: Enable
OPA’s decision logs for better observability and debugging. - Cache OPA Responses Where Possible: For repeated evaluations, caching improves performance.
Hierarchical Policy Enforcement Example (Admin, User, Guest Roles)
OPA effectively enforces role-based permissions by defining clear security boundaries for different user roles, such as:
Admin: Full control with unrestricted access.User: Limited permissions based on defined criteria.Guest: Restricted to read-only access.
By integrating OPA, developers can achieve robust security, improved compliance, and dynamic policy enforcement — all without modifying application code directly.
Example Rego Policy for Role-Based Access Control:
package authz
default allow = false
allow {
    input.user.role == "admin"
    input.action in ["create", "read", "update", "delete"]
}
allow {
    input.user.role == "user"
    input.action in ["read", "update"]
}
allow {
    input.user.role == "guest"
    input.action == "read"
}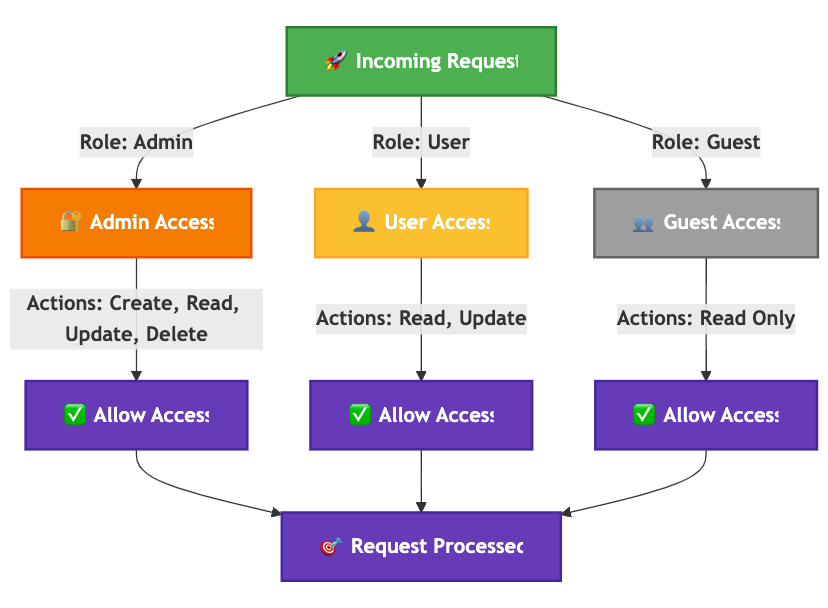
This decision tree visualizes how different roles such as Admin, User, and Guest receive distinct permissions via Rego policies.
Sidecar Scaling Concerns in High-Traffic Environments
- CPU/Memory Overhead: Each
OPAsidecar requires its resources, which can increase overhead when scaling pods. - Latency Impact:
OPAevaluations introduce latency, especially with complex policies. - Cluster-Wide Policy Management: Scaling sidecars across hundreds of pods can create maintenance overhead.
Solutions:
- Enable
OPAbundle caching to reduce frequent policy fetches. - Optimize
Regopolicies by limiting nested conditions and leveraging partial evaluation to pre-compute logic. - For large-scale environments, consider deploying a centralized
OPAinstance or usingOPA Gatekeeperfor improved scalability.
Policy Versioning Best Practices
- Use
Gitfor Version Control - Implement
CI/CDPipelines for Policies - Leverage
OPA’s Bundle API for consistent policy distribution. - Tag Stable Policy Versions
- Automate Rollbacks for Broken Policies
Step 3: Flagger Implementation for Developers
Flagger's Role in CI/CD Pipelines
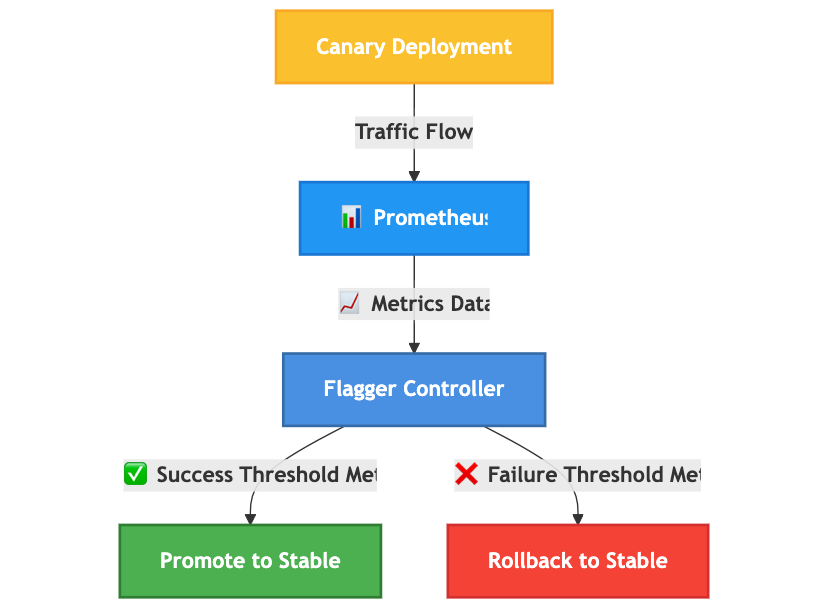
Flagger automates progressive delivery in Kubernetes by gradually shifting traffic to the canary deployment while measuring success rates, latency, and custom metrics.
Flagger plays a crucial role in ensuring safer and automated releases in CI/CD pipelines. By integrating Flagger, developers can:
- Automate progressive rollouts, reducing deployment risks.
- Continuously validate new releases by analyzing real-time metrics.
- Trigger
webhooksfor automated testing or data validation before fully shifting traffic.
This computerized approach empowers developers to deploy changes confidently while minimizing service disruptions.
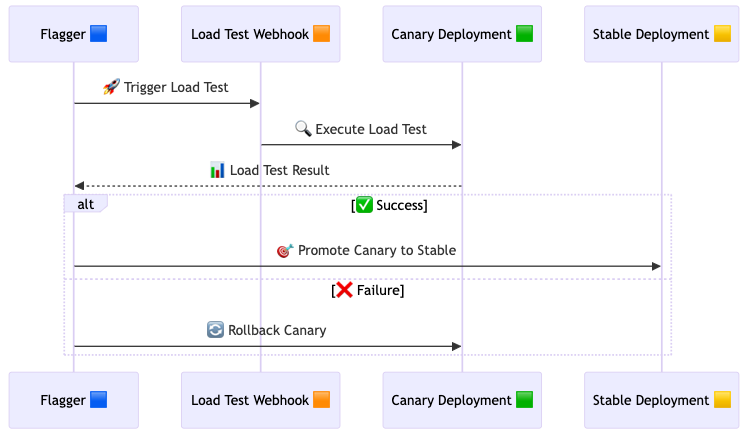
This diagram shows Flagger's automated canary deployment process, where Flagger triggers a load test, evaluates results, and either promotes the canary to stable or rolls it back on failure.
Flagger Canary Deployment Configuration
Sample Flagger Canary Configuration
apiVersion: flagger.app/v1beta1
kind: Canary
metadata:
  name: podinfo
  namespace: test
spec:
  provider: istio
  targetRef:
    apiVersion: apps/v1
    kind: Deployment
    name: podinfo
  progressDeadlineSeconds: 60
  autoscalerRef:
    apiVersion: autoscaling/v2beta2
    kind: HorizontalPodAutoscaler
    name: podinfo
  service:
    gateways:
    - monitor/monitor-gw
    hosts:
    - monitor.dev.scus.cld.samsclub.com
    name: podinfo
    port: 9898
    targetPort: 9898
    portName: http
    portDiscovery: true
    match:
      - uri:
          prefix: /
    rewrite:
      uri: /
    timeout: 5s
  skipAnalysis: false
  analysis:
    interval: 1m
    threshold: 10
    maxWeight: 50
    stepWeight: 5
    metrics:
    - name: checkout-failure-rate
      templateRef:
        name: checkout-failure-rate
        namespace: istio-system
      thresholdRange:
        max: 1
      interval: 1m
    webhooks:
      - name: "load test"
        type: rollout
        url: http://flagger-loadtester.test/
        metadata:
          cmd: "hey -z 1m -q 10 -c 2 http://podinfo.test:9898/"
    alerts:
      - name: "dev team Slack"
        severity: error
        providerRef:
          name: dev-slack
          namespace: flagger
      - name: "qa team Discord"
        severity: warn
        providerRef:
          name: qa-discord
Explanation for Key Fields
provider: Specifies the service mesh provider like istio, linkerd, etc.targetRef: Refers to the primary deployment.autoscalerRef: Associates the canary with an HPA for automated scaling.- analysis: Defines the testing strategy:
interval: Time between each traffic increment.threshold: Number of failed checks before rollback.maxWeight: Maximum traffic percentage shifted to the canary.stepWeight: Traffic increment step size.
metrics: Specifies the Prometheus metrics template used for success criteria.webhooks: Executes external tests (e.g., load tests) before promotion.alerts: Defines alert triggers for services like Slack, Discord, or Teams.
Use Case: Feature Rollout for a Shopping Cart System
Imagine a shopping cart application where new checkout logic needs to be tested. Using Flagger's canary strategy, you can gradually introduce the new checkout flow while ensuring stability by monitoring metrics like order success rates and latency.
Progressive Traffic Shifting Diagram
Flow of Progressive Traffic Shifting in Flagger
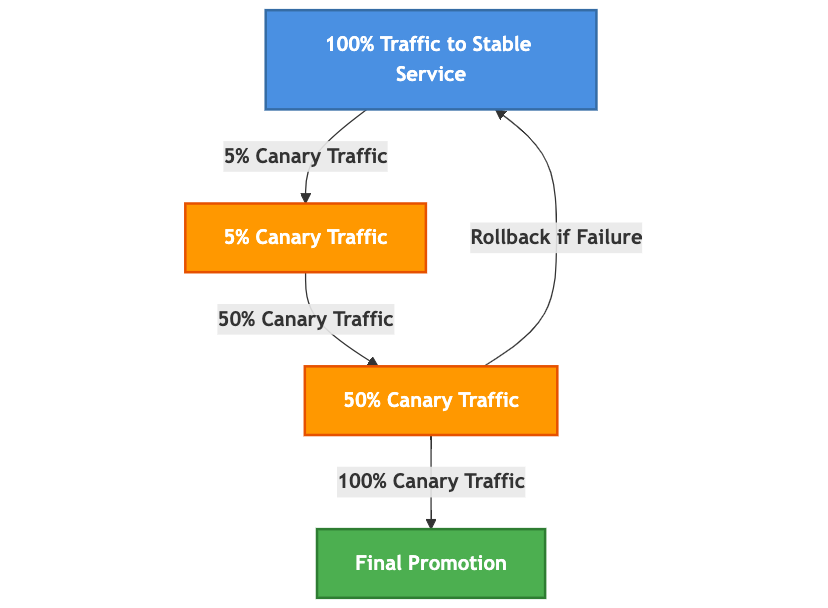
This diagram visualizes the progressive traffic shifting strategy where traffic gradually shifts from the stable version to the canary version, ensuring safe rollouts.
Explanation: Flagger gradually shifts traffic from the stable version to the canary version. If the canary deployment meets performance goals (e.g., latency, success rate), traffic continues to increase until full promotion. If metrics exceed failure thresholds, Flagger automatically rolls back the canary deployment.
Best Practices for Webhook Failure Handling
To ensure resilience during webhook failures, follow these practices:
- Implement Retries with Backoff: Configure
webhooksto retry failed requests with exponential backoff to reduce unnecessary load during transient failures. - Introduce Timeout Limits: Add timeouts for
webhookresponses to avoid delays in canary promotions. - Implement Fallback Alerts: If a
webhookfails after multiple retries, configure an alert system to notify developers immediately (e.g., Slack, PagerDuty). - Add Webhook Health Checks: Periodically test
webhookendpoints to proactively detect and fix issues before deployment failures occur.
Metric Template Configuration
Flagger can integrate custom metrics to enhance decision-making for progressive delivery.
This diagram shows how Prometheus metrics are evaluated by Flagger to determine the success or failure of a canary rollout.
Example Custom Metric Configuration for Flagger
apiVersion: flagger.app/v1beta1
kind: MetricTemplate
metadata:
  name: checkout-failure-rate
  namespace: istio-system
spec:
  provider:
    type: prometheus
    address: http://prometheus.istio-system:9090
  query: |
    100 - sum(
        rate(
            istio_requests_total{
              reporter="destination",
              destination_workload_namespace="{{ namespace }}",
              destination_workload="{{ target }}",
              response_code!~"5.*"
            }[{{ interval }}]
        )
    )
    /
    sum(
        rate(
            istio_requests_total{
              reporter="destination",
              destination_workload_namespace="{{ namespace }}",
              destination_workload="{{ target }}",
            }[{{ interval }}]
        )
    ) * 100
Explanation: This calculates the percentage of successful requests by filtering out 5xx response codes. Uses Prometheus as the backend to fetch metric data.
Enhancing Metric Templates With Custom Prometheus Queries
To improve Flagger’s decision-making capabilities, consider creating advanced Prometheus queries for custom metrics.
Example Custom Prometheus Query for API Latency Analysis:
apiVersion: flagger.app/v1beta1
kind: MetricTemplate
metadata:
  name: api-latency-threshold
  namespace: istio-system
spec:
  provider:
    type: prometheus
    address: http://prometheus.istio-system:9090
  query: |
    histogram_quantile(0.95, sum(rate(http_request_duration_seconds_bucket{job="api-service"}[5m])) by (le))
Explanation: This query measures 95th percentile latency for the api-service application. By tracking latency distribution instead of simple averages, developers can detect spikes in performance degradation early. Use these insights to tune your Flagger analysis steps and improve deployment safety.
Best Practices for Flagger Integration
- Design Small Increments for Safer Rollouts: Gradual traffic shifting minimizes risk.
- Leverage
Webhooksfor Automated Testing:Webhooks allow for extensive testing before promoting changes. - Use Custom Metrics for Better Insights: Track business-critical metrics that directly impact performance.
- Ensure Clear Alerting Channels: Slack, Discord, or Teams notifications help teams act quickly during failures.
- Integrate Load Testing: Automated load tests during canary releases validate stability before promotion.
Step 4: Custom Metrics for Developers
Why Use Custom Metrics?
Custom metrics provide actionable insights by tracking application-specific behaviors such as checkout success rates, queue sizes, or memory usage. By aligning metrics with business objectives, developers gain deeper insights into their system's performance.
- Monitor User Experience: Track latency, response times, or page load speeds.
- Measure Application Health: Observe error rates, service availability, or queue backlogs.
- Track Business Outcomes: Monitor KPIs like orders, logins, or transaction success rates.
By incorporating these insights into metrics, developers can improve troubleshooting, identify performance bottlenecks, and correlate application issues with user experience impacts.
Custom Metrics Configuration
Developers can integrate custom metrics into their applications using libraries like Micrometer (Java) or Prometheus Client (Node.js).
Java Example - Custom Metrics With Micrometer
Dependencies in pom.xml
<dependency>
    <groupId>io.micrometer</groupId>
    <artifactId>micrometer-registry-prometheus</artifactId>
    <version>1.9.0</version>
</dependency>
Configuration in Code
@Configuration
public class MetricsConfig {
    @Bean
    public MeterRegistry meterRegistry() {
        return new PrometheusMeterRegistry(PrometheusConfig.DEFAULT);
    }
    @Bean
    public RestTemplate restTemplate() {
        return new RestTemplate();
    }
}
Custom Metric Example
@RestController
@RequestMapping("/api")
public class OrderController {
    private final Counter orderCounter;
    public OrderController(MeterRegistry meterRegistry) {
        this.orderCounter = Counter.builder("orders_total")
                .description("Total number of orders processed")
                .register(meterRegistry);
    }
    @PostMapping("/order")
    public ResponseEntity<String> createOrder(@RequestBody Map<String, String> request) {
        orderCounter.increment();
        return ResponseEntity.ok("Order Created");
    }
}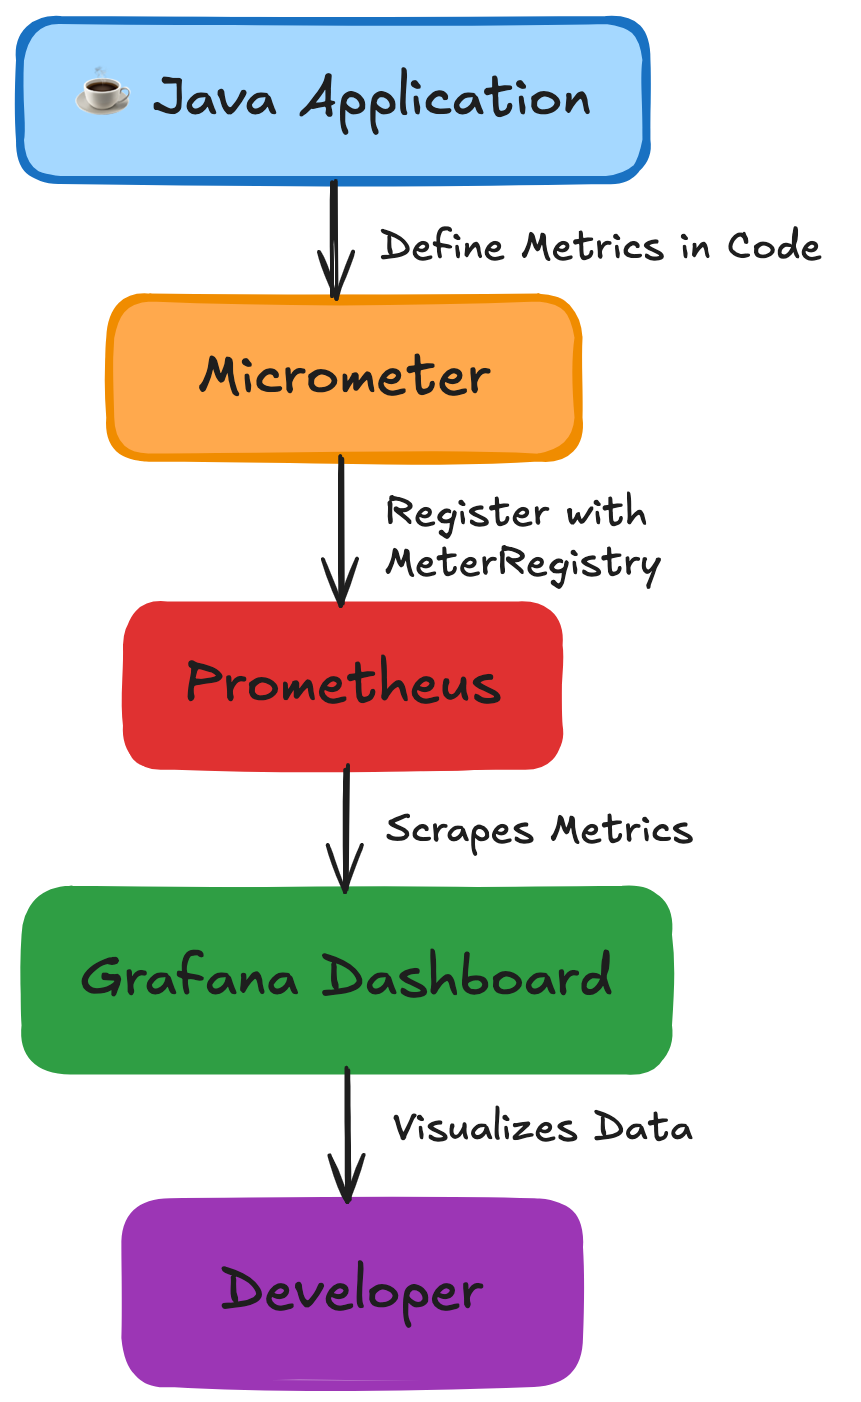
This diagram illustrates the flow of custom metrics in a Java application using Micrometer, where data is defined in code, registered with MeterRegistry, and visualized through Grafana.
Node.js Example - Custom Metrics With Prometheus Client
Dependencies installation: npm install prom-client
Configuration in Code:
const express = require('express');
const client = require('prom-client');
const app = express();
const collectDefaultMetrics = client.collectDefaultMetrics;
collectDefaultMetrics();
const orderCounter = new client.Counter({
    name: 'orders_total',
    help: 'Total number of orders processed'
});
app.post('/order', (req, res) => {
    orderCounter.inc();
    res.send('Order Created');
});
app.get('/metrics', async (req, res) => {
    res.set('Content-Type', client.register.contentType);
    res.end(await client.register.metrics());
});
app.listen(3000, () => console.log('Server running on port 3000'));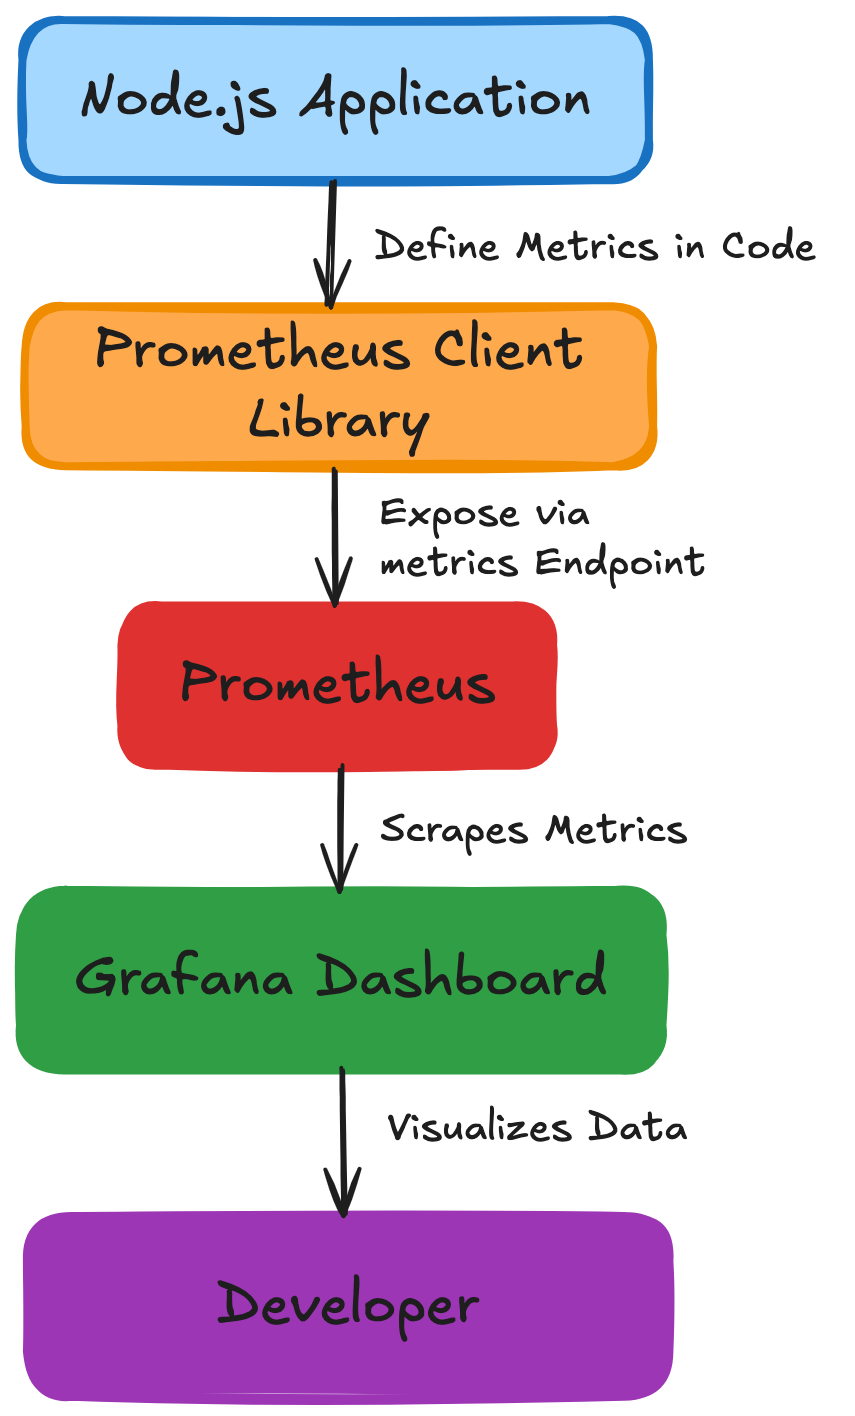
This diagram demonstrates how custom metrics flow in a Node.js application using the Prometheus Client library, exposing data via /metrics endpoints for visualization in Grafana.
Enhancing the Java Micrometer Example
1. Adding Histogram for Latency Tracking
import io.micrometer.core.instrument.Timer;
import org.springframework.web.bind.annotation.*;
import io.micrometer.core.instrument.MeterRegistry;
@RestController
@RequestMapping("/api")
public class LatencyController {
    private final Timer requestTimer;
    public LatencyController(MeterRegistry meterRegistry) {
        this.requestTimer = Timer.builder("http_request_latency")
            .description("Tracks HTTP request latency in milliseconds")
            .publishPercentileHistogram()
            .register(meterRegistry);
    }
    @GetMapping("/process")
    public ResponseEntity<String> processRequest() {
        return requestTimer.record(() -> {
            try { Thread.sleep(200); } catch (InterruptedException e) {}
            return ResponseEntity.ok("Request Processed");
        });
    }
}
2. Adding Gauge for System-Level Metrics
import io.micrometer.core.instrument.Gauge;
import io.micrometer.core.instrument.MeterRegistry;
import org.springframework.stereotype.Component;
import java.util.concurrent.atomic.AtomicInteger;
@Component
public class QueueSizeMetric {
    private final AtomicInteger queueSize = new AtomicInteger(0);
    public QueueSizeMetric(MeterRegistry meterRegistry) {
        Gauge.builder("queue_size", queueSize::get)
            .description("Tracks the current size of the task queue")
            .register(meterRegistry);
    }
    public void addToQueue() {
        queueSize.incrementAndGet();
    }
    public void removeFromQueue() {
        queueSize.decrementAndGet();
    }
}
Enhancing Node.js Example With Labeling Best Practices
Recommended Labeling Practices:
- Use Meaningful Labels: Focus on key factors like
status_code,endpoint, or region. - Minimize High-Cardinality Labels: Avoid labels with unique values like user_id or
transaction_id. - Use Consistent Naming Conventions: Maintain uniform patterns across your metrics.
Improved Node.js Metric Example:
const client = require('prom-client');
const requestCounter = new client.Counter({
    name: 'http_requests_total',
    help: 'Total HTTP requests processed',
    labelNames: ['method', 'endpoint', 'status_code']
});
app.get('/checkout', (req, res) => {
    requestCounter.inc({ method: 'GET', endpoint: '/checkout', status_code: 200 });
    res.send('Checkout Complete');
});
Integration With Flagger - Business-Critical Metrics Example
Example Prometheus Query for Checkout Failure Tracking:
apiVersion: flagger.app/v1beta1
kind: MetricTemplate
metadata:
  name: checkout-failure-rate
  namespace: istio-system
spec:
  provider:
    type: prometheus
    address: http://prometheus.istio-system:9090
  query: |
    sum(rate(http_requests_total{job="checkout-service", status_code!="200"}[5m])) /
    sum(rate(http_requests_total{job="checkout-service"}[5m])) * 100
Explanation:
- This metric tracks the percentage of failed checkout attempts, a key indicator for e-commerce stability.
- Tracking these business-critical metrics can provide developers with actionable insights to improve customer experience.
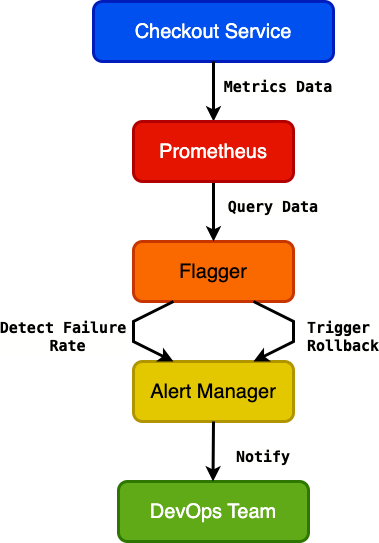
This diagram illustrates how Flagger monitors Prometheus metrics for the checkout service, triggering rollbacks via Alert Manager and notifying the DevOps team in case of failures.
Alerting Best Practices for Custom Metrics
- Define meaningful alert thresholds that align with business impact.
- Suppress excessive alerts by fine-tuning alert duration windows.
- Use
Prometheus AlertManagerto send proactive alerts for degraded service performance.
Conclusion
Achieving comprehensive observability in Kubernetes environments is challenging yet essential for ensuring application performance, security, and stability. By adopting the right tools and best practices, developers can significantly enhance visibility across their microservices landscape.
Tracestoreenables developers to trace requests across services, improving root cause analysis and identifying performance bottlenecks.OPAenforces dynamic policy controls, enhancing security by ensuring consistent access management and protecting data integrity.Flaggerautomates progressive delivery, reducing deployment risks with controlled traffic shifting, metric-based evaluations, and proactive rollbacks.- Custom Metrics provides actionable insights by tracking key application behaviors, aligning performance monitoring with business objectives.
By combining these tools, developers can build resilient, scalable, and secure Kubernetes workloads. Following best practices such as efficient trace propagation, thoughtful Rego policy design, strategic Flagger configurations, and well-defined custom metrics ensures your Kubernetes environment can meet performance demands and evolving business goals.
Embracing these observability solutions allows developers to move from reactive troubleshooting to proactive optimization, fostering a culture of reliability and improved user experience.
References
- Documentation. (n.d.). OpenTelemetry. https://opentelemetry.io/docs/
- Open-Telemetry. (n.d.). GitHub - open-telemetry/opentelemetry-java: OpenTelemetry Java SDK. GitHub. https://github.com/open-telemetry/opentelemetry-java
- Open-Telemetry. (n.d.-b). GitHub - open-telemetry/opentelemetry-js: OpenTelemetry JavaScript Client. GitHub. https://github.com/open-telemetry/opentelemetry-js
- Introduction | Open Policy Agent. (n.d.). https://www.openpolicyagent.org/docs/latest/
- Overview & Architecture | Open Policy Agent. (n.d.). https://www.openpolicyagent.org/docs/latest/kubernetes-introduction/
- Policy language | Open Policy Agent. (n.d.). https://www.openpolicyagent.org/docs/latest/policy-language/
- Introduction | Flagger. (n.d.). https://docs.flagger.app/
- ISTIO Canary Deployments | Flagger. (n.d.). https://docs.flagger.app/usage/progressive-delivery
- Overview | Prometheus. (n.d.). https://prometheus.io/docs/
- Micrometer Application Observability. (n.d.). https://micrometer.io/docs/
- Technical documentation | Grafana Labs. (n.d.). Grafana Labs. https://grafana.com/docs
- Kubernetes documentation. (n.d.-b). Kubernetes. https://kubernetes.io/docs/
- Cncf. (n.d.). GitHub - cncf/tag-observability: Technical Advisory Group for Observability. GitHub. https://github.com/cncf/tag-observability
Published at DZone with permission of Prabhu Chinnasamy. See the original article here.
Opinions expressed by DZone contributors are their own.
Comments