Client-Side Perf Testing Using Lighthouse CI With Puppeteer
Take a look at client-side performance testing using Lighthouse CI with Puppeteer.
Join the DZone community and get the full member experience.
Join For FreeWhenever we need to do performance testing, mostly it is the APIs that come to mind.
Testing the performance of an application by putting load on APIs or on servers and checking out various metrics or parameters falls under server-side performance testing.
However, many times, a situation comes when a client or we ourselves want to test how this load on APIs impacts the rendering of GUI elements on a webpage or will this load impact any user interaction on our webpage. Testing this is known as client-side performance testing.
There are many tools in the market that combine both server-side and client-side performance testing together. However generally many open source perf testing tools do server-side perf testing only.
In this article, I am assuming that server-side perf testing is already done or code has already been written and ready to be executed.
So since we have already tested our APIs under load conditions, should we think of doing any client-side perf testing?
To answer, it depends upon the requirement. However, I would recommend that even if server-side perf testing has already been done still it is good to do client-side perf testing to gain overall confidence in the performance of the application.
There would be a couple of questions coming to our mind like:
- What exactly to test in client-side perf testing, considering server-side perf testing is already done.
- How to do client-side perf testing?
- Which tools and technologies to use for this?
Let's check out the answers to these questions one by one.
First of all, in client-side perf testing, there are a couple of types of metrics we need to measure when the system is under load:
- Perceived load speed: how quickly a page can load and render all of its visual elements to the screen.
- Load responsiveness: how quickly a page can load and execute any required JavaScript code in order for components to respond quickly to user interaction
- Runtime responsiveness: after page load, how quickly can the page respond to user interaction.
- Visual stability: do elements on the page shift in ways that users don't expect and potentially interfere with their interactions?
- Smoothness: do transitions and animations render at a consistent frame rate and flow fluidly from one state to the next?
Now that we have already tested how servers respond under load [server-side perf testing], while doing client-side perf testing, we can mock our APIs and should delay the response time so as to simulate the loaded condition.
I have used k6 for server-side perf testing and Lighthouse CI with puppeteer for client-side perf testing and used MockServer for stubbing the api response and also delaying the time.
Lighthouse CI is quite a powerful tool to measure various metrics related to client-side perf testing.
Key Points about Lighthouse:
- Lighthouse launches the mentioned url, audit that page, and publishes the report.
- It always clear the caches by default before launching any page.
- It loads the application on chrome browser only.
- It has inherent support to puppeteer.
- In reports, it provides information about the improvements as well so that the dev team can have a look ad improvise the code.
For my application, I have used the combination of Lighthouse CI and Puppeteer.
Role of Puppeteer, here is to do the login and then pass control to lighthouse CI for auditing the webpages wherein we have already mocked the APIs response and the response time.
For demo purposes, I have used this website - TutorialNinja as it also has an authentication.
Now let's begin with setting up the code by checking out the below steps:
Prerequisites - Node.js and npm needs to be installed on the machine.
Step 1: Create an empty directory.
Step 2: cd into the above directory and run npm init -y.
Step 3: Run below 2 commands to add Lighthouse CI and Puppeteer dependencies.
npm install --D @lhci/cli
npm install --D puppeteer
Step 4: Open any editor of choice. I have used Intelli J and load this repository.
Step 5: Our package.json file will look like this:
{
  "name": "lighthouseci-puppeteer",
  "version": "1.0.0",
  "description": "",
  "main": "index.js",
  "scripts": {
    "audit": "npx lhci autorun"
  },
  "keywords": [],
  "author": "",
  "license": "ISC",
  "devDependencies": {
    "@lhci/cli": "^0.7.2",
    "dotenv": "^9.0.2",
    "puppeteer": "^9.1.1"
  }
}
Step 6: In the root of the project, create 1 file as lighthouserc.js with the below content. This file has all the key configurations for Lighthouse CI.
module.exports = {
    ci: {
        collect: {
            puppeteerScript: './puppeteerScript.js',
            puppeteerLaunchOptions: {args: ['--allow-no-sandbox-job', '--allow-sandbox-debugging', '--no-sandbox', '--disable-gpu', '--disable-gpu-sandbox', '--display']}, //https://www.puppeteersharp.com/api/PuppeteerSharp.LaunchOptions.html
            numberOfRuns: 1,
            disableStorageReset: true,
            settings: {
                // Don't clear localStorage/IndexedDB/etc before loading the page.
                "disableStorageReset": true,
                // Wait up to 60s for the page to load
                "maxWaitForLoad": 60000,
                // Use applied throttling instead of simulated throttling
                "throttlingMethod": "devtools"
            },
            url: ['http://tutorialsninja.com/demo/index.php?route=account/account', 'http://tutorialsninja.com/demo/index.php?route=product/category&path=20', 'http://tutorialsninja.com/demo/index.php?route=checkout/cart']
        },
        upload: {
            target: 'filesystem',
            outputDir: './lhci_reports',
            reportFilenamePattern: '%%PATHNAME%%-%%DATETIME%%-report.%%EXTENSION%%'
            // token: '',
            // serverBaseUrl: ''
        },
        assert: {
            "assertions": {
                "categories:performance": ["error", {"minScore": 1}],
                "categories:accessibility": ["error", {"minScore": 1}],
                "categories:best-practices": ["error", {"minScore": 1}],
                "categories:seo": ["error", {"minScore": 1}]
            }
        },
    },
};- "puppeteerScript" - path of the test script written using puppeteer.
- "puppeteerLaunchOptions" - options which support puppeteer script to run.
- "numberOfRuns" - how many times we want Lighthouse CI to audit every page.
- "disableStorageReset" - By default lighthouse clears all the caches, however if we want to store the caches then this option needs to be set to true.
- "url" - list of all the urls on which we want to run lighthouse.
- "upload > target" - how we want to load the test reports. This can be temporary-public-storage or filesystem or lhci. In case of filesystem below options need to be provided.
- "outputDir" - path of the folder where we want to store the reports. Lighthouse create reports in html and .json format for every page.
- "reportFilenamePattern" - this specify naming of the generated report.
I have used filesystem here, for now. But will update the steps to run in lhci as well.
- "assert > assertions" - to assert if the metrics which lighthouse is generating are within our required thresholds or not.
We need to figure out the benchmarks and then apply them here. In my case, i have triggered the test pipeline for 5 times and then used mean value as benchmarks.
Step 7: In the root of the project, create 1 more file as puppeteerScript.js as below:
/**
 * @param {puppeteer.Browser} browser
 * @param {{url: string, options: LHCI.CollectCommand.Options}} context
 */

let counter = 1;

const selector = {
    class(attribute, className){
        return `${attribute}[class='${className}']`
    },
    type(attribute, value){
        return `${attribute}[type='${value}']`
    },
    id(value){
        return `#${value}`
    }
}

async function doLogin(page) {
    const loginUrl = 'http://tutorialsninja.com/demo/index.php?route=account/login'
    await page.waitForTimeout(2000)
    await page.goto(loginUrl);
    await page.type(selector.id('input-email'), '[email protected]');
    await page.type(selector.id('input-password'), 'Mypassword@08');
    console.log(`Entered user credentials`)
    await page.click(selector.type('input', 'submit'));
    console.log(`Login is successful`)
}

async function setup(browser, context) {
    // launch browser for LHCI
    const page = await browser.newPage();
    await page.setCacheEnabled(true)

    if(counter===1){
        await doLogin(page)
    }
    else{
        await page.goto(context.url);
    }
    // close session for next run
    await page.close();
    counter++
}

module.exports = setup- As per above code logic, we have ensured that login should happen once by means of a counter.
- Important to note that the main function in a puppeteer script should definitely be exported.
- When we use "puppeteerScript" option in lighthouserc.js file then Lighthouse will follow the below path: [LHCI - Lighthouse CI]
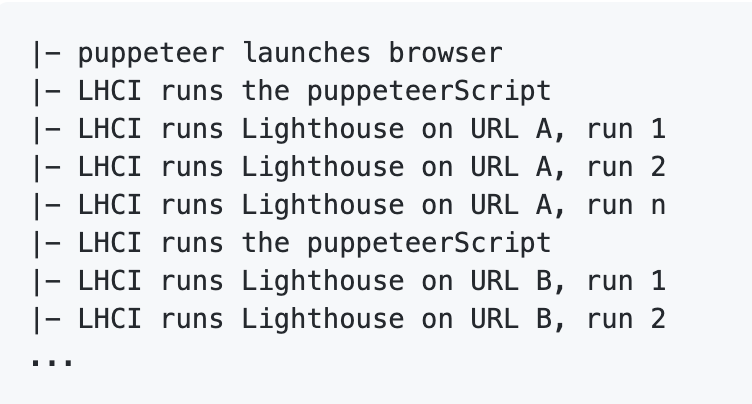
- As per the above flow, lighthouse will audit all the urls mentioned in lighthouserc.js file 1 by 1 and generate 2 reports (.html and .json) for all the pages.
Step 8: Let us run the code using below command
npm run auditStep 9: Lighthouse will start the run and once it is done reports gets generated in a folder as lhci-reports (as we have pass this folder name) within the root of the repo.
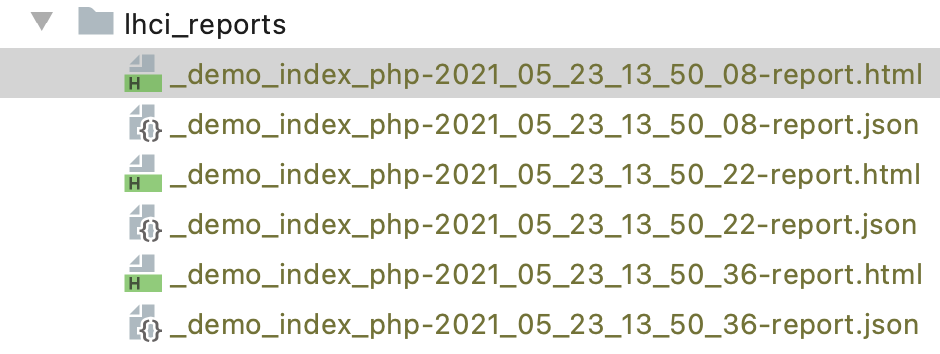
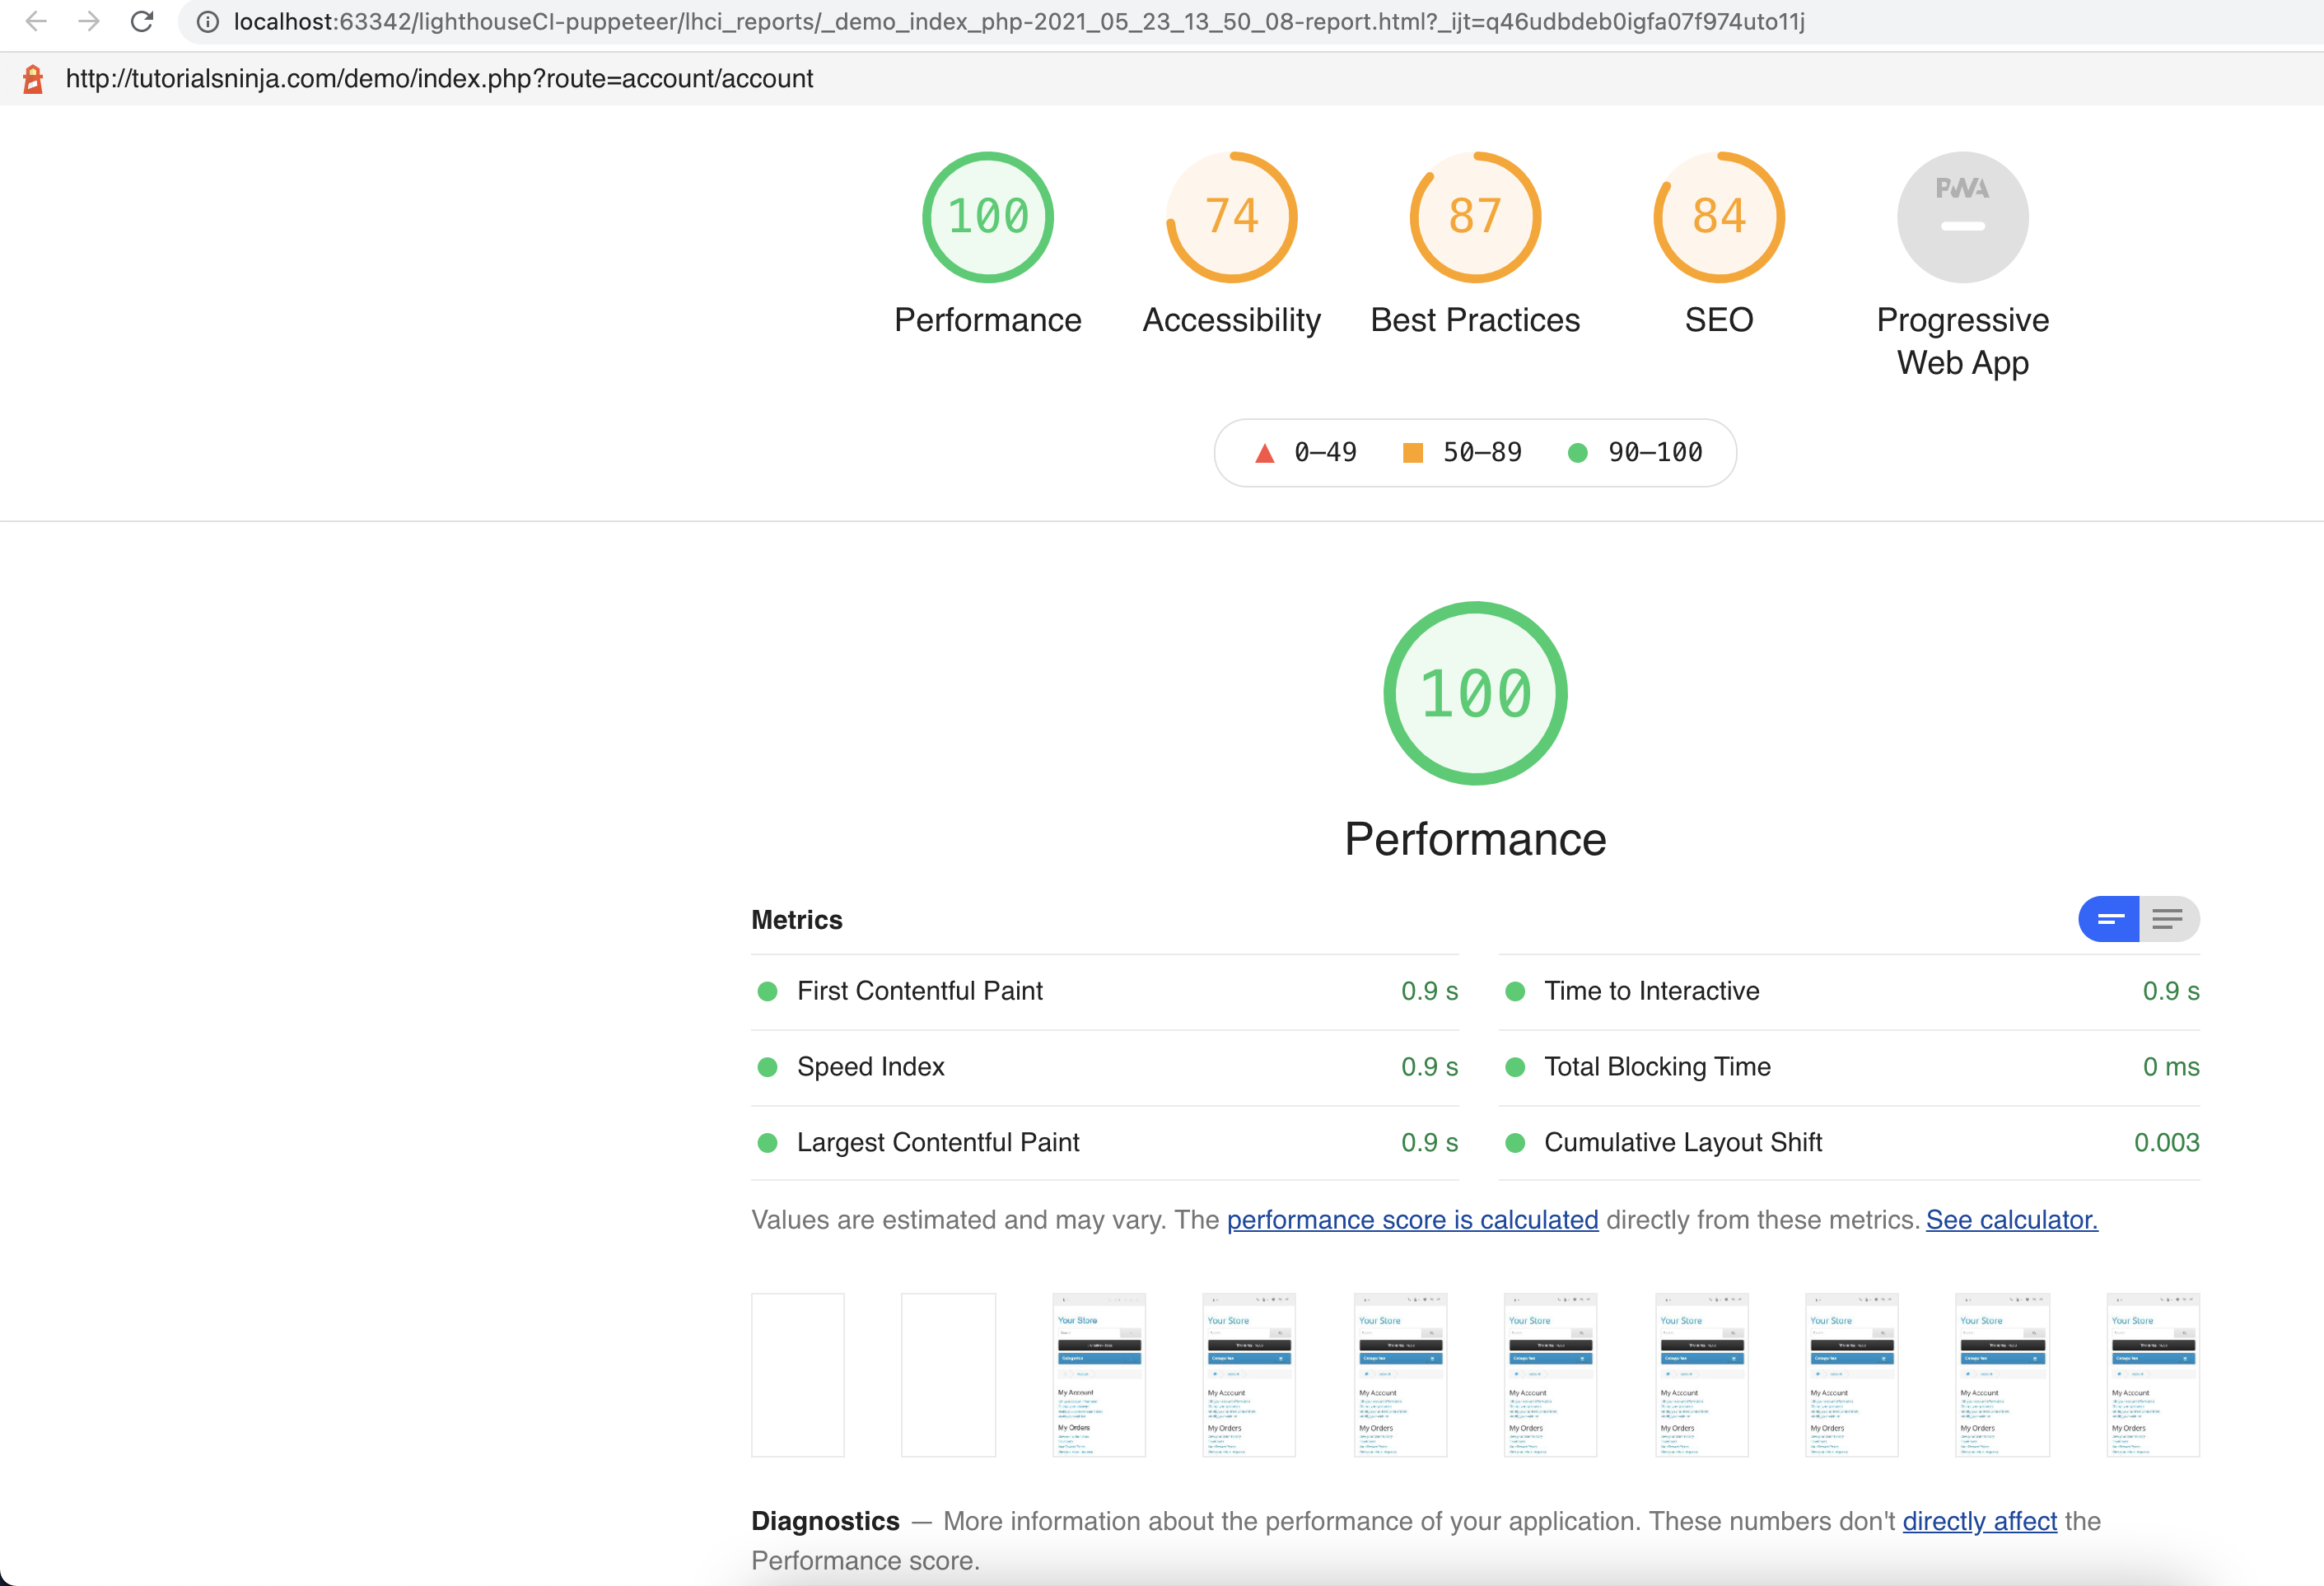
Lighthouse HTML reports look something like:
Lighthouse to Compare the Builds
Since Lighthouse is auditing various pages, it is advisable that this tool should be closer to the application source code and should be coupled to our build pipelines so that it can provide early feedback to check if any code push has degraded the performance or upgraded it.
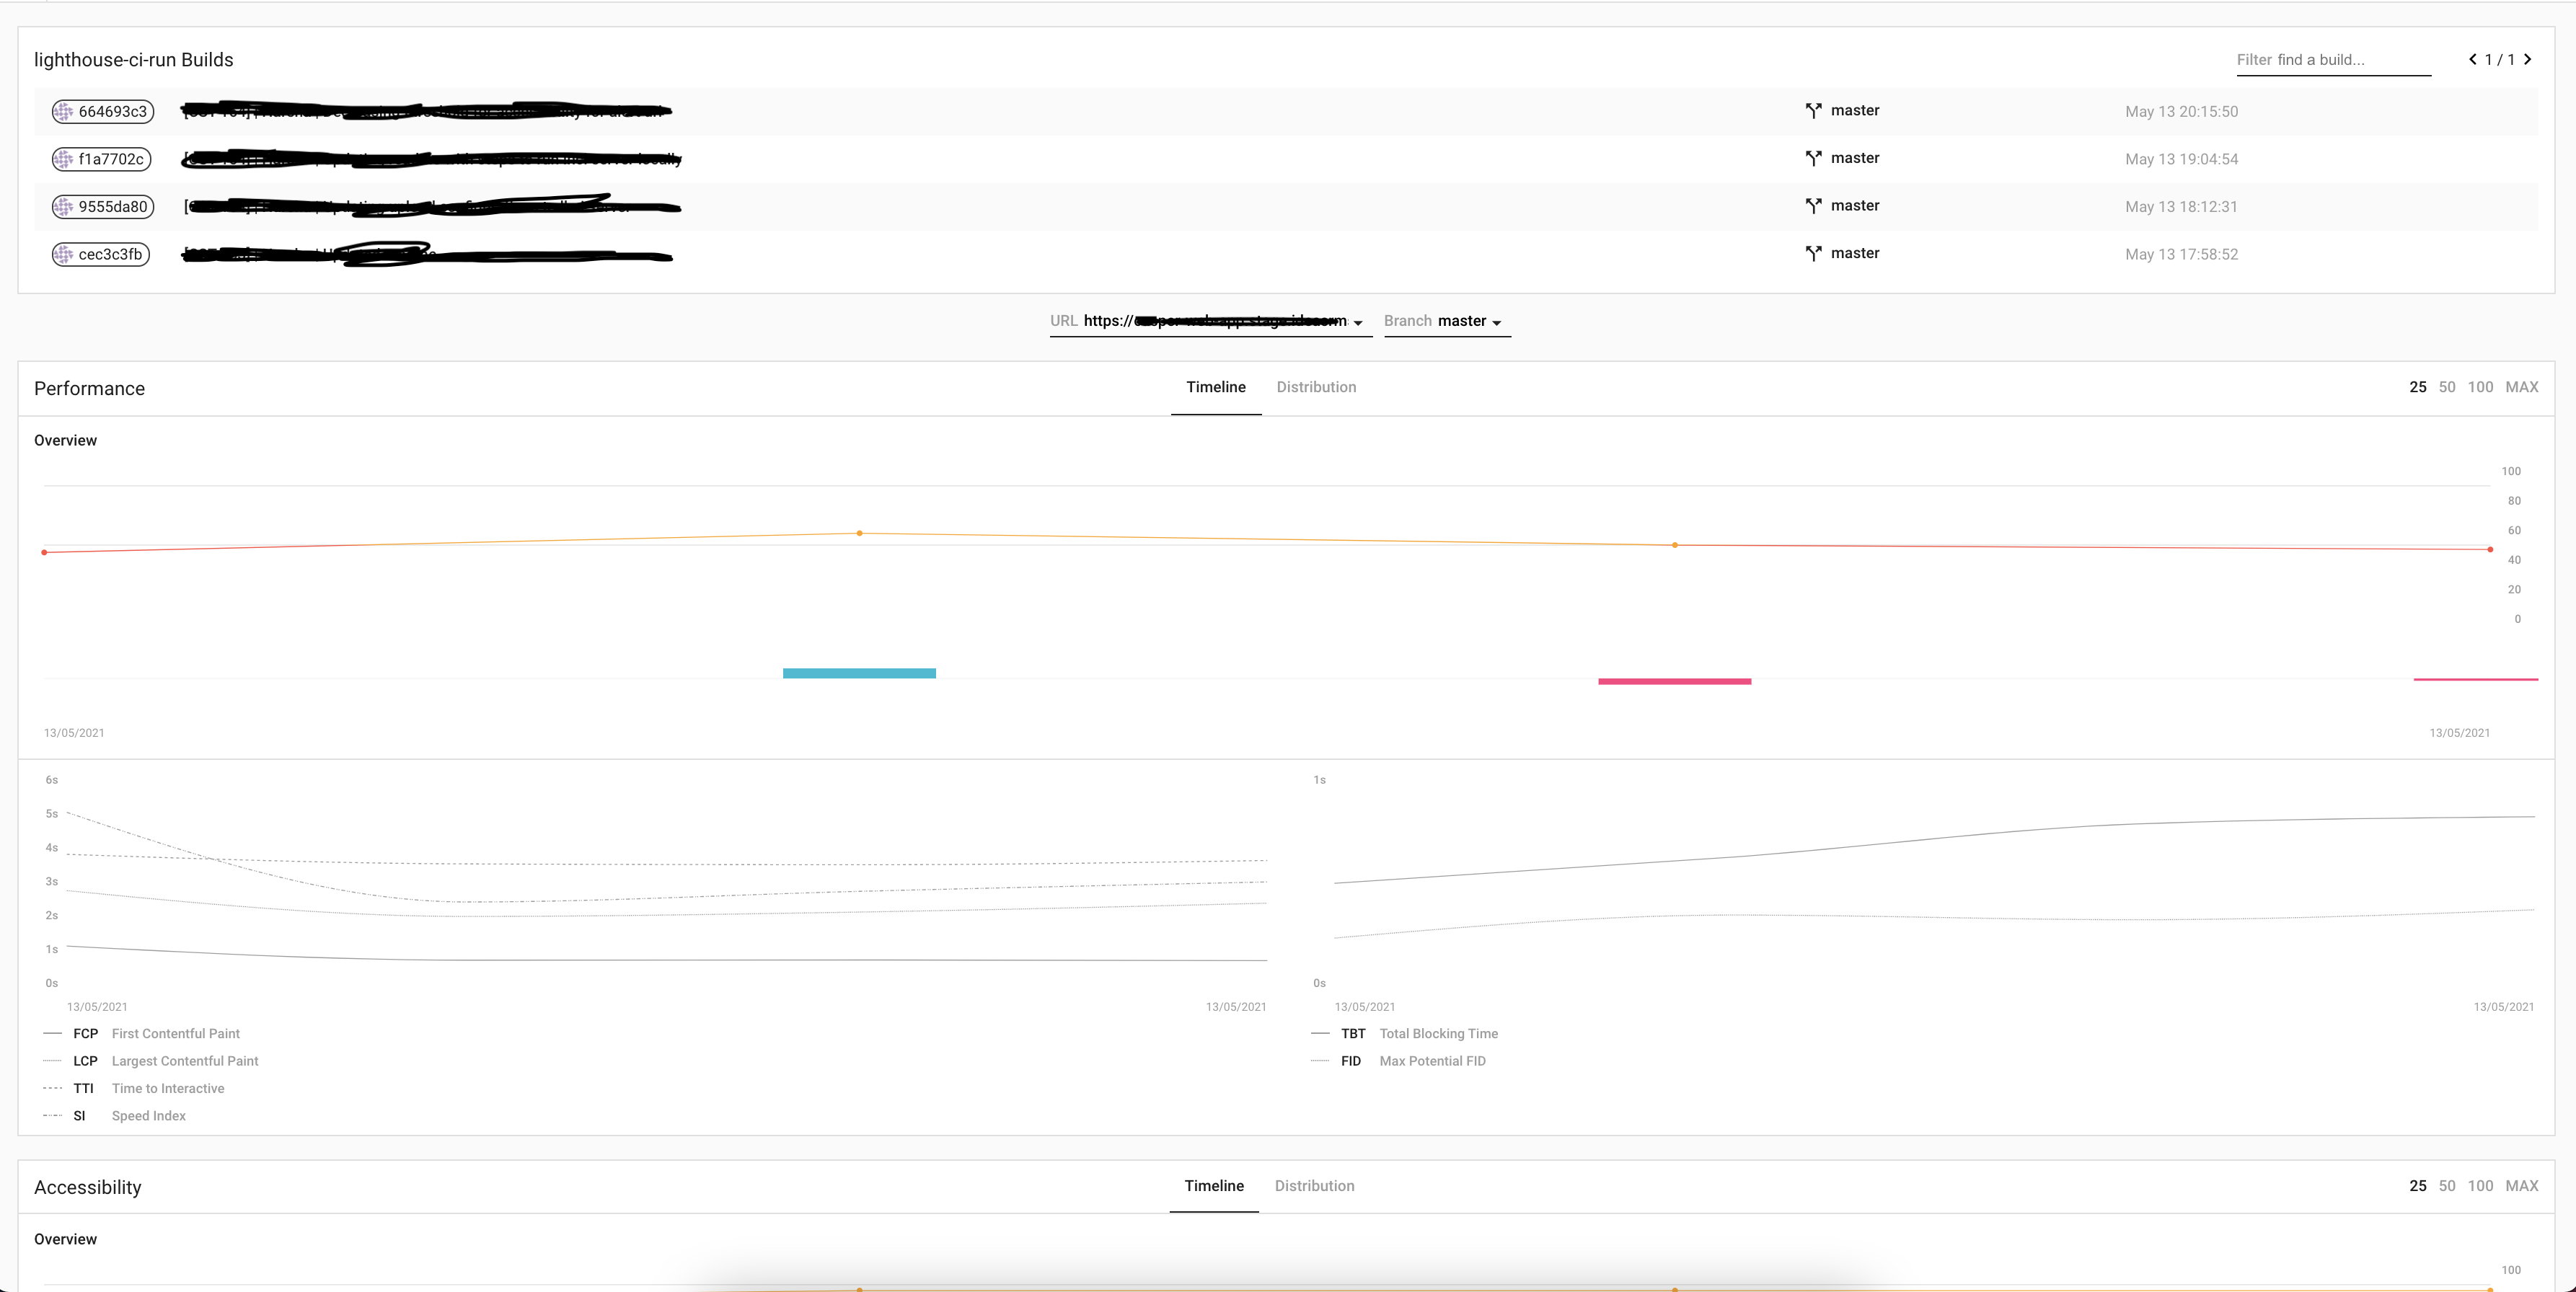
Here comes the role of an lhci in which we run lighthouse as usual but upload the reports to a server so that we can get a comparative view between the commits.
As per Lighthouse CI documentation, there are 3 ways to achieve it https://github.com/GoogleChrome/lighthouse-ci/blob/main/docs/server.md#deployment
I have used both Heroku and Docker for this, however mentioning Docker steps here:
- Start docker demon
- Create a docker-compose.yaml file inside lighthouse folder with below content:
```
version: '3'
services:
  lhserver:
    image: patrickhulce/lhci-server
    ports:
      - '9001:9001'
    volumes:
      - lhci-data:/data
volumes:
  lhci-data:
```
- Run command as `docker-compose up -d`
- Open browser and launch a url as `localhost:9001`. Ensure that no other process should run on this port. Else one should replace the port number in docker-compose file.
- Open terminal window.
- Run below set of commands:
```
$ lhci wizard
? Which wizard do you want to run? new-project
? What is the URL of your LHCI server? http://localhost:9001/
? What would you like to name the project? lighthouse-ci
Where is the project's code hosted? <give the github url>
```
- Output would be something like below:
```
Created project lighthouse-ci (XXXXXXXX-XXXX-XXXX-XXXX-XXXXXXXXXXXX)!
Use build token XXXXXXXX-XXXX-XXXX-XXXX-XXXXXXXXXXXX to connect.
Use admin token XXXXXXXXXXXXXXXXXXXXXXXXXXXXXXXX to manage the project.
```
- Open `lighthouserc.js` file.
- Replace upload object as below:
```
upload: {
            target: 'lhci',
            token: '<value-of-the-build-token-obtained-from-above-output>',
            ignoreDuplicateBuildFailure: true,
            serverBaseUrl:'http://localhost:9001/'
        },
```
After following the above steps and code changes in the upload block in lighthouserc.js file, run the tests again.
Navigate to localserver.
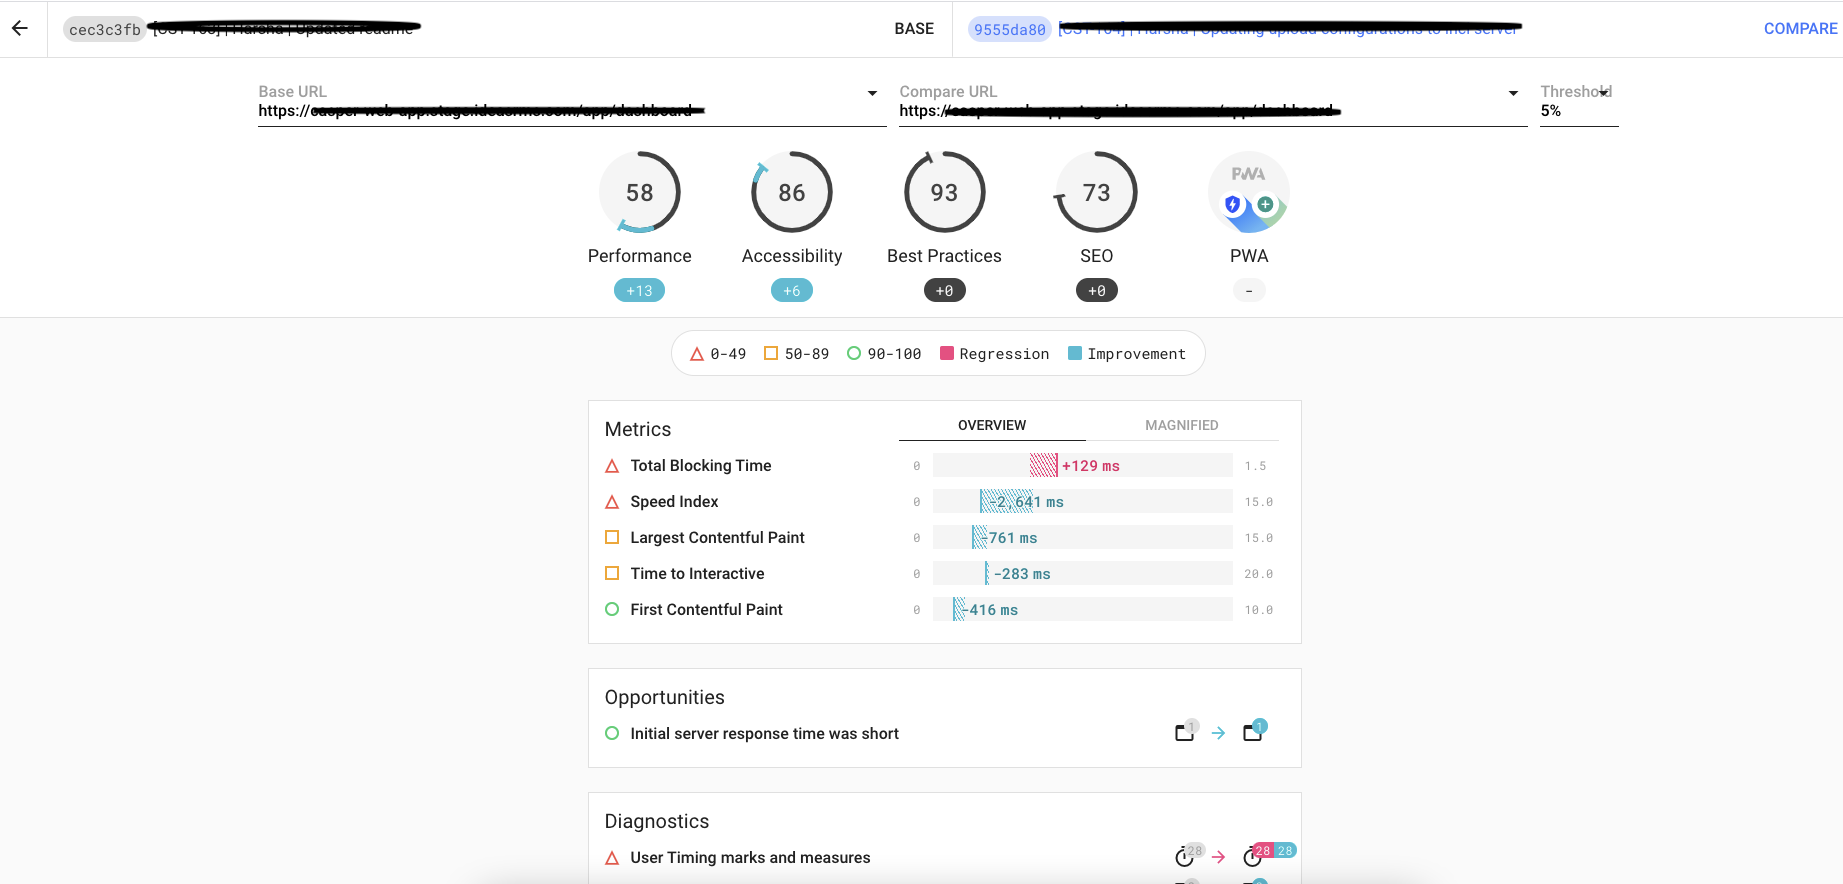
The reports on the server look something like:
We can integrate this source code with any of the below CICD tools. I have used bitbucket personal server for this.
- GitHub Actions
- Travis CI
- Bitbucket - use the base image as : lys623/puppeteer-chrome-linux:latest
- Circle CI
- Gitlab CI
- Jenkins
- Google Cloudbuild
Hope this article is helpful!
Opinions expressed by DZone contributors are their own.
Comments