DZone
Thanks for visiting DZone today,
Edit Profile
  • Manage Email Subscriptions
  • How to Post to DZone
  • Article Submission Guidelines
Sign Out View Profile
  • Post an Article
  • Manage My Drafts
Over 2 million developers have joined DZone.
Log In / Join
Refcards Trend Reports
Events Video Library
Over 2 million developers have joined DZone. Join Today! Thanks for visiting DZone today,
Edit Profile Manage Email Subscriptions Moderation Admin Console How to Post to DZone Article Submission Guidelines
View Profile
Sign Out
Refcards
Trend Reports
Events
View Events Video Library
Zones
Culture and Methodologies Agile Career Development Methodologies Team Management
Data Engineering AI/ML Big Data Data Databases IoT
Software Design and Architecture Cloud Architecture Containers Integration Microservices Performance Security
Coding Frameworks Java JavaScript Languages Tools
Testing, Deployment, and Maintenance Deployment DevOps and CI/CD Maintenance Monitoring and Observability Testing, Tools, and Frameworks
Culture and Methodologies
Agile Career Development Methodologies Team Management
Data Engineering
AI/ML Big Data Data Databases IoT
Software Design and Architecture
Cloud Architecture Containers Integration Microservices Performance Security
Coding
Frameworks Java JavaScript Languages Tools
Testing, Deployment, and Maintenance
Deployment DevOps and CI/CD Maintenance Monitoring and Observability Testing, Tools, and Frameworks

Integrating PostgreSQL Databases with ANF: Join this workshop to learn how to create a PostgreSQL server using Instaclustr’s managed service

Mobile Database Essentials: Assess data needs, storage requirements, and more when leveraging databases for cloud and edge applications.

Monitoring and Observability for LLMs: Datadog and Google Cloud discuss how to achieve optimal AI model performance.

Automated Testing: The latest on architecture, TDD, and the benefits of AI and low-code tools.

Related

  • Linear Regression Model
  • Gradient Descent vs Normal Equation for Regression Problems
  • Reversing an Array: An Exploration of Array Manipulation
  • Best Python Libraries for Web Scraping

Trending

  • Time Series Analysis: VAR-Model-As-A-Service Using Flask and MinIO
  • Best GitHub-Like Alternatives for Machine Learning Projects
  • LLMs for Bad Content Detection: Pros and Cons
  • Log Analysis Using grep
  1. DZone
  2. Data Engineering
  3. Data
  4. Linear Regression Using Python scikit-learn

Linear Regression Using Python scikit-learn

Let's say you have some people's height and weight data. Can you use it to predict other people's weight? Find out using Python scikit-learn.

Vinay Kumar user avatar by
Vinay Kumar
·
Nov. 14, 17 · Tutorial
Like (6)
Save
Tweet
Share
23.62K Views

Join the DZone community and get the full member experience.

Join For Free

In this article, I am going to explain how to use scikit-learn/sk-learn, a machine learning package in Python, to do linear regression for a set of data points.

Below is a video tutorial on this:

 I am not going to explain training data, testing data, and model evaluation concepts here, but they are important.

We know that the equation of a line is given by y=mx+b, where m is the slope and b is the intercept.

Our goal is to find the best values of slope (m) and intercept (b) to fit our data.

Linear regression uses the ordinary least squares method to fit our data points.

import statement:

from sklearn import linear_model

I have the height and weight data of some people. Let's use this data to do linear regression and try to predict the weight of other people.

height=[[4.0],[4.5],[5.0],[5.2],[5.4],[5.8],[6.1],[6.2],[6.4],[6.8]]
weight=[  42 ,  44 , 49, 55  , 53  , 58   , 60  , 64  ,  66 ,  69]

print("height weight")
for row in zip(height, weight):
    print(row[0][0],"->",row[1])

Output:

height weight
4.0 -> 42
4.5 -> 44
5.0 -> 49
5.2 -> 55
5.4 -> 53
5.8 -> 58
6.1 -> 60
6.2 -> 64
6.4 -> 66
6.8 -> 69

import statement to plot graph using matplotlib:
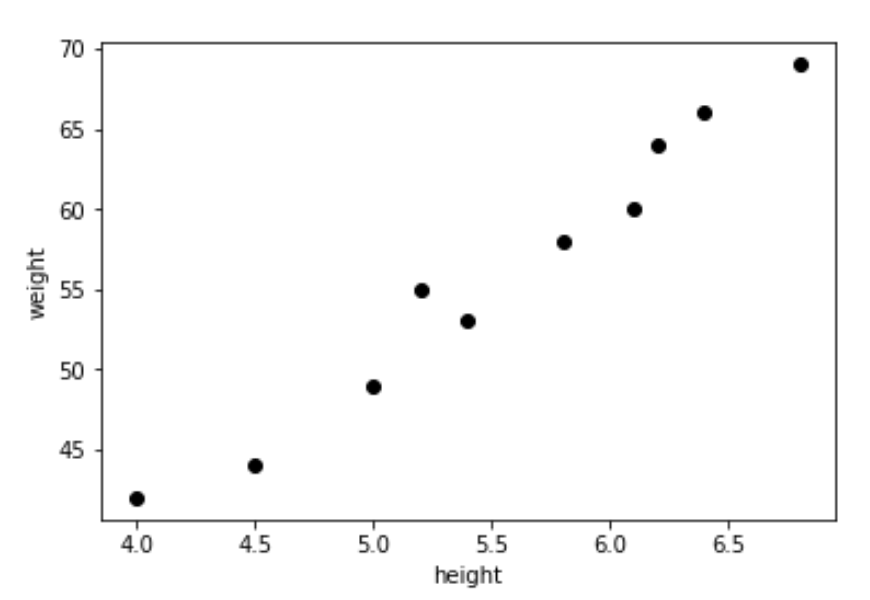
import matplotlib.pyplot as plt

Plotting the height and weight data:

plt.scatter(height,weight,color='black')
plt.xlabel("height")
plt.ylabel("weight")

Output:

Image title

Declaring the linear regression function and call the fit method to learn from data:

reg=linear_model.LinearRegression()
reg.fit(height,weight)

Slope and intercept:

m=reg.coef_[0]
b=reg.intercept_
print("slope=",m, "intercept=",b)

Output:

slope= 10.1936218679 intercept= -0.4726651480
Using the values of slope and intercept to construct the line to fit our data points:
plt.scatter(height,weight,color='black')
predicted_values = [reg.coef_ * i + reg.intercept_ for i in height]
plt.plot(height, predicted_values, 'b')
plt.xlabel("height")
plt.ylabel("weight")
Output:
Image title

And that's it!

Linear regression in python scikit learn | Quick KT

Linear regression Scikit-learn Python (language) Data (computing)

Published at DZone with permission of Vinay Kumar. See the original article here.

Opinions expressed by DZone contributors are their own.

Related

  • Linear Regression Model
  • Gradient Descent vs Normal Equation for Regression Problems
  • Reversing an Array: An Exploration of Array Manipulation
  • Best Python Libraries for Web Scraping

Comments

Partner Resources

X

ABOUT US

  • About DZone
  • Send feedback
  • Careers
  • Sitemap

ADVERTISE

  • Advertise with DZone

CONTRIBUTE ON DZONE

  • Article Submission Guidelines
  • Become a Contributor
  • Visit the Writers' Zone

LEGAL

  • Terms of Service
  • Privacy Policy

CONTACT US

  • 3343 Perimeter Hill Drive
  • Suite 100
  • Nashville, TN 37211
  • support@dzone.com

Let's be friends: