Mastering Prometheus: Unlocking Actionable Insights and Enhanced Monitoring in Kubernetes Environments
This guide offers a comprehensive overview of setting up and utilizing Prometheus for monitoring Kubernetes environments.
Join the DZone community and get the full member experience.
Join For FreeIn the dynamic world of cloud-native technologies, monitoring and observability have become indispensable. Kubernetes, the de-facto orchestration platform, offers scalability and agility. However, managing its health and performance efficiently necessitates a robust monitoring solution. Prometheus, a powerful open-source monitoring system, emerges as a perfect fit for this role, especially when integrated with Kubernetes. This guide outlines a strategic approach to deploying Prometheus in a Kubernetes cluster, leveraging helm for installation, setting up an ingress nginx controller with metrics scraping enabled, and configuring Prometheus alerts to monitor and act upon specific incidents, such as detecting ingress URLs that return 500 errors.
Prometheus
Prometheus excels at providing actionable insights into the health and performance of applications and infrastructure. By collecting and analyzing metrics in real-time, it enables teams to proactively identify and resolve issues before they impact users. For instance, Prometheus can be configured to monitor system resources like CPU, memory usage, and response times, alerting teams to anomalies or thresholds breaches through its powerful alerting rules engine, Alertmanager.
Utilizing PromQL, Prometheus's query language, teams can dive deep into their metrics, uncovering patterns and trends that guide optimization efforts. For example, tracking the rate of HTTP errors or response times can highlight inefficiencies or stability issues within an application, prompting immediate action. Additionally, by integrating Prometheus with visualization tools like Grafana, teams can create dashboards that offer at-a-glance insights into system health, facilitating quick decision-making. Through these capabilities, Prometheus not only monitors systems but also empowers teams with the data-driven insights needed to enhance performance and reliability.
Prerequisites
- Docker and KIND: A Kubernetes cluster set-up utility (Kubernetes IN Docker.)
- Helm, a package manager for Kubernetes, installed.
- Basic understanding of Kubernetes and Prometheus concepts.
1. Setting Up Your Kubernetes Cluster With Kind
Kind allows you to run Kubernetes clusters in Docker containers. It's an excellent tool for development and testing. Ensure you have Docker and Kind installed on your machine. To create a new cluster:
kind create cluster --name prometheus-demoVerify your cluster is up and running:
kubectl cluster-info --context kind-prometheus-demo2. Installing Prometheus Using Helm
Helm simplifies the deployment and management of applications on Kubernetes. We'll use it to install Prometheus:
- Add the Prometheus community Helm chart repository:
helm repo add prometheus-community https://prometheus-community.github.io/helm-charts
helm repo update- Install Prometheus:
helm install prometheus prometheus-community/kube-prometheus-stack --namespace monitoring --create-namespace

helm upgrade prometheus prometheus-community/kube-prometheus-stack \
--namespace monitoring  \
--set prometheus.prometheusSpec.podMonitorSelectorNilUsesHelmValues=false \
--set prometheus.prometheusSpec.serviceMonitorSelectorNilUsesHelmValues=false
This command deploys Prometheus along with Alertmanager, Grafana, and several Kubernetes exporters to gather metrics. Also, customize your installation to scan for service monitors in all the namespaces.
3. Setting Up Ingress Nginx Controller and Enabling Metrics Scraping
Ingress controllers play a crucial role in managing access to services in a Kubernetes environment. We'll install the Nginx Ingress Controller using Helm and enable Prometheus metrics scraping:
- Add the ingress-nginx repository:
helm repo add ingress-nginx https://kubernetes.github.io/ingress-nginx
helm repo update- Install the ingress-nginx chart:
helm upgrade --install ingress-nginx ingress-nginx/ingress-nginx \
--namespace ingress-nginx --create-namespace \
--set controller.metrics.enabled=true \
--set controller.metrics.serviceMonitor.enabled=true \
--set controller.metrics.serviceMonitor.additionalLabels.release="prometheus"
This command installs the Nginx Ingress Controller and enables Prometheus to scrape metrics from it, essential for monitoring the performance and health of your ingress resources.
4. Monitoring and Alerting for Ingress URLs Returning 500 Errors
Prometheus's real power shines in its ability to not only monitor your stack but also provide actionable insights through alerting. Let's configure an alert to detect when ingress URLs return 500 errors.
- Define an alert rule in Prometheus:
Create a new file called custom-alerts.yaml and define an alert rule to monitor for 500 errors:
apiVersion: monitoring.coreos.com/v1
kind: PrometheusRule
metadata:
  name: ingress-500-errors
  namespace: monitoring
  labels:
    prometheus: kube-prometheus
spec:
  groups:
  - name: http-errors
    rules:
    - alert: HighHTTPErrorRate
      expr: |
        sum (rate(nginx_ingress_controller_requests{status=~"5.."}[1m])) > 0.1
        OR
        absent(sum (rate(nginx_ingress_controller_requests{status=~"5.."}[1m])))
      for: 1m
      labels:
        severity: critical
      annotations:
        summary: High HTTP Error Rate
description: "This alert fires when the rate of HTTP 500 responses from the Ingress exceeds 0.1 per second over the last 5 minutes."- Apply the alert rule to Prometheus:
You'll need to configure Prometheus to load this alert rule. If you're using the Helm chart, you can customize the values.yaml file or create a ConfigMap to include your custom alert rules.
- Verify the alert is working:
Trigger a condition that causes a 500 error and observe Prometheus firing the alert. For example, launch the following application:
kubectl create deploy hello --image brainupgrade/hello:1.0

kubectl expose deploy hello --port 80 --target-port 8080

kubectl create ingress hello --rule="hello.internal.brainupgrade.in/=hello:80" --class nginx
Access the application using the below command:
curl -H "Host: hello.internal.brainupgrade.in" 172.18.0.3:31080Wherein:
- 172.18.0.3 is the IP of the KIND cluster node.
- 31080 is the node port of the ingress controller service. This could be different in your case.
Bring down the hello service pods using the following command:
kubectl scale --replicas 0 deploy helloYou can view active alerts in the Prometheus UI (localhost:9999) by running the following command.
kubectl port-forward -n monitoring svc/prometheus-operated 9999:9090And you will see the alert being fired. See the following snapshot:
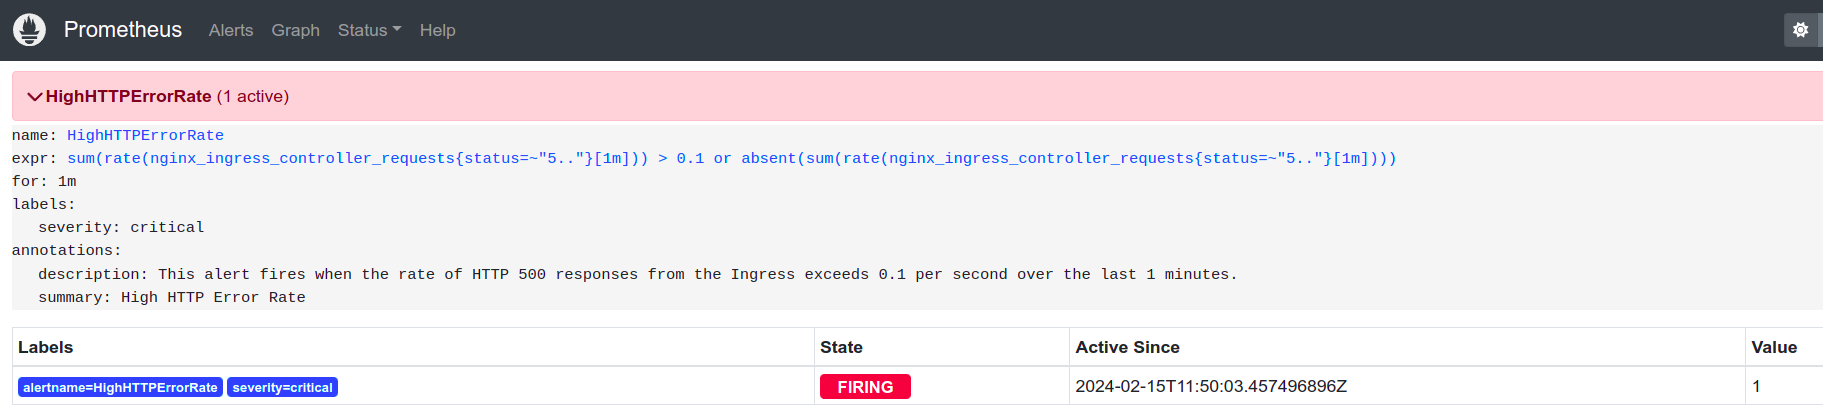
You can also configure Alertmanager to send notifications through various channels (email, Slack, etc.).
Conclusion
Integrating Prometheus with Kubernetes via Helm provides a powerful, flexible monitoring solution that's vital for maintaining the health and performance of your cloud-native applications. By setting up ingress monitoring and configuring alerts for specific error conditions, you can ensure your infrastructure not only remains operational but also proactively managed. Remember, the key to effective monitoring is not just collecting metrics but deriving actionable insights that lead to improved reliability and performance.
Published at DZone with permission of Rajesh Gheware. See the original article here.
Opinions expressed by DZone contributors are their own.
Comments