Measuring Page Speed With Lighthouse
How can we ensure that our pages are loading at top speed? The answer is to measure them regularly with Lighthouse and CI/CD.
Join the DZone community and get the full member experience.
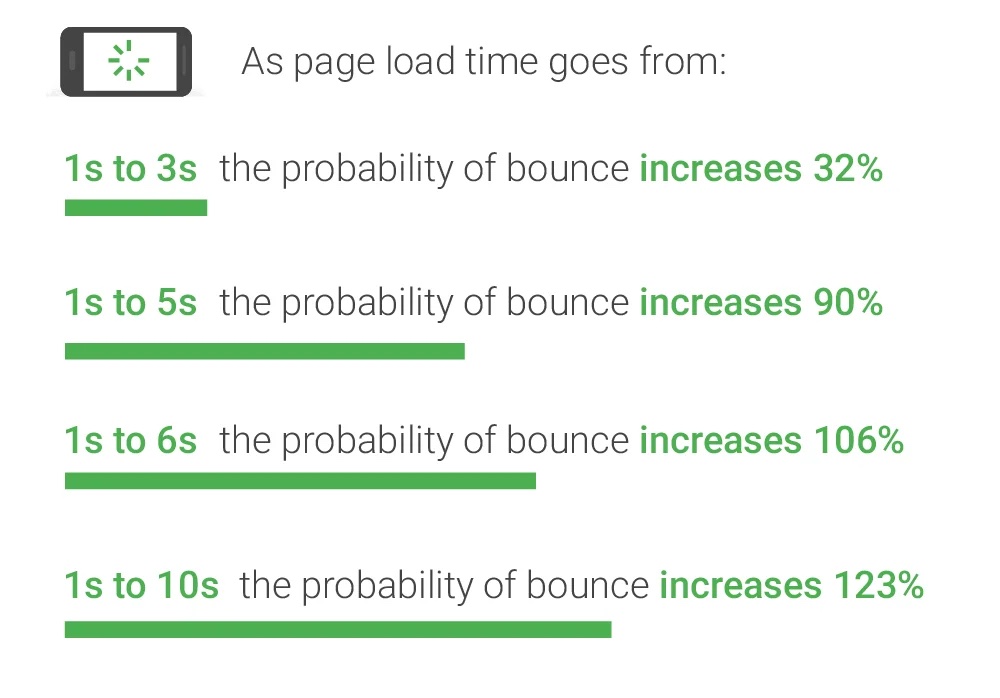
Join For FreePage speed matters more than you think. According to research by Google, the probability of users staying on your site plummets as the loading speed slows down. A site that loads in ten seconds increases the bounce rate by a whopping 123%. In other words, speed equals revenue.
Measuring Page Speed With Lighthouse
Lighthouse is a page speed benchmark tool created by Google. It runs a battery of tests against your website and produces a report with detailed advice to improve performance.

While Lighthouse's primary focus is performance, it can assess other things like:
- Accessibility: Suggest opportunities to make the content more accessible. This covers ensuring that the page is optimized for screen readers, all elements have labels, or the site is browsable with the keyboard.
- Best Practices: Checks for various sane practices that improve speed and security.
- SEO: Performs various checks to ensure that the page is SEO-optimized.
- PWA: Ensures the page passes progressive web application tests, which improves user experience on mobile devices.
4 Ways of Running Lighthouse
Lighthouse is an open-source project that you can run in different ways:
- Since it is included in Google Chrome, you can run it directly from the browser. Click on More tools > Developer Tools and open the Lighthouse tab.
- If you have Node installed, you can run
npm install -g lighthouseand run the tool in the command line like this:lighthouse https://semaphoreci.com - You can include it in your code as a Node package.
- And finally, Lighthouse has a CI version you can run in your continuous integration. We'll use this method to schedule periodical benchmarks.
Setting up Lighthouse CI
To run Lighthouse CI, you're going to need the following:
- Google Chrome
- A GitHub or Bitbucket account
- The LTS version of Node.
Let's get started by installing Lighthouse CI with npm install -g @lhci/cli
Next, create a config file called lighthouserc.js. The URL parameter is an array of websites to benchmark. We can adjust the numberOfRuns, as more runs yield more statistically-relevant results.
// lighthouserc.js

module.exports = {
  ci: {
    collect: {
        url: ['https://semaphoreci.com'],
        numberOfRuns: 1
    },
    upload: {
      target: 'filesystem',
      outputDir: 'reports'
    }
  }
};
Bear in mind that while Lighthouse is not particularly heavy on resources, setting the number of runs to a high value can make the job take too long to complete. Never forget that you want your CI pipeline to run in five to ten minutes, not more than that.
Now we can run Lighthouse with: lhci autorun. When finished, we'll find a few files in the reports folder:
manifest.json: contains a list of the reports generated.$url-$timestamp-report.htmlis the main report you can open with any browser.$url-$timestamp-report.json: the same report in the JSON version.
Using Lighthouse for Non-Functional Testing
Lighthouse lets us configure limits for each category. When one of these values falls below a predefined value, the tool stops the CI pipeline.
For example, let's say we don't want the ratings of our site to fall below 80% in all categories. To achieve that, we need to add assertions to the config file:
// lighthouserc.js

module.exports = {
  ci: {
    collect: {
        url: ['https://semaphoreci.com', 'https://semaphoreci.com/blog'],
        numberOfRuns: 5
    },
    upload: {
      target: 'filesystem',
      outputDir: 'reports'
    },
    // enforce limits
    assert: {
      assertions: {
        'categories:performance': ['error', {minScore: 0.8}],
        'categories:accessibility': ['error', {minScore: 0.8}],
        'categories:seo': ['error', {minScore: 0.8}],
        'categories:best-practices': ['error', {minScore: 0.8}]
        }
    }
  }
};
Measuring Page Speed With CI/CD
If you want to automate benchmarking with CI/CD, check out this step-by-step tutorial.
Setting Up a Dashboard
The Lighthouse CI project includes an optional dashboard that lets you browse historical data and find trends.

The downside of this approach is obvious — you need to manage yet another server. But it may be worth doing if you have a lot of sites to analyze.
Running Lighthouse in Web Development
We've only focused on testing an existing and running website. But a setup like this can perform non-functional tests during web development. You can, for instance, fail commits that make the site perform worse or break accessibility rules.
Time Is Money
Users are drawn to fast and responsive websites. The problem is that measuring page speed reliably is challenging since you cannot assume that everyone is on a fast connection and uses a top-tier device. With Lighthouse in your CI/CD pipeline, you can get results closer to real-life conditions and insights to help you continually improve.
Thanks for reading!
Opinions expressed by DZone contributors are their own.
Comments