Showing Long Animation Frames in Your DevTools
Use this code sample to integrate Long Animation Frames (LoAF) into the Chrome DevTools Performance Profiler to see where slow frames are happening quickly.
Join the DZone community and get the full member experience.
Join For FreeIf you’re a web developer, you probably spend a fair amount of time working with Chrome DevTools. It’s one of the best tools out there for diagnosing and improving the performance of your web applications. You can use it to track loading times, optimize CSS and JavaScript, and inspect network activity. But there’s an important piece of performance data that DevTools doesn’t yet expose by default: Long Animation Frames (LoAFs).
In this post, I’ll show you how to use the Performance API and Chrome’s extensibility features to expose LoAF data in DevTools. Along the way, I’ll explain what LoAFs are, why they’re crucial for web performance, and provide code snippets to help you track and debug them in your own projects.
What Are Long Animation Frames?
In modern web development, delivering smooth and responsive interactions is critical. Whether it’s an online store, a web app, or a content-heavy site, users expect their interactions to be buttery smooth. Long Animation Frames (LoAFs) occur when the browser takes too long to render an animation frame. A typical animation frame should render in 16-50 milliseconds (depending on the target framerate), but when a frame takes longer than that, it can result in stuttering or “jank.”
This issue is particularly important when we talk about Core Web Vitals. Long Animation Frames can directly impact Interaction to Next Paint (INP), one of the key metrics in Google’s Core Web Vitals, which measures the responsiveness of user interactions.
The LoAF API, introduced in Chrome 123, helps you track and measure these long animation frames. While DevTools doesn’t expose this information out-of-the-box (yet), we can use the Performance API and a bit of custom code to bring this data into Chrome’s Performance Panel.
Exposing LoAF Data in Chrome DevTools
Chrome DevTools already has a Performance Panel that shows you a flame chart, task durations, and key performance markers, but it doesn’t yet natively track LoAFs. However, you can extend DevTools using the PerformanceObserver API to log and expose LoAF data.
Let’s break down how you can do this.
Step 1: Setting Up the PerformanceObserver
First, we need to use the PerformanceObserver API to track LoAFs as they happen. Here’s a basic implementation of a PerformanceObserver to catch long animation frames.
if (window.PerformanceObserver) {
  const observer = new PerformanceObserver((list) => {
    list.getEntries().forEach((entry) => {
      console.warn(`LoAF detected at ${entry.startTime}, lasting ${entry.duration}ms`);
    });
  });

  observer.observe({ type: 'long-animation-frame', buffered: true });
}
This simple observer listens for the long-animation-frame type of performance entry, which was introduced in Chrome 123. For each LoAF that’s detected, we log the frame’s start time and duration. While this is useful for basic debugging, it doesn’t yet integrate with DevTools in any meaningful way.
Step 2: Integrating LoAF Data Into Chrome DevTools
Next, we’ll create custom performance measures using the Performance.measure() API and assign them properties that will allow them to show up in the Performance Panel in DevTools.
Here’s a more advanced version of our script that not only tracks LoAFs but also pushes them to the Performance Panel with visual markers.
const observer = new PerformanceObserver((list) => {
  list.getEntries().forEach((entry) => {
    // Measure the LoAF
    performance.measure('LoAF', {
      start: entry.startTime,
      duration: entry.duration,
      detail: {
        devtools: {
          dataType: 'track-entry',
          track: 'Long Animation Frames',
          color: 'primary',
          tooltipText: 'Long Animation Frame',
          properties: [
            ['blockingDuration', entry.blockingDuration],
            ['firstUIEventTimestamp', entry.firstUIEventTimestamp],
            ['renderStart', entry.renderStart],
            ['styleAndLayoutStart', entry.styleAndLayoutStart]
          ]
        }
      }
    });

    // Add script attribution
    entry.scripts.forEach((script) => {
      performance.measure('Script Execution', {
        start: script.startTime,
        duration: script.duration,
        detail: {
          devtools: {
            dataType: 'track-entry',
            track: 'Long Animation Frames',
            color: 'secondary',
            tooltipText: 'Script Execution',
            properties: [
              ['invoker', script.invoker],
              ['invokerType', script.invokerType],
              ['sourceURL', script.sourceURL],
              ['sourceFunctionName', script.sourceFunctionName],
              ['forcedStyleAndLayoutDuration', script.forcedStyleAndLayoutDuration]
            ]
          }
        }
      });
    });
  });
});

// Observe for long-animation-frame entries
observer.observe({ type: 'long-animation-frame', buffered: true });
In this example, we’re using performance.measure() to add custom performance entries, which will now be visible in the Performance Panel as trackable data points. We’ve also included additional properties, such as the duration of the LoAF, the blocking duration, and firstUIEventTimestamp to provide more context on what might be causing the slow frame.
By breaking down the frame and script execution details, we can better understand which specific operations within a long animation frame are contributing to the delay.
Step 3: Visualizing LoAF Data in Chrome DevTools
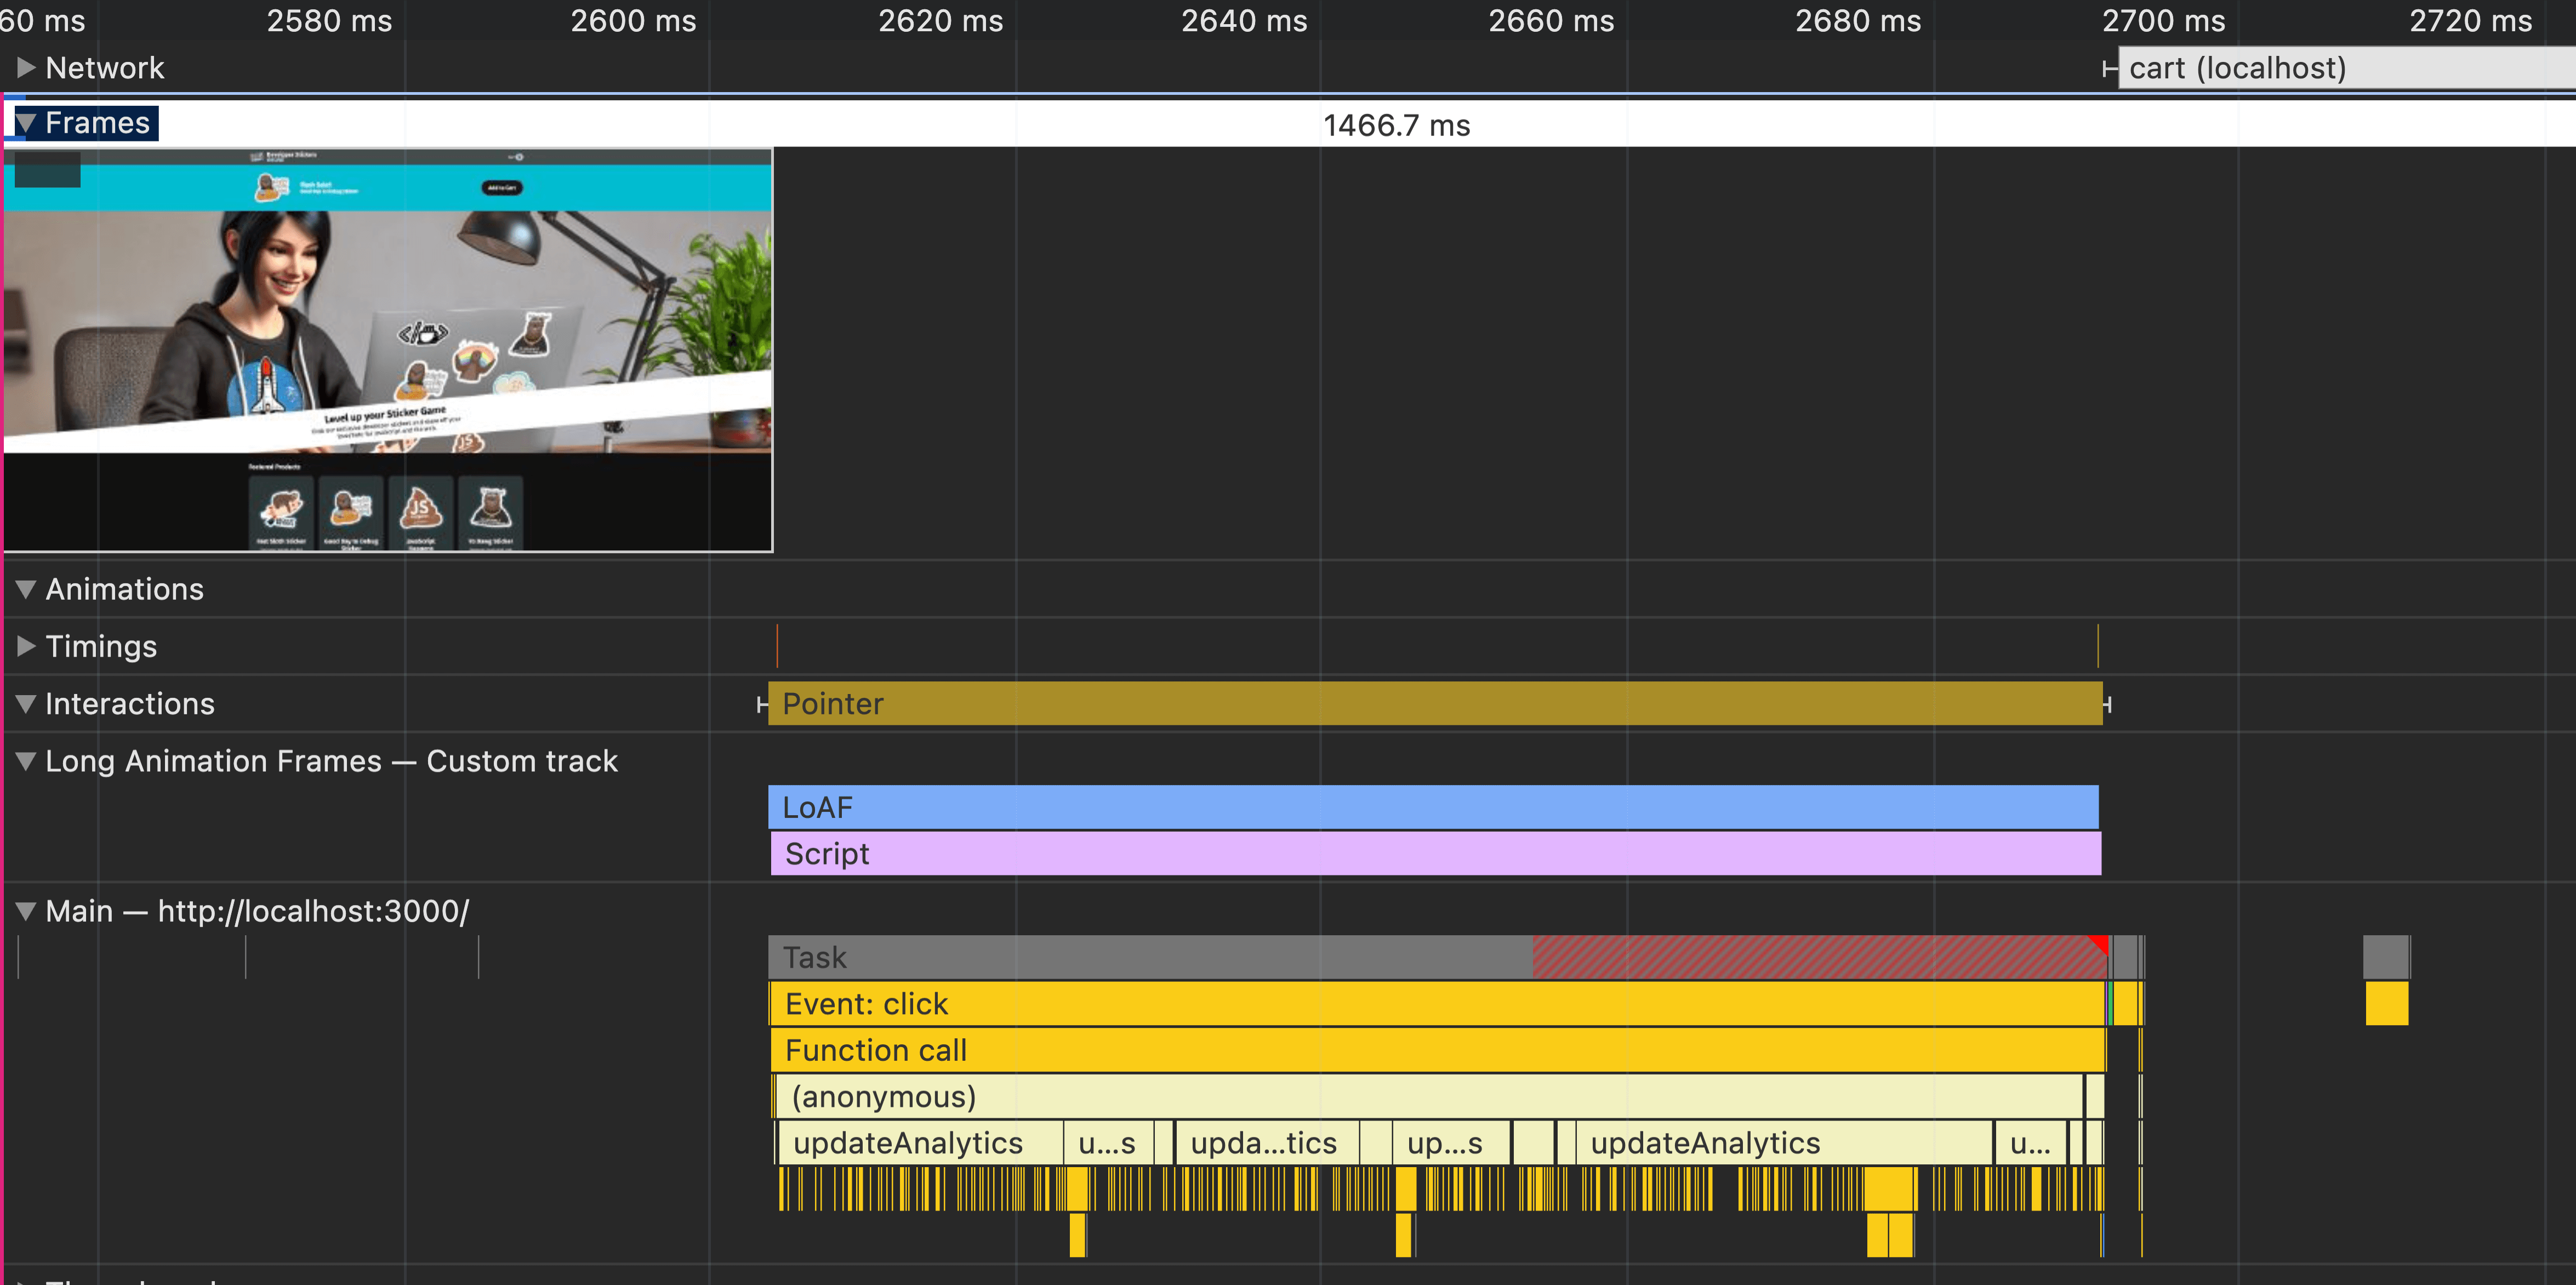
Once you’ve added your custom measures using the PerformanceObserver and Performance API, these custom entries will be visible in Chrome’s Performance Panel. You’ll see a new track labeled “Long Animation Frames” in the flame chart, along with color-coded segments representing different types of entries, like script execution or render start.
Here’s a screenshot to illustrate what this might look like (substitute your own screenshot of the DevTools panel).
Conclusion
That's it! Now you can easily see where Long Animation Frames happen so you can work to make your website faster.
Opinions expressed by DZone contributors are their own.
Comments