Effective Methods to Diagnose and Troubleshoot CPU Spikes in Java Applications
In this article, discover a few practical methods to help diagnose and resolve CPU spikes without making changes in your production environment.
Join the DZone community and get the full member experience.
Join For FreeCPU spikes are one of the most common performance challenges faced by Java applications. While traditional APM (Application Performance Management) tools provide high-level insights into overall CPU usage, they often fall short of identifying the root cause of the spike. APM tools usually can’t pinpoint the exact code paths causing the issue. This is where non-intrusive, thread-level analysis proves to be much more effective. In this post, I’ll share a few practical methods to help you diagnose and resolve CPU spikes without making changes in your production environment.
Intrusive vs Non-Intrusive Approach: What Is the Difference?
Intrusive Approach
Intrusive approaches involve making changes to the application’s code or configuration, such as enabling detailed profiling, adding extra logging, or attaching performance monitoring agents. These methods can provide in-depth data, but they come with the risk of affecting the application’s performance and may not be suitable for production environments due to the added overhead.
Non-Intrusive Approach
Non-intrusive approaches, on the other hand, require no modifications to the running application. They rely on gathering external data such as thread dumps, CPU usage, and logs without interfering with the application’s normal operation. These methods are safer for production environments because they avoid any potential performance degradation and allow you to troubleshoot live applications without disruption.
1. top -H + Thread Dump
High CPU consumption is always caused by the threads that are continuously applying code. Our application tends to have hundreds (sometimes thousands) of threads. The first step in diagnosis is to identify CPU-consuming threads from these hundreds of threads.
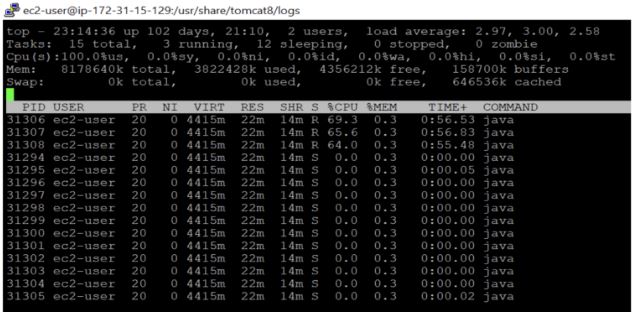
A simple and effective way to do this is by using the top command. The top command is a utility available on all flavors of Unix systems that provides a real-time view of system resource usage, including CPU consumption by each thread in a specific process. You can issue the following top command to identify which threads are consuming the most CPU:
top -H -p <PROCESS_ID>This command lists individual threads within a Java process and their respective CPU consumption, as shown in Figure 1 below:
Once you’ve identified the CPU-consuming threads, the next step is to figure out what lines of code those threads are executing. To do this, you need to capture a thread dump from the application, which will show the code execution path of those threads. However, there are a couple of things to keep in mind:
- You need to issue the
top -H -p <PROCESS_ID>command and capture the thread dump simultaneously to know the exact lines of code causing the CPU spike. CPU spikes are transient, so capturing both at the same time ensures you can correlate the high CPU usage with the exact code being executed. Any delay between the two can result in missing the root cause. - The
top -H -p <PROCESS_ID>command prints thread IDs in decimal format, but in the thread dump, thread IDs are in hexadecimal format. You’ll need to convert the decimal Thread IDs to hexadecimal to look them up in the dump.

Figure 2: yCrash reporting CPU consumption by each thread and their code execution Path
Disadvantages
This is the most effective and accurate method to troubleshoot CPU spikes. However, in certain environments, especially containerized environments, the top command may not be installed. In such cases, you might want to explore the alternative methods mentioned below.
2. RUNNABLE State Threads Across Multiple Dumps
Java threads can be in several states: NEW, RUNNABLE, BLOCKED, WAITING, TIMED_WAITING, or TERMINATED. If you are interested, you may learn more about different Thread States. When a thread is actively executing code, it will be in the RUNNABLE state. CPU spikes are always caused by threads in the RUNNABLE state. To effectively diagnose these spikes:
- Capture 3-5 thread dumps at intervals of 10 seconds.
- Identify threads that remain consistently in the
RUNNABLEstate across all dumps. - Analyze the stack traces of these threads to determine what part of the code is consuming the CPU.
While this analysis can be done manually, thread dump analysis tools like fastThread automate the process. fastThread generates a "CPU Spike" section that highlights threads that were persistently in the RUNNABLE state across multiple dumps. However, this method won’t indicate the exact percentage of CPU each thread is consuming.

Figure 3: fastThread tool reporting "CPU spike" section
Disadvantages
This method will show all threads in the RUNNABLE state, regardless of their actual CPU consumption. For example, threads consuming 80% of CPU and threads consuming only 5% will both appear. It wouldn’t provide the exact CPU consumption of individual threads, so you may have to infer the severity of the spike, based on thread behavior and execution patterns.
3. Analyzing RUNNABLE State Threads From a Single Dump
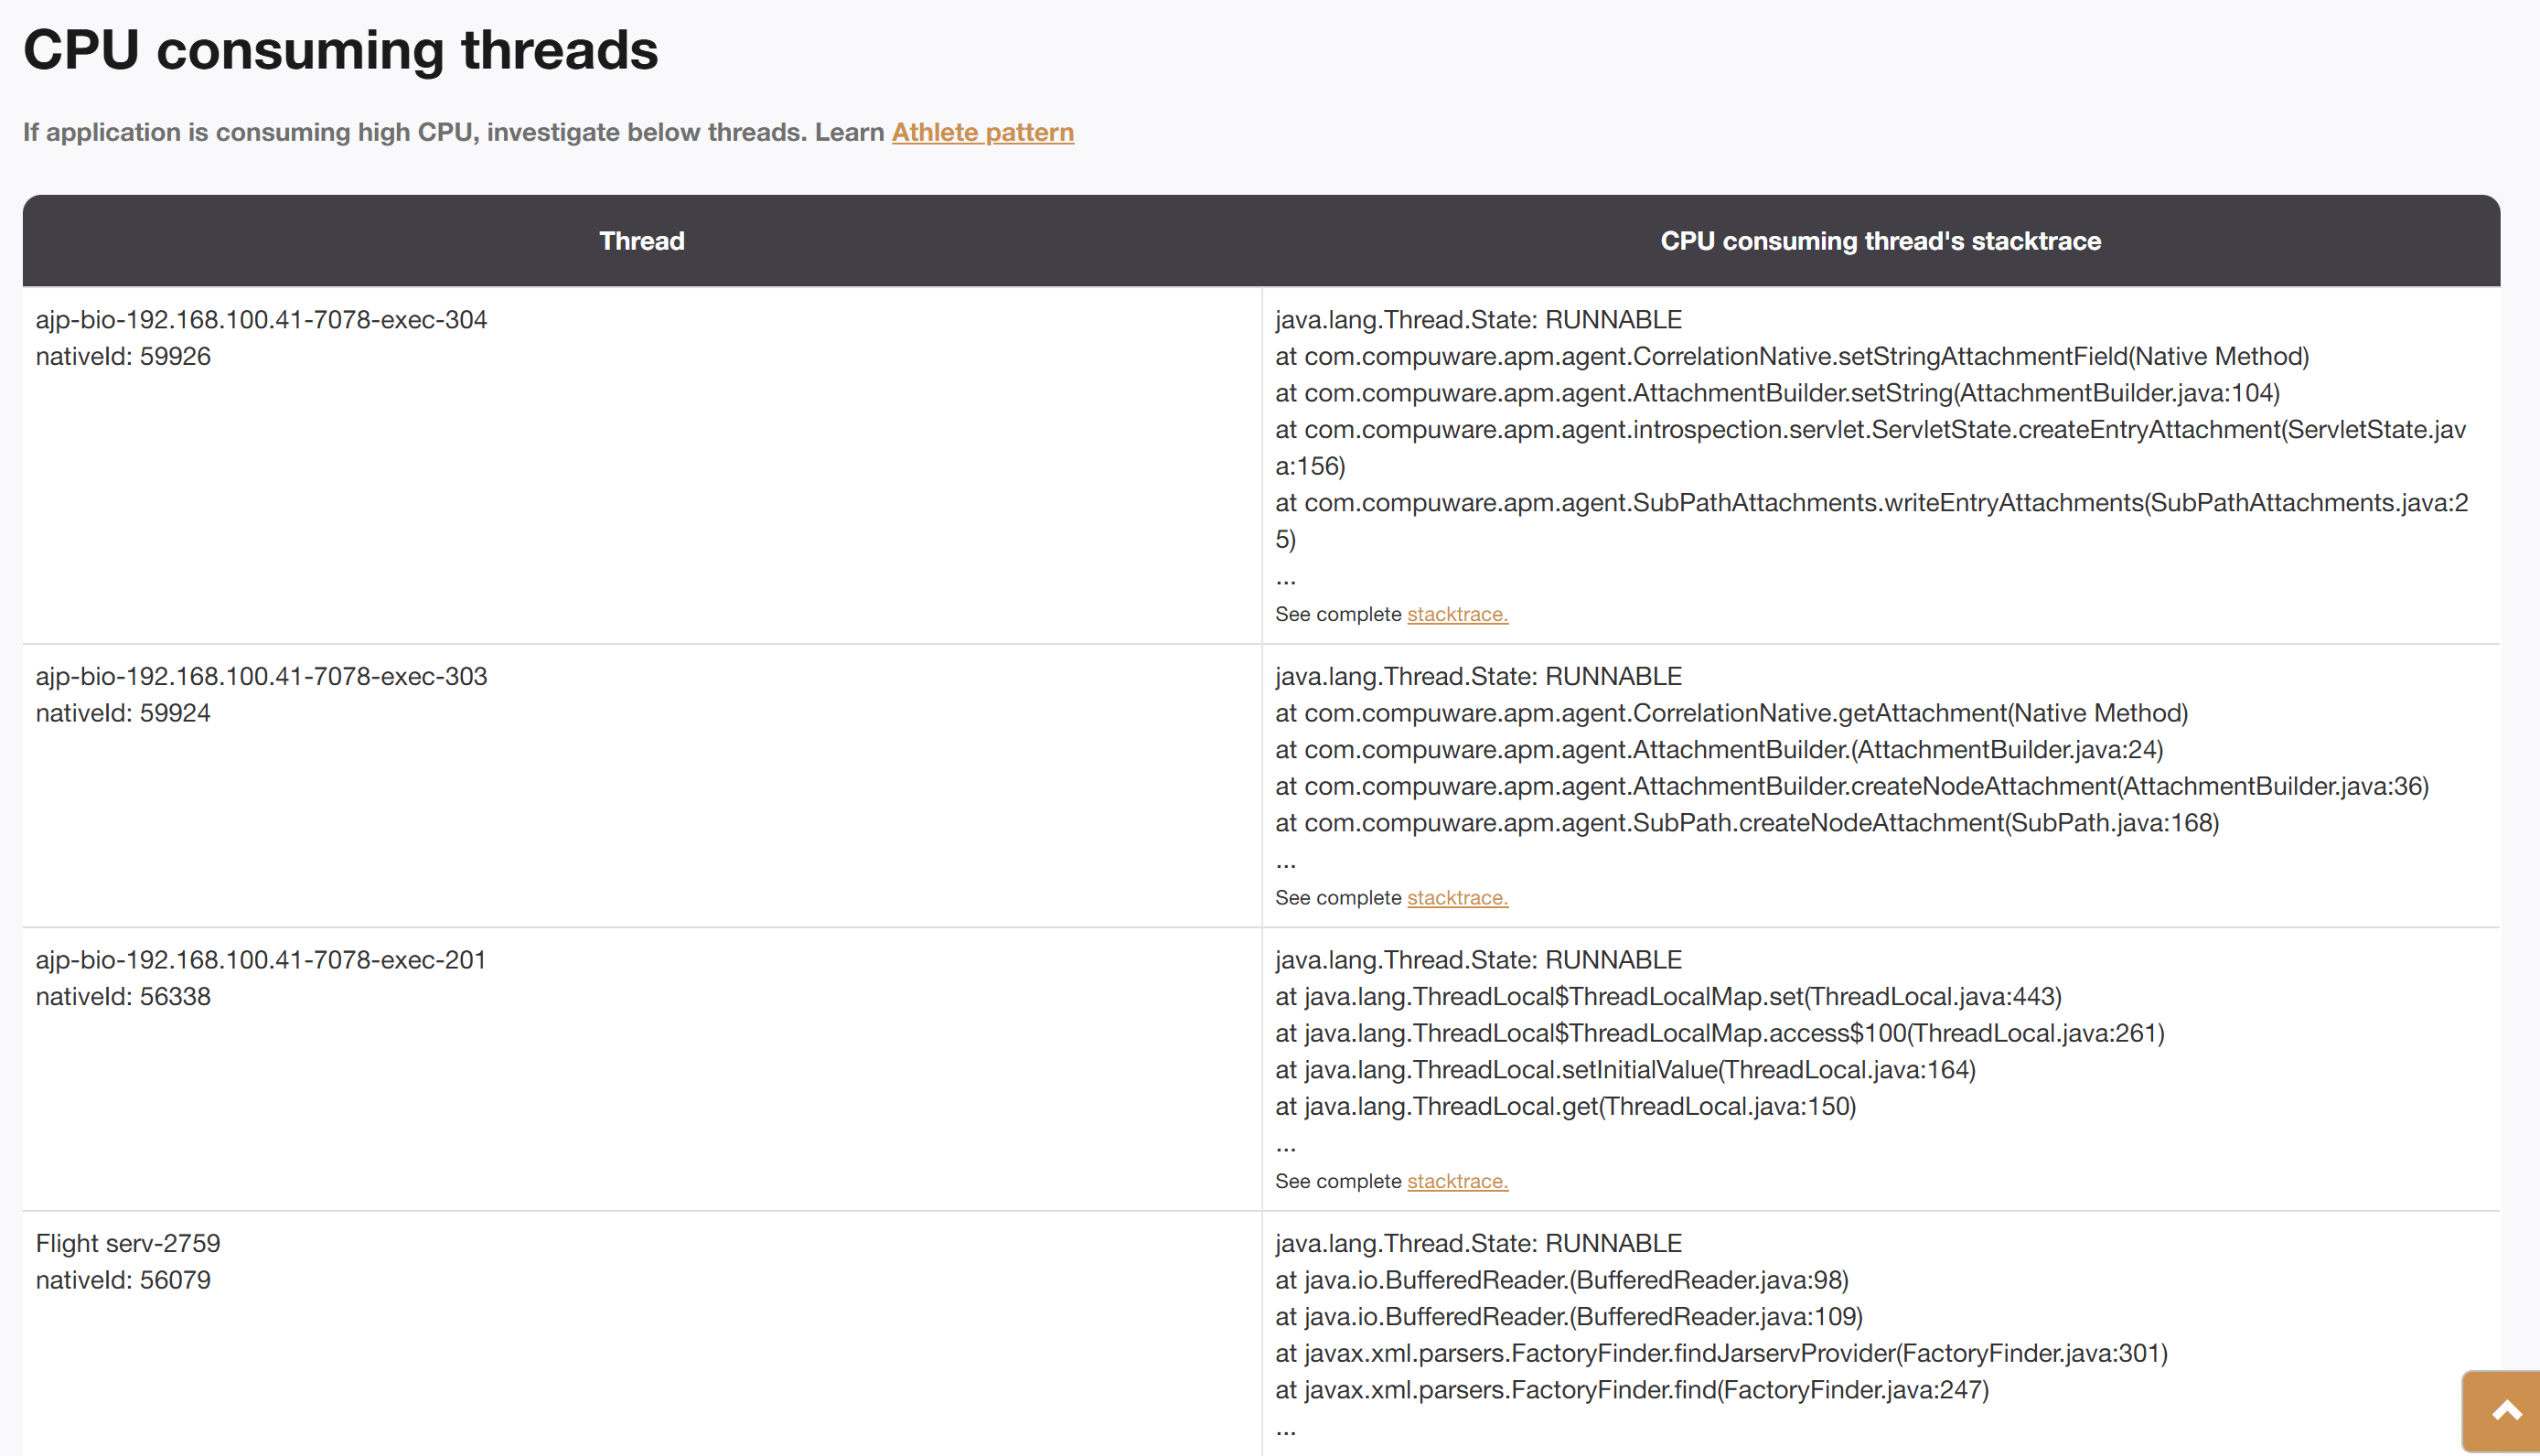
Sometimes, you may only have a single snapshot of a thread dump. In such cases, the approach of comparing multiple dumps can’t be applied. However, you can still attempt to diagnose CPU spikes by focusing on the threads in the RUNNABLE state. One thing to note is that the JVM classifies all threads running native methods as RUNNABLE, but many native methods (like java.net.SocketInputStream.socketRead0()) don’t execute code and instead just wait for I/O operations.
To avoid being misled by such threads, you’ll need to filter out these false positives and focus on the actual RUNNABLE state threads. This process can be tedious, but fastThread automates it by filtering out these misleading threads in its "CPU Consuming Threads" section, allowing you to focus on the real culprits behind the CPU spike.
Disadvantages
This method has a couple of disadvantages:
- A thread might be temporarily in the
RUNNABLEstate but may quickly move toWAITINGorTIMED_WAITING(i.e., non-CPU-consuming states). In such cases, relying on a single snapshot may lead to misleading conclusions about the thread’s impact on CPU consumption. - Similar to method #2, it will show all threads in the
RUNNABLEstate, regardless of their actual CPU consumption. For example, threads consuming 80% of CPU and threads consuming only 5% will both appear. It wouldn’t provide the exact CPU consumption of individual threads, so you may have to infer the severity of the spike, based on thread behavior and execution patterns.
Case Study: Diagnosing CPU Spikes in a Major Trading Application
In one case, a major trading application experienced severe CPU spikes, significantly affecting its performance during critical trading hours. By capturing thread dumps and applying the method #1 discussed above, we identified that the root cause was the use of a non-thread-safe data structure. Multiple threads were concurrently accessing and modifying this data structure, leading to excessive CPU consumption. Once the issue was identified, the development team replaced the non-thread-safe data structure with a thread-safe alternative, which eliminated the contention and drastically reduced CPU usage. For more details on this case study, read more here.
Conclusion
Diagnosing CPU spikes in Java applications can be challenging, especially when traditional APM tools fall short. By using non-intrusive methods like analyzing thread dumps and focusing on RUNNABLE state threads, you can pinpoint the exact cause of the CPU spike.
Published at DZone with permission of Ram Lakshmanan. See the original article here.
Opinions expressed by DZone contributors are their own.
Comments