Metric-Driven Decisions: KPIs and Dashboards for Product Managers (Part 2)
The second in this series should give you a better idea of which metrics and KPIs you should be using, and what they should tell you.
Join the DZone community and get the full member experience.
Join For FreeIn the previous post, we introduced KPIs, explored how those assist in decision making, defined leading and trailing indicators, and lastly, we've introduced key KPI categories.
In this post we will review some key KPIs and indicate what conclusions you may be able to extract from those.
The last post in this series will discuss generating KPIs and dashboards, and offer an example for leading and trailing KPIs.

Categorization of common KPIs
KPIs
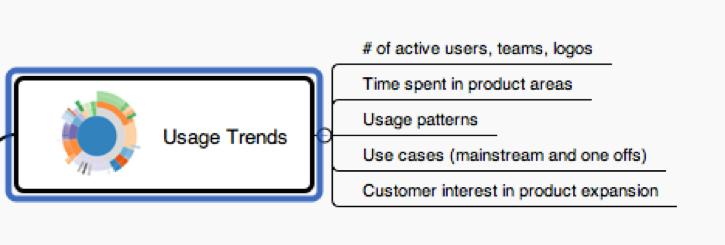
Usage trends
KPIs will assist you in identifying the product areas most used (and likely delivering value), establishing grounds for future investment. On the other hand, they also tell you which areas aren't getting the traction you were expecting.
- Users, teams, logos: how many are using the product, session length, the frequency of usage, user demographics, screens being used, etc.
- Usage patterns (with Google Analytics): what’s being used, how, what’s not used because it’s not useful or because it’s broken
- One-off use cases (Snowflakes): What are divergent use cases of the product that you either want to mainstream or eliminate?
- Customer participation in innovation: This isn't proper usage but the number of customer requests for innovation/expansion indicates healthy interest in the product.
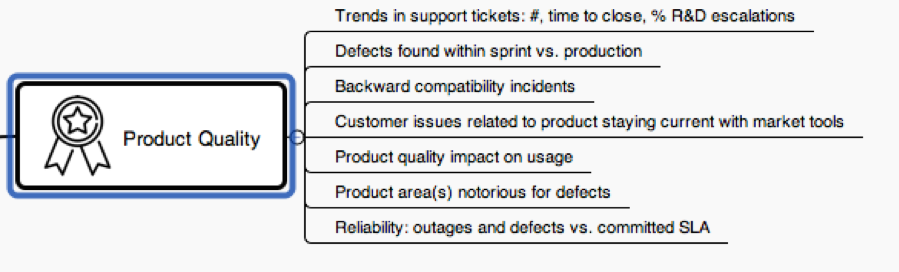
Product Quality
Understand the weaknesses of your product. Is your pre-release testing sufficient? What challenges your customers from using the product?
- Trending of support tickets, closure rate across time to close, and the of tickets escalated to R&D
- Defects found in sprint vs. those found in production, as well as defects found per commit
- Backward compatibility incidents: How many times have customers’ operations broke because of lack of backward compatibility?
- Customer issues related to product currency with common open source frameworks in use by customers.
- Product reliability impact on usage, for example, customer tendency to accept new releases as they come
- Product areas which repeatedly break
- Ongoing reliability: product outages and incidents vs. committed SLA and customer demand of backup systems/mechanisms
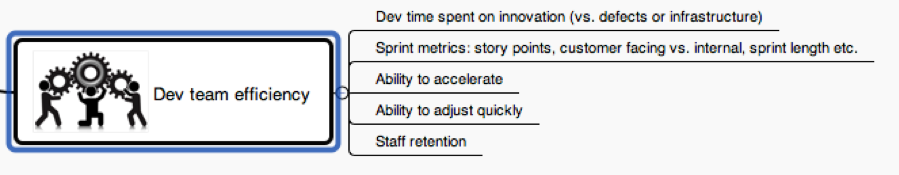
Dev Team Efficiency
There are plenty of squad team efficiency KPIs across the various agile tools (Jira, Rally, etc.). These are good metrics to understand how well is your team delivering, how much you are invested in innovation, and customer-facing deliverables vs. internal work and defects handling.
- Developer time spent on innovation (vs. tech debt and/or defects): This will lead to team retention and your differentiation. Alternatively, it can indicate significant technical debt, or, team preparation for scale.
- Sprint metrics: story points, missed milestones, delayed launches, regression test frequency, ability to shorten sprints, and the ability to move to continuous deployment model.
- Team ability to accelerate: Do you have the tools, team, and process to shrink the sprint further towards continuous deployment? This will tell you how far along your team is in automating test and deployment processes.
- Team ability to adjust: Context switching is notoriously bad for innovation, but sometimes a necessary evil. If you are unable to adjust, you need to break tasks smaller to achieve that.
- Staff retention: naturally, happy developers stay. Unhappy developers is bad news for the product.
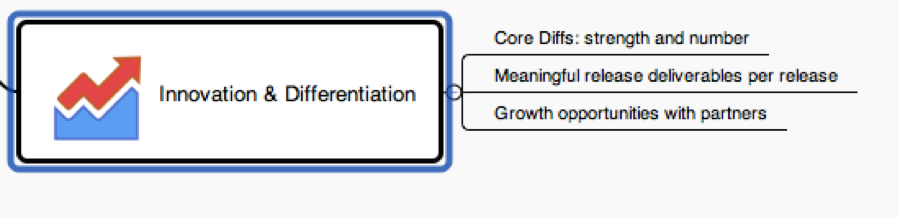
Innovation
Are you able to stay ahead of your market? What's your competitive window and how much can you invest in internal projects?
- Differentiation points: Test yourself, honestly and frequently, about how many real differentiation points you have against your competition. This isn’t the outward facing “fluff”; If the trend is downwards, your innovation is slowing and the competition is catching up.
- Meaningful deliverables per release, over time: Take a look at the last few releases: have you delivered customer-facing valuable features that are in use? If not, you might be spending a lot of time on technical debt, internal projects, and defects. That’s a good time to ring the alarm bells.
- Partnership growth opportunities: Is your product open enough to consider innovation also outside your R&D? The more opportunities, it means your product is more interesting to your peers in the industry.
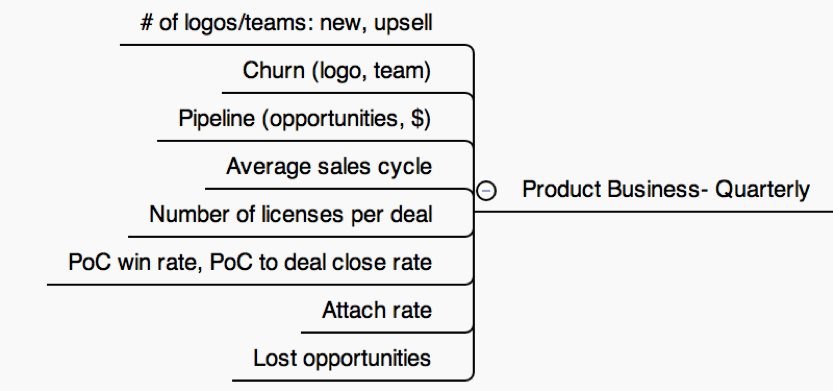
Product business
These are some of the leading business metrics PMs should monitor (IMO).
- Number of logos per quarter: using, new, upsell, (if available) new team expansion within logo (getting wide in account)
- Churn per Quarter: This metric is clear. Note the difference between logo churn and team churn. One idea is to look at renewal opportunities that did not close.
- Pipeline: Trending number of logos and opportunities in the coming quarters, revenue, etc. Not all sales reps allocate opportunity budget to products, but rather often align to the budget that can be allocated to the total pain they can solve
- Average sales cycle: This one may indicate your product is too tough to sell, that there are too many approvals required, or it is too complex to understand. Or maybe the price point is so high, approvals take too long. As you know, time kills deals; the longer sales cycle, the smaller the likelihood of getting deals. Inside of this, try to split the technical and commercial stages. It will tell you a lot about the difficulty to set up a deal and the sales team's ability to progress the deal.
- Licenses sold (/given away) per deal: This will tell you the level of confidence the field to realize value with this product. If you see many deals closed with 1-2 licenses, the field may be pushed to sell this SKU, but isn’t convinced. So they are “giving it away” to try. It will create a lot of snowflakes that will be hard to support and grow.
- PoC win %, PoC to deal closure rate: quite similar to the previous, it would tell you the perceived value of your product at the sales cycle vs. the proficiency of your field to close the deal.
- Attach rate: The percentage of deals where your product was sold standalone vs. attach to another product. This could be good or bad news, for example, if your product, cannot be sold on its own and you have a SKU/portfolio misalignment.
- Lost opportunities: trend those over quarter, try to classify the reason (price, value, competition, ...) and you will learn a lot.
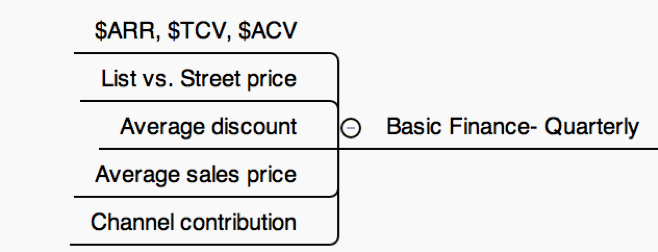
Basic financials
- $ARR, $TCV, $ACVper quarter (More here.)
- List vs. Street price, average discount: This is the actual price at which your field and the customers are selling your SKU. You want to know also the actual street price. If you are way more expensive, for example, you need to better arm your field to justify it.
- Average Sales Price (ASP): What is the actual transaction pricing? Interesting, as ASP may change between first deal in logo vs. subsequent ones. This may impact your decision whether to build a product that lends itself to new logos vs. adjacent team selling.
- Channel contribution: This will tell you how well the channel is enabled and contributing, compared to your expectation.
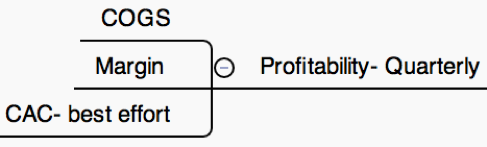
Profitability
This is really the P&L of your product. The bottom line is what will drive your company growth.
- COGS: How much does it cost to deliver your product, per license? A critical KPI for the growth stage and usually one of the most difficult ones to change.
- Margin: The outcome of actual sales price minus the COGS. You want this to be high up there, it impacts your bonus.
- Customer acquisition cost: All the sales and marketing money associated with acquiring new customers. Much like actual discount and sales cycle, if this figure is high, it means it’s hard to sell the product.
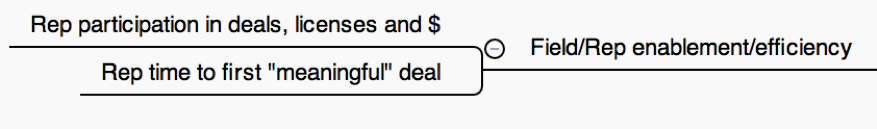
Field/rep efficiency
This is very important and an area you can and should influence via enablement. If reps aren’t confident in your product, that’s a problem. On the other hands, if reps are successful, they will sell it. Note that this must be done in an objective and productive manner. This is not personal nor vindictive.
- Rep participation in closed deals and pipe per quarter: How many reps are consistently closing deals with low discounts, high number of licenses etc. Going wide in the account vs. new logos. That's very telling about field enablement or product fit.
- Rep time to "enabled": How long before a rep closes their first “meaningful” deal? This will indicate to you how well you did in your messaging and field enablement.
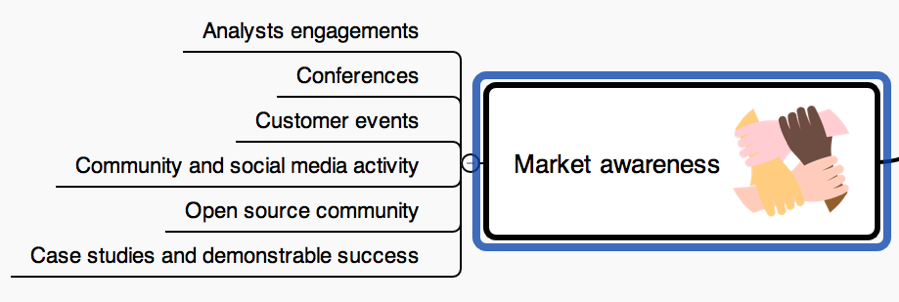
Market awareness
- Analysts: Are you getting a lot of interviews from analysts? What are their thoughts? What do they think the competitive advantage is? Who are they recommending to your market?
- Conferences: Similar, is your company invited to speak at customer or industry events about your product?
- Leads, MQL, etc., typical marketing metrics that are very important and you can influence.
- Media buzz: Likes and retweets of announcements you make. How widespread is the audience?
- Open source community contribution: Is there a community around your product? Contribution to open source to spread the use and applications?
Opinions expressed by DZone contributors are their own.
Comments