Microservices Observability (Part 1)
This is a demonstration of how to observe, trace, and monitor microservices on Java applications in an Openshift environment.
Join the DZone community and get the full member experience.
Join For FreeA Simple Use-Case Using Observability Patterns in Microservices Architecture.

| Framework | Version | Prometheus Metrics | Jaeger Tracing |
|---|---|---|---|
| spring boot | 2.1.4.RELEASE | enabled | enabled |
| thorntail | 2.4.0.Final | pending | pending |
| vertx | 3.6.3.redhat-00009 | pending | pending |
| apache camel | 7.3.0.fuse-730058-redhat-00001 (w/ spring boot 1.5.17.RELEASE) |
enabled | enabled |
According to microservices architecture and modern systems design, there are 5 observability patterns that help us to achieve the best in terms of monitoring distributed systems. They are the foundation for all who want to build reliable cloud applications. This tutorial will dive into domain-oriented observability, monitoring, instrumentation and tracing in a business-centered approach with a practical view using open-source projects sustained by the cloud-native computing foundation (CNCF).

WARNING: This is not a production application! It will not integrate with any polar API or device. This project was built in order to demonstrate concepts regarding observability patterns for microservices architecture. The main goal is to demonstrate how to monitor, instrument and trace microservices across the network with different technologies.
 The Use-Case Scenario
Almost everyone has a sports watch or a smartwatch. The user synchronizes an activity log after a training session. It could be an ordinary training session or a running session (w/ specific running data added).
The API collects the training session data and propagates through the wire to different 3rd party "example" applications like and google calendar. All data is received and/or enriched to specific 3rd party APIs.
All the communication is traced using OpenTracing API and we can also collect custom metrics in the polar-flow-api like:
counter.activity
counter.running
gauge.burned.calories
gauge.training.load
gauge.running.distance
counter.activity.sport (for different sport types)
gauge.vo2max
gauge.heart.max
gauge.running.distance
gauge.running.cadence
gauge.running.index
timer.user.sync_ [seconds_max, seconds_count, seconds_sum]
JSON Example: Sync an ordinary training session:


JSON Example: Sync a running training session:

The postman collection used in this lab can be downloaded here
With Uber's Jaeger it is possible to trace all communication:

You can navigate through spans in a trace of the POST /sync operation.
polar-flow-api primary endpoints
| method | URI | description |
|---|---|---|
| POST | /v1/sync | sync polar application data across 3rd party software |
| GET | /actuator/prometheus | Prometheus metrics export (will expose all custom metrics also) |
| GET | /actuator/metrics/activity.count | total activities |
| GET | /actuator/metrics/running.count | total running activities |
*-integration-api (FUSE) endpoints
| method | URI | description |
|---|---|---|
| GET | :8081/metrics | Default metrics export (will expose all custom metrics also) |
| GET | :8081/prometheus | Prometheus metrics export (will expose all custom metrics also) |
polar-flow-api secondary endpoints
| method | URI | description |
|---|---|---|
| GET | /v2/api-docs | swagger json |
| GET | /swagger-ui.html | swagger html |
| GET | /actuator/metrics | metrics - provided by spring boot actuator |
| GET | /actuator/metrics/jvm.memory.used | metrics: jvm.memory.used |
| GET | /actuator/metrics/jvm.memory.used?tag=area:heap | metrics: jvm.memory.used:heap |
| GET | /actuator/metrics/jvm.memory.used?tag=area:heap&tag=id:PS%20Eden%20Space | metrics: jvm.memory.used:eden |
| GET | /actuator/info | info / heartbeat - provided by spring boot actuator |
| GET | /actuator/health | application health - provided by spring boot actuato |
Observability Labs: Step 1 - Project Creation
export current_project=microservices

# login into openshift platform
oc login https://master.<>.com:443 --token=<>

# create a new project
oc new-project microservices --description="microservices observability" --display-name="microservices"
export current_project=microservices
# login into openshift platform
oc login https://master.<>.com:443 --token=<>
# create a new project
oc new-project microservices --description="microservices observability" --display-name="microservices"Observability Labs: Step 2 - Prometheus Operator

1- Go to the Cluster Console menu:

2- On the left menu, navigate through Catalog Sources, under Operators:

3- Change the namespace for our recently created namespace:
 4- Under Red Hat Operators section, choose the Prometheus Operator and click on the button: Create Subscription:

5- Check the YAML definition and confirm the subscription clicking on the Create button:
 6- Check if the subscription was created. You'll see the info: 1 installed:

7- Click on the 1 installed link to see Prometheus operator overview tab:

8- Create a new service monitor, clicking on the "Create New" button:

9- Change the suggested YAML definition with the following:
The new definition will enable:
- The namespace that Prometheus will work on using
namespaceSelector; - The label that will be used on all service (svc) definitions
monitor: springboot2-api - The name of the endpoint
httpthat will be used to scrape the Prometheus data and thepaththat the application will expose Prometheus' endpoint. All applications using these definitions will be scraped with this service monitor configuration. Confirm the service monitor creation clicking on the "Create" button.
10- The service monitor will be created and be ready to scrape application metrics:

11- Next, let's deploy the Prometheus server. Return to operator overview tab and select:

12- Change the suggested YAML definition with the following:

13- Check the deployment under operator instances tab:

14- Expose Prometheus server:
oc expose svc prometheus-operatedObservability Labs: Step 3 - Sonatype Nexus
In order to continue this lab, you must provide a Sonatype Nexus instance in the microservices namespace. The detailed instructions can be found in this readme.
Observability Labs: Step 4 - Jaeger
# We will use a all-in-one Jaeger deployment. This should not be used in production!

wget -O jaeger-all-in-one-template.yml https://raw.githubusercontent.com/aelkz/microservices-observability/master/_configuration/jaeger/jaeger-all-in-one-template.yml

oc process -f jaeger-all-in-one-template.yml | oc create -f -

# get jaeger's route
echo https://$(oc get route jaeger-query --template='{{ .spec.host }}')
Observability Labs: Step 5 - Grafana
oc import-image openshift3/grafana --from=registry.redhat.io/openshift3/grafana --confirm -n openshift

wget -O grafana-standalone.yaml https://raw.githubusercontent.com/aelkz/microservices-observability/master/_configuration/grafana/grafana.yaml

oc new-app -f grafana-standalone.yaml --param NAMESPACE=${current_project}

# OBS. Grafana will be deployed with a oauth-proxy sidecard. In order to access grafana, you'll need access using some service-account and/or cluster admin.

# get grafana's route
echo https://$(oc get route grafana --template='{{ .spec.host }}')- access grafana and confirm user permissions.
- Add a new Prometheus datasource with the Prometheus service at http://prometheus-operated.microservices.svc.cluster.local:9090, with the following configuration. Click Save&Test, then Back.

After that, import the main dashboard that was designed for this use case. The JSON file can be located in this repository at configuration/grafana/main-dashboard.json
Observability Labs: Step 6 - Main Application Deployment
export current_project=microservices

git clone https://github.com/aelkz/microservices-observability.git

cd microservices-observability/

# download maven settings.xml file
curl -o maven-settings-template.xml -s https://raw.githubusercontent.com/aelkz/microservices-observability/master/_configuration/nexus/maven-settings-template.xml

# change mirror url using your nexus openshift route
export MAVEN_URL=http://$(oc get route nexus3 --template='{{ .spec.host }}')/repository/maven-group/
export MAVEN_URL_RELEASES=http://$(oc get route nexus3 --template='{{ .spec.host }}')/repository/maven-releases/
export MAVEN_URL_SNAPSHOTS=http://$(oc get route nexus3 --template='{{ .spec.host }}')/repository/maven-snapshots/

awk -v path="$MAVEN_URL" '/<url>/{sub(/>.*</,">"path"<")}1' maven-settings-template.xml > maven-settings.xml

rm -fr maven-settings-template.xml

# deploy parent project on nexus
mvn clean package deploy -DnexusReleaseRepoUrl=$MAVEN_URL_RELEASES -DnexusSnapshotRepoUrl=$MAVEN_URL_SNAPSHOTS -s ./maven-settings.xml -e -X -N

# deploy polar-flow-api (spring boot 2 API)
# NOTE. In order to import Red Hat container images, you must setup your credentials on openshift. See: https://access.redhat.com/articles/3399531
# The config.json can be found at: /var/lib/origin/.docker/ on openshift master node.
# create a secret with your container credentials
oc delete secret redhat.io -n openshift
oc create secret generic "redhat.io" --from-file=.dockerconfigjson=config.json --type=kubernetes.io/dockerconfigjson -n openshift
oc create secret generic "redhat.io" --from-file=.dockerconfigjson=config.json --type=kubernetes.io/dockerconfigjson -n microservices

oc import-image openjdk/openjdk-8-rhel8 --from=registry.redhat.io/openjdk/openjdk-8-rhel8 --confirm -n openshift

# oc delete all -lapp=polar-flow-api
oc new-app openjdk-8-rhel8:latest~https://github.com/aelkz/microservices-observability.git --name=polar-flow-api --context-dir=/polar-flow-api --build-env='MAVEN_MIRROR_URL='${MAVEN_URL} -e MAVEN_MIRROR_URL=${MAVEN_URL}

oc patch svc polar-flow-api -p '{"spec":{"ports":[{"name":"http","port":8080,"protocol":"TCP","targetPort":8080}]}}'

oc label svc polar-flow-api monitor=springboot2-api
The API can now be discoverable through Prometheus scrape process, showing it’s state as UP:

oc expose svc/polar-flow-api -n ${current_project}

# NOTE: if you need to change jaeger host and port, or any other settings, just create a new application.yaml file and mount as a new volume on polar-flow-api container.
vim src/main/resources/application.yaml

oc delete configmap polar-flow-api-config

oc create configmap polar-flow-api-config --from-file=src/main/resources/application.yaml

oc set volume dc/polar-flow-api --add --overwrite --name=polar-flow-api-config-volume -m /deployments/config -t configmap --configmap-name=polar-flow-api-config
Observability Labs: Step 7 - Integration Deployment
Now that the main API is deployed, let’s deploy the integration layer.
# import a new spring-boot camel template
curl -o s2i-microservices-fuse73-spring-boot-camel.yaml -s https://raw.githubusercontent.com/aelkz/microservices-observability/master/_configuration/openshift/s2i-microservices-fuse73-spring-boot-camel.yaml

oc delete template s2i-microservices-fuse73-spring-boot-camel -n microservices

oc create -n microservices -f s2i-microservices-fuse73-spring-boot-camel.yaml

export current_project=microservices
export app_name=medical-integration
export app_group=com.redhat.microservices
export app_git=https://github.com/aelkz/microservices-observability.git
export app_git_branch=master
export maven_url=http://$(oc get route nexus3 --template='{{ .spec.host }}' -n ${current_project})/repository/maven-group/

oc delete all -lapp=${app_name}-api

# the custom template has some modifications regarding services,route and group definitions.
oc new-app --template=s2i-microservices-fuse73-spring-boot-camel --name=${app_name}-api --build-env='MAVEN_MIRROR_URL='${maven_url} -e MAVEN_MIRROR_URL=${maven_url} --param GIT_REPO=${app_git} --param APP_NAME=${app_name}-api --param ARTIFACT_DIR=${app_name}/target --param GIT_REF=${app_git_branch} --param MAVEN_ARGS_APPEND='-pl '${app_name}' --also-make'

# check the created services:
# 1 for default app-context and 1 for /metrics endpoint.
oc get svc -n microservices | grep medical

# in order to polar-flow-api call the medical-integration-api, we need to change it's configuration
curl -o application.yaml -s https://raw.githubusercontent.com/aelkz/microservices-observability/master/_configuration/openshift/polar-flow/application.yaml

# NOTE. If you have changed the service or application's name, you need to edit and change the downloaded application.yaml file with your definitions.

# create a configmap and mount a volume for polar-flow-api

oc delete configmap polar-flow-api-config

oc create configmap polar-flow-api-config --from-file=application.yaml

oc set volume dc/polar-flow-api --add --overwrite --name=polar-flow-api-config-volume -m /deployments/config -t configmap --configmap-name=polar-flow-api-config

rm -fr application.yaml

# now let's create a new service monitor under prometheus operator, to scrape medical-integration-api metrics

# repeat the initial steps of this tutorial on how to create a prometheus service monitor. Use the following definition to scrape FUSE based application metrics: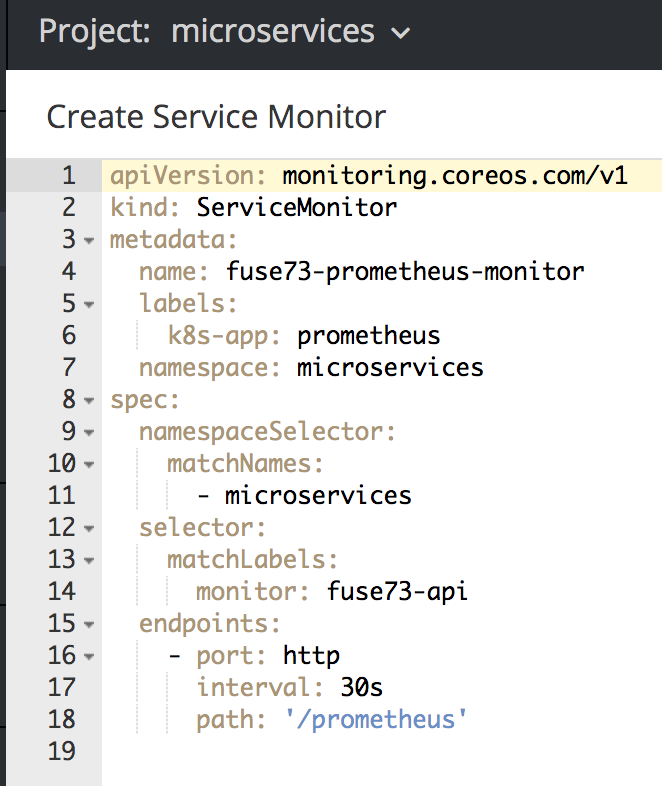


curl -X GET http://medical-integration-api-metrics.microservices.svc.cluster.local:8081/metrics
curl telnet://medical-integration-api-metrics.microservices.svc.cluster.local:8081
Observability Labs: Step 8 - 3rd Party Application Deployment
Now that the main API and the integration API are deployed, let’s deploy the 3rd party application layer. This layer simulates all 3rd party applications in our example like social networks and medical specific APIs.
export current_project=microservices

export MAVEN_URL=http://$(oc get route nexus3 --template='{{ .spec.host }}')/repository/maven-group/
export MAVEN_URL_RELEASES=http://$(oc get route nexus3 --template='{{ .spec.host }}')/repository/maven-releases/
export MAVEN_URL_SNAPSHOTS=http://$(oc get route nexus3 --template='{{ .spec.host }}')/repository/maven-snapshots/

# deploy nutritionist-api (spring boot 2 API)

# oc delete all -lapp=nutritionist-api
oc new-app openjdk-8-rhel8:latest~https://github.com/aelkz/microservices-observability.git --name=nutritionist-api --context-dir=/nutritionist-api --build-env='MAVEN_MIRROR_URL='${MAVEN_URL} -e MAVEN_MIRROR_URL=${MAVEN_URL}

oc patch svc nutritionist-api -p '{"spec":{"ports":[{"name":"http","port":8080,"protocol":"TCP","targetPort":8080}]}}'

# we will also be using the same service monitor defined in the main API
oc label svc nutritionist-api monitor=springboot2-api

oc expose svc/nutritionist-api -n ${current_project}
Now all APIs are exposed to Prometheus:


And tracing working as expected.
Observability Labs: Conclusion
Openshift Operators An Operator is a method of packaging, deploying and managing a Kubernetes-native application. A Kubernetes-native application is an application that is both deployed on Kubernetes and managed using the Kubernetes APIs and kubectl tooling.
Prometheus is an open-source tool for instrumenting and monitoring metrics. It works in a pull-based manner, makes HTTP requests to your metric endpoint with the pre-determined time intervals(default 10seconds), and store these metrics in its own time-series database. Prometheus also provides a GUI to make queries over these metrics with its own query language PromQL. It provides basic graphics to visualize metrics. Prometheus also has an alert plugin to produce alerts according to metrics values.
Jaeger key features:
- High Scalability – Jaeger backend is designed to have no single points of failure and to scale with the business needs.
- Native support for OpenTracing – Jaeger backend, Web UI, and instrumentation libraries have been designed from the ground up to support the OpenTracing standard.
- Storage Backend – Jaeger supports two popular open-source NoSQL databases as trace storage backends: Cassandra 3.4+ and Elasticsearch 5.x/6.x.
- Modern UI – Jaeger Web UI is implemented in Javascript using popular open-source frameworks like React.
- Cloud-Native Deployment – Jaeger backend is distributed as a collection of Docker images. - Deployment to Kubernetes clusters is assisted by Kubernetes templates and a Helm chart.
- All Jaeger backend components expose Prometheus metrics by default
Grafana Grafana is an open-source metric analytics and visualization suite. It is most commonly used for visualizing time series data for infrastructure and application analytics but many use it in other domains including industrial sensors, home automation, weather, and process control.
Thanks for reading and taking the time to comment!
Feel free to create a PR on https://github.com/aelkz/microservices-observability
Opinions expressed by DZone contributors are their own.
Comments