Modes and Modality in Performance Testing
This article explores why it's crucial to check for modality of performance test results, how to detect multimodal distributions, and how to handle them.
Join the DZone community and get the full member experience.
Join For FreeWhen reporting summary statistics for performance test results, there's a common assumption that the data follows a central tendency. But is this always true? What if the data does not exhibit a single central tendency? In such cases, the traditional metrics like averages might be misleading.
This article explores why it's crucial to check for modality of performance test results, how to detect multimodal distributions, and how to handle them. For users of JMeter, a new plugin is introduced to help automate this process.
Unimodal vs. Multimodal Distributions
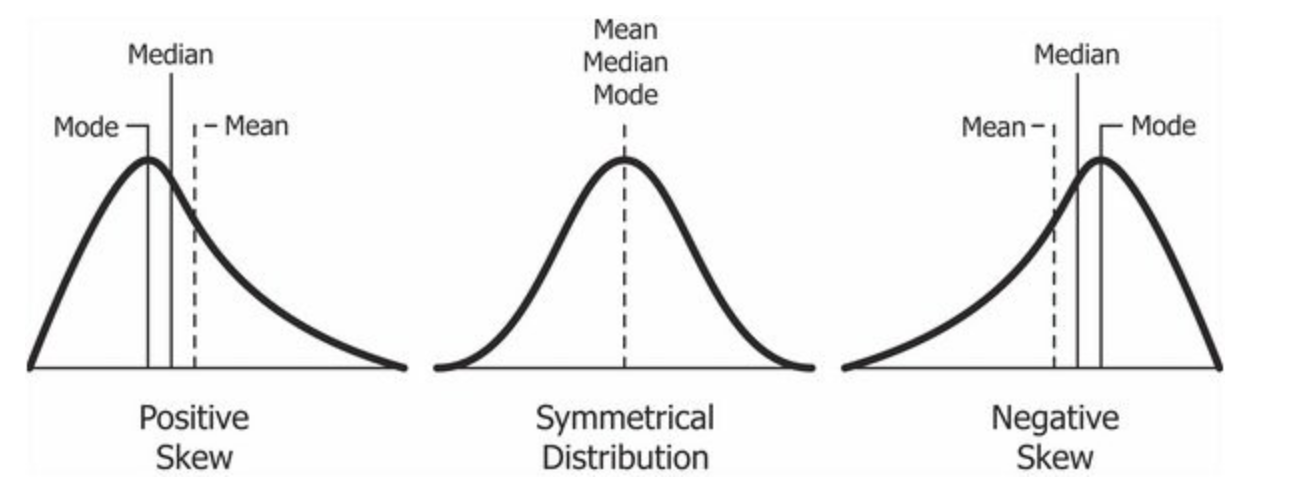
In performance testing, data is often assumed to be unimodal; i.e., where the results cluster around a single peak. In such cases, summary statistics like the mean (average) are meaningful because they reflect the central tendency. Here are examples of unimodal distributions under different skewness:
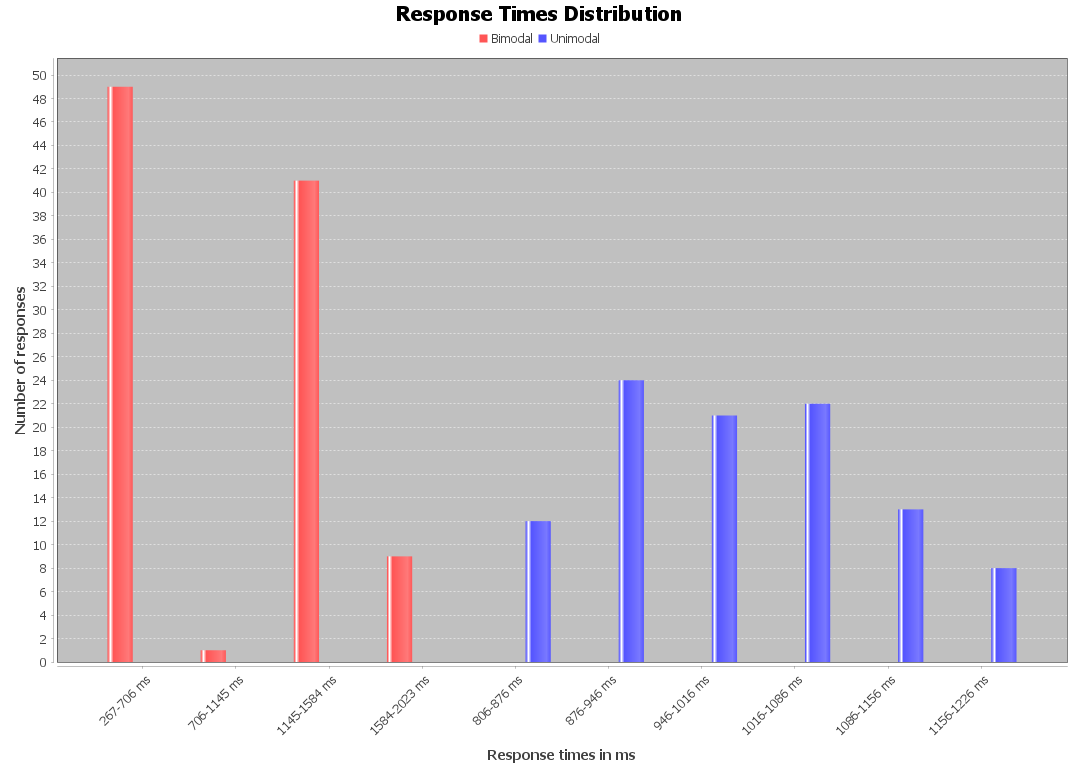
However, in many scenarios, the response times can show a multimodal distribution, which means there are two or more distinct peaks in the data. Most commonly, this is bimodal:
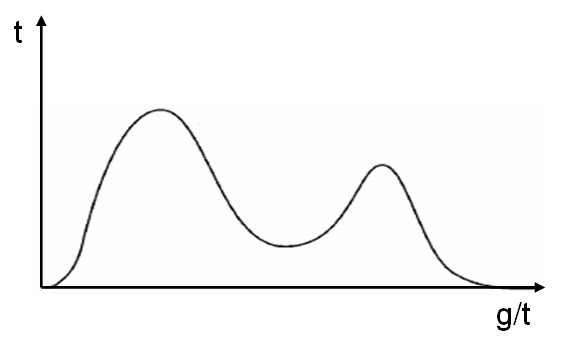
In a bimodal distribution, the data reflects two separate patterns, each with its own average. If you rely on the overall mean, you might miss this and end up with misleading conclusions. The summary statistics become less useful, and you must separate the data into distinct modes to understand what's happening in the system.
Why Multimodality May Happen in Performance Testing
There are several reasons for multimodal distributions in software performance testing, to name a few:
- Varying test data: Some inputs might take longer to process than others.
- Server-side events: Background tasks on the server under test could intermittently slow down performance.
- Load balancing issues: A load balancer might route traffic to the slower legs of a distributed system.
- Test script bugs: Invalid parameters could cause "fast failures" that the script doesn't catch, skewing the results.
Detecting Multimodality Using Visual Inspections
Common methods for detecting multimodal distributions are to visualize the data with two types of graphs:
- Histograms
- Percentiles graphs
Histograms
You can plot a histogram using tools like Excel, or if you're using JMeter, the Response Times Distribution plugin can generate histograms for you. Visually inspect the histogram to see if modes look genuine or if they might be artifacts of small bin size.
Percentiles
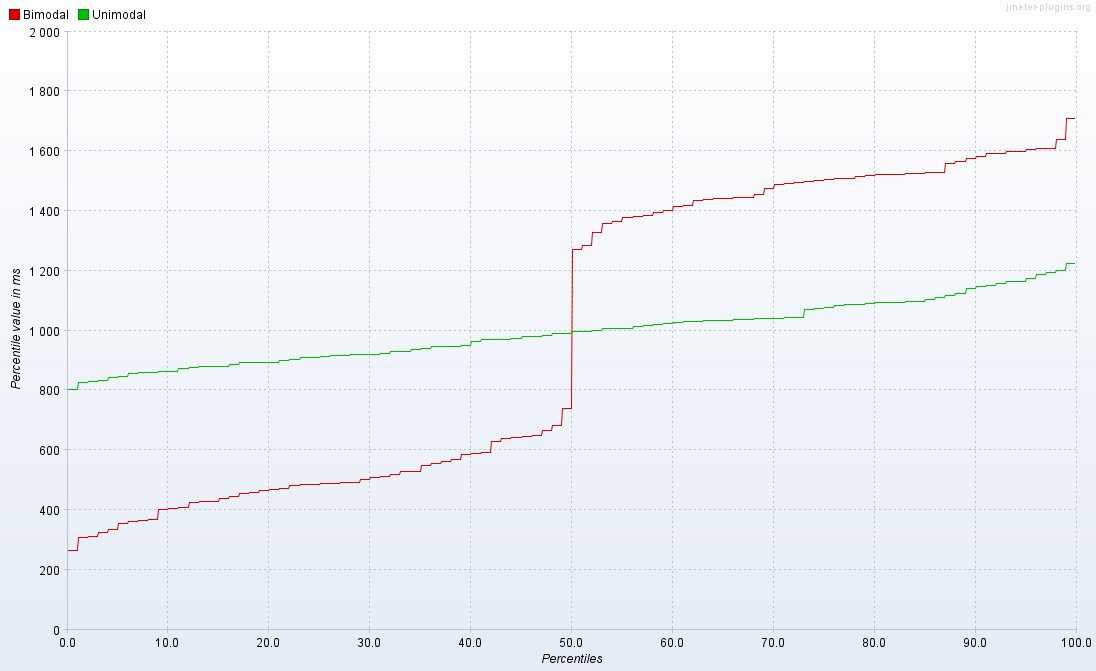
Another way to detect multimodality is through the percentiles graph. If the graph has noticeable "steps" in the middle percentiles (beyond the extremes), this could indicate multimodal behavior. As an example, the following percentile graph shows the curves for both bimodal (red) and unimodal (green) samplers:
Limitations of Manual Visualizations
Manual visualizations can be time-consuming to generate and interpret histograms, and choosing the correct bin size (the width of each bar in the histogram) can be tricky. Too large a bin size might mask subtle differences, while too small a bin size can overemphasize minor variations. This becomes especially difficult when you have multiple samplers to analyze.
Automating Multimodal Detection
To simplify this process, a new JMeter plugin automatically detects multimodal distributions in performance test data. It uses an indirect approach based on the mvalue-based modal test as suggested by Brendan Gregg.
The mvalue measures the variation in a histogram, normalized by the height of its peaks. By comparing the mvalue to a predefined threshold, the tool can decide whether the data is multimodal. Adjusting the threshold helps balance false positives and false negatives.
Brendan Gregg recommends an mvalue of 2.4 as a good starting point for investigating multimodality, while Andrey Akinshin suggests 2.8 to reduce false positives. The best threshold for your system may vary, so experimentation is key.
The Modality Plugin in a Nutshell
The plugin calculates the mvalue using two different bin sizes:
- Scott's normal reference rule, which is optimal for normally distributed data
- Freedman-Diaconis rule, which works better with skewed data
The plugin chooses the bin size that produces the highest mvalue and presents the results in a grid:
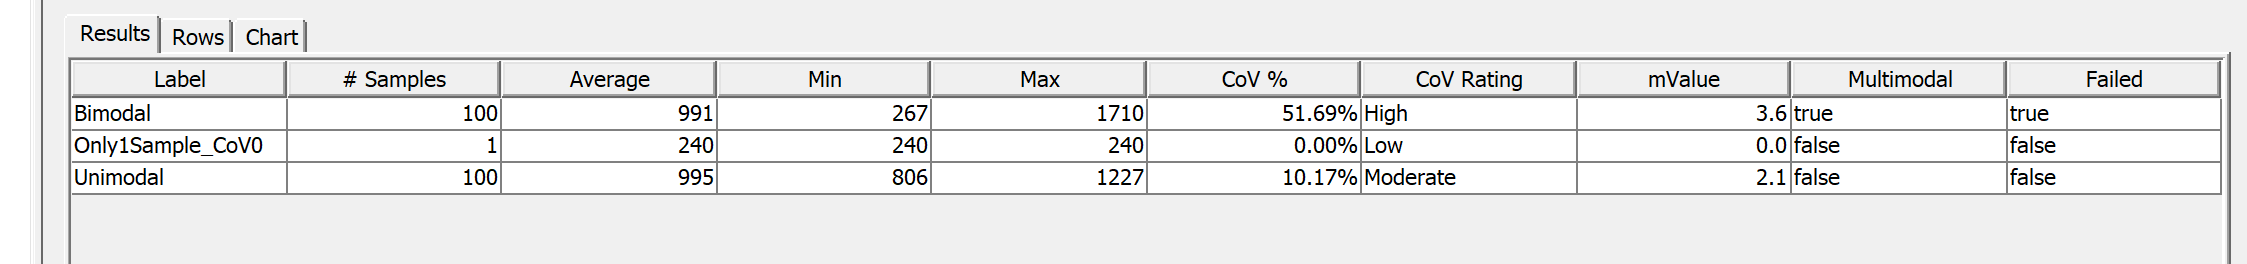
Once multimodality is flagged, you can quickly select the suspicious samplers in the Rows tab and inspect their histograms in the Chart tab to confirm whether the data truly contains multiple modes. For instance, if the bin size is too narrow, the tool may inadvertently report multimodality due to "noise" or minor fluctuations in the data (false positives):
Addressing Multimodal Results
Once you've confirmed multimodality in your test results, there are two main approaches to addres it:
- If the issue is environmental (e.g., network latency): Engage the responsible teams to help resolve the underlying issue.
- If the issue is within your test script: Refactor your test to account for the different modes. For example, if you detect bimodal behavior in a Payment API, you might separate the responses into two different samplers "Payment-Fast" and "Payment-Slow." This allows the statistical results to reflect the system's behavior more accurately.
By separating these modes, you get a clearer understanding of each behavior and can better communicate issues to stakeholders.
Conclusion
Understanding and handling multimodal distributions is critical for accurate performance analysis. When multiple modes exist, the average (mean) may not accurately represent the system's behavior, leading to skewed interpretations of your results.
The new JMeter Modality plugin can automate the detection of multimodality, making it easier to catch issues that might otherwise go unnoticed. By combining its results with a visual inspection, you can mitigate the risk of false positives and arrive at a more reliable assessment of multimodality. Just remember to trim outliers from your data before using the plugin to ensure it can effectively detect multimodal patterns and avoid false negatives.
Opinions expressed by DZone contributors are their own.
Comments