DZone
Thanks for visiting DZone today,
Edit Profile
  • Manage Email Subscriptions
  • How to Post to DZone
  • Article Submission Guidelines
Sign Out View Profile
  • Post an Article
  • Manage My Drafts
Over 2 million developers have joined DZone.
Log In / Join
Please enter at least three characters to search
Refcards Trend Reports
Events Video Library
Refcards
Trend Reports

Events

View Events Video Library

Zones

Culture and Methodologies Agile Career Development Methodologies Team Management
Data Engineering AI/ML Big Data Data Databases IoT
Software Design and Architecture Cloud Architecture Containers Integration Microservices Performance Security
Coding Frameworks Java JavaScript Languages Tools
Testing, Deployment, and Maintenance Deployment DevOps and CI/CD Maintenance Monitoring and Observability Testing, Tools, and Frameworks
Culture and Methodologies
Agile Career Development Methodologies Team Management
Data Engineering
AI/ML Big Data Data Databases IoT
Software Design and Architecture
Cloud Architecture Containers Integration Microservices Performance Security
Coding
Frameworks Java JavaScript Languages Tools
Testing, Deployment, and Maintenance
Deployment DevOps and CI/CD Maintenance Monitoring and Observability Testing, Tools, and Frameworks

Because the DevOps movement has redefined engineering responsibilities, SREs now have to become stewards of observability strategy.

Apache Cassandra combines the benefits of major NoSQL databases to support data management needs not covered by traditional RDBMS vendors.

The software you build is only as secure as the code that powers it. Learn how malicious code creeps into your software supply chain.

Generative AI has transformed nearly every industry. How can you leverage GenAI to improve your productivity and efficiency?

  1. DZone
  2. Refcards
  3. Getting Started With Apache JMeter
refcard cover
Refcard #228

Getting Started With Apache JMeter

Your Open-Source, Pure Java Solution for Load Testing

Pragmatic introduction to the open-source, wildly popular, easily extensible load testing framework. Learn how to build a test plan, follow a typical testing workflow, and interpret results.

Download Refcard
Free PDF for Easy Reference
refcard cover

Written By

author avatar Dmitri Tikhanski
Quality Assurance Engineer,
Table of Contents
► Load Testing Today ► About Apache JMeter ► Getting Started With JMeter ► Building Scripts ► A Typical Workflow ► Reports and Performance Metrics ► Best Practices
Section 1

Load Testing Today

Load testing has changed dramatically in recent years. Today the quality of your testing has a direct impact on your business—you have just three seconds for your website or mobile app to load before you stand to lose up to 40% of your visitors.

These perpetually increasing customer expectations have transformed load testing from an afterthought in the later stages of the release cycle to a vital and integral part of the development process. It’s more important than ever to apply reliable load testing tools and processes to ensure your website or app will perform exactly as expected under all circumstances.

Section 2

About Apache JMeter

Apache JMeter is an open-source tool designed to load test functional behavior and measure performance. It can be used to simulate heavy concurrent load on a network, object, or group of servers to test their strength and analyze their overall performance.

Key Features

100% Pure Java: Runs on Mac, Linux & Windows.
Runs load and performance tests from various types of servers and protocols, including:

  • Web: HTTP, HTTPS

  • SOAP / REST

  • FTP

  • Database via JDBC

  • LDAP

  • Message-oriented middleware (MQ, RabbitMQ, ActiveMQ) via JMS

  • Mail: SMTP(S), POP3(S) and IMAP(S)

  • MongoDB (NoSQL)

  • Native commands or shell scripts

  • TCP

Full Multithreading Framework: For concurrent sampling by multiple threads and simultaneous sampling of different functions by separate thread groups.

Highly Extensible Core:

  • Pluggable Samplers: For unlimited testing capabilities
  • Data Analysis & Visualization Plugins: For extensibility and personalization
  • Scriptable Samplers: Beanshell, BSF, and JSR 223-compatible languages Designed GUI: For faster building and debugging of test plans

Offline analysis/replay of test results

Section 3

Getting Started With JMeter

Installing JMeter

Go to the latest production release (currently Apache JMeter 2.13) JMeter is a pure Java application, so make sure you have the latest 64-bit server JRE or JDK installed.

Scroll down and find the Binary to download to your computer. When completed, move the file to the location you want to install JMeter in, extract the file, navigate to the folder, and go to the bin directory. In that directory, you’ll see a series of scripts which can run JMeter in various modes. Now you have everything you need to start up JMeter and begin working on your test plan.

A few things to note: JMeter 2.13 contains all the files you need to build and run most types of tests, including Web (HTTP & HTTPS), JDBC, Java, JUnit, FTP, etc. There are some exceptions when it comes to JDBC and JMS testing. Check the Apache JMeter website for full details.

Plugins extend JMeter in many useful ways. The largest repository is at jmeter-plugins.org/. See jmeter-plugins.org/wiki/Start for more details.

Note: Mac OS X users can quickly install JMeter and all common plugins in a single step with Homebrew: brew install jmeter --with-plugins

About Test Plans

To launch JMeter, switch to the “bin” directory and type the following:

  • For Mac/Linux/Unix: ./jmeter.sh

  • For Windows: jmeter.bat

Once launched, you’ll see an empty test plan.

Image title

If you don’t see the JMeter GUI, make sure you set the following:

  • The JAVA_HOME environment pointing to the JRE or JDK installation folder

  • The JAVA_HOME/bin folder added to the PATH environment variable

A test plan is basically the specification of the overall test settings and an outline of the steps that JMeter should execute when it runs. You can give it a name and add a comment for your own reference. To create a complete test plan, you’ll need to set up one or more Thread Groups and Samplers. It’s also best practice to add Timers, Configuration Elements, Assertions, and Listeners. All of these components can be added and set up within the test plan before you run it. To do this, right click on the name of your test plan, select Add, and choose the component you want to set up and configure.

Image title

Here’s a quick explanation of each component:

Thread Groups: This is where you specify the number of users that you want JMeter to simulate when executing the test plan (one thread = one simulated user). You can also set the Ramp-up Period to tell JMeter how long it should take to reach the full number of threads chosen and the Loop Count—the number of iterations for each user in the group.

Timers: The timer sets the duration of the delay between one request to the other (e.g. navigating from the homepage to the pricing page).

Configuration Elements: These allow you to manage certain elements (such as the cache and cookies) during the scope of the test. In order to simulate a browser’s behavior, it’s best practice to add an “HTTP Cache Manager” and an “HTTP Cookie Manager,” which work autonomously.

Samplers: The samplers perform the actual work in JMeter. Every sampler (except for Test Action) generates requests that ultimately receive a response that can be viewed in the Listeners. All results have attributes (such as elapsed time, data size, success/fail, etc.). The most commonly used sampler is the HTTP Request.

Assertions: Assertions allow you to define the pass/fail criteria for your test. For example: let’s say you want to set the maximum duration in milliseconds in which a test sample will be considered a “pass.” You can set a Duration Assertion which will ensure that if any response lasts longer than the value specified, the sample will be marked as “failed.”

The Response Assertion is by far the most popular, and covers 99% of your needs. You can apply this assertion to test the response body, URL, headers, messages, initial responses, and/or embedded resources/redirects. It allows you to test regular expressions rather than text patterns—which gives far more f lexibility. JMeter’s regular expression handling is much like Perl, except that you do not enclose the expression in //’s.

JMETER ASSERTIONS: NAMES AND USAGE

Response Assertion

Covers 99% of your needs. Can be applied to test the response body, URL headers, messages, single requests, subrequests, and more. Allows you to test Regular Expressions rather than text patterns—giving far more flexibility.

Duration Assertion

Checks whether a response’s duration is less than a predetermined time period (in milliseconds). If it doesn’t fall within the scope, it will be marked as failed.

Size Assertion

Measures whether the response size matches the anticipated size in bytes.

XML Assertion

Checks the response for XML compliance.

Beanshell Assertion

Allows you to execute Beanshell code and conditionally set the response status.

MD5Hex Assertion

Calculates the response’s MD5 checksum and compares it to the expected value. Very handy for checking huge responses.

HTML Assertion

Checks whether the response is valid HTML with the JTidy parser.

XPath Assertion

Determines whether the response is valid XML and checks DTD schema compliance. Can also be used to ensure that the response has at least one match of an XPath query.

XML Schema Assertion

Validates the response against the XSD schema.

BSF Assertion

Allows the execution of arbitrary code in any language supported by the Apache Bean Scripting Framework (BSF).

JSR223 Assertion

Allows the execution of arbitrary code in any language supported in the Java Community Process Specification Request 223.

Compare Assertion

Compares the results of requests; rarely used, as it consumes a lot of resources and has a low number of potential use cases.

SMIME Assertion

Checks that the response from the Mail Reader Sampler is signed.


Listeners: These enable you to view the results of a sampler. These results can be viewed as a tree, table, graph, or log file. You can add Listeners anywhere in the test, just be aware that they will only collect data from elements on the same level or below.

The most commonly used Listener is the View Results Tree. This includes details on the requests and responses and presents all the test plan results in a tree structure. Other listeners include the Aggregate Report, Assertion Results, and Beanshell Listener.

Section 4

Building Scripts

Using the HTTP(S) Script Recorder

You don’t have to manually build your scripts. You can use the JMeter Proxy to record the actions that a user will perform on key paths in your application. Then you can replay these actions at scale for your performance tests. For example: on a retail site, you can record the actions of a user searching for an item, adding it to the cart, and going through the checkout process. Then you can test it at scale.

There are three steps for configuring JMeter’s recording processes:

  1. Set up a Recording Controller in a New Thread Group
    You need to create a place to capture the recorded interactions. To do this, go to the test plan and set up a thread group by selecting Add > Threads (Users) > Thread Group.
    When you’re there, select Add > Logic Controller > Recording Controller.

  2. Set up the HTTP(S) Test Script Recorder Proxy in the Workbench
    Add the HTTP(S) Test Script Recorder. Since the recording proxy is not part of the script logic, put it in the WorkBench section of the script by clicking Add > Non-Test Elements > HTTP(S) Test Script Recorder.

    The recorder has loads of options, including the ability to filter out images, style sheets, and JavaScript files. It’s not essential to capture these elements, and you can keep the script clean by excluding these URL patterns. To do this, just enter the URL pattern you want to exclude and click the Add Suggested Excludes button underneath.Image titleNote: As a more convenient alternative, you can also use the Recording template. To do this, go to: File > Templates > Recording > Create.

  3. Configure Your Browser to Send Traffic Through the Proxy
    Now configure your browser to capture your actions. Firefox is one of the easiest browsers to use, as it has a standalone proxy configuration option. Here’s what you should do:

  • Type “about: preferences” in the Firefox address bar to open the control panel.

  • Click Advanced in the sidebar and select the Network tab.

  • Click the Settings button next to “Configure how Firefox connects to the Internet.” This will open the proxy controls.

  • Go back to JMeter and take note of the port setting in the HTTP(S) Test Script Recorder.
    Image title

  • Go back to Firefox and add localhost and that same port number in the Manual Proxy Configuration.

Congratulations! You’re now in recording mode. Now browse the site that you want to test, taking all the actions that a user would take (e.g. Homepage > Pricing > Checkout). All these actions are placed into the Recording Controller—and this becomes your test script.

When you’re done, just return to JMeter and click the Stop button in the HTTP(S) Test Script Recorder. Don’t forget to save the script by clicking File > Save Test Plan and giving it a name.

Section 5

A Typical Workflow

Once you’ve setup your test plan (as outlined above), you’ll probably want to follow a two step process:

  1. Run a test in the GUI mode with a single/low thread count and listeners added and enabled. This will enable you to check that it’s operating as desired and troubleshoot if necessary.
  2. Run from the non-GUI command line mode with listeners disabled or removed (as outlined below).

Running JMeter

Running Your First Load Test in Non-GUI Mode

You can run a JMeter test from a single machine or in distributed mode.

Running a Test from a Single Machine

The JMeter GUI is designed for developing and debugging tests, so it’s inadvisable to run a high-volume load test here. Always use the non-GUI command line mode to run the test itself. Here’s the format you should use:

jmeter -n -t /path/to/test_script.jmx -l /path/to/test_results.jtl

Tip: Make sure you disable all listeners when running the tests, as many of them use up a lot of memory. You can open the test_results.jtl file with the listener of your choice after the test ends.

COMMAND LINE SHORTCUTS

-n

Specifies JMeter is to run in non-gui mode

-t

The name of the JMX file that contains the Test Plan

-l

The name of JTL file to log the sample results on

-j

The name of the JMeter run log file

-R

The list of remote servers (run the test in the specified remote servers)
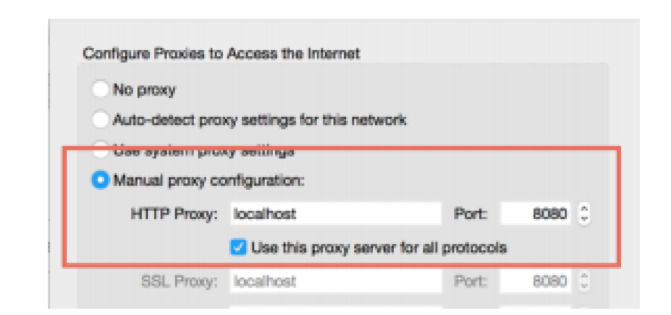
-H

The proxy server hostname or IP address

-P

The proxy server port

Running a Distributed JMeter Test

Sometimes a single JMeter host doesn’t have enough CPU or RAM to create the required load. In such cases, you have two options:

  1. Local Area Network (LAN)-Based Tests
    Here you launch JMeter in a clustered mode. In this mode, you have the:

    • Master: the system running the JMeter GUI, which controls the test.
    • Slave: the system running the JMeter server. This takes commands from the GUI and sends requests to the target system.
    • Target: the webserver you’re stress testing.

    The master controller initiates the test on multiple slave systems. View the step by step guide here: http://jmeter.apache.org/ usermanual/jmeter_distributed_testing_step_by_step.pdf.

    But there are problems with this method; the number of JMeter “Slaves” you have is limited by the number of physical or virtual machines in your intranet. For this reason, many users opt for the unlimited scalability of cloud-based distributed testing.

  2. Cloud-Based Tests

    If you want unlimited scalability, you need to find a way to run JMeter in the cloud.

    The benefits here are that you can run hundreds of load and performance tests in parallel, and at a massive scale, from geographically distributed users.

    Although this isn’t offered within JMeter itself, it’s easy to find cloud- testing platforms and companies that enable full integration with the open source tool. Just search for JMeter in the Cloud and see.

Starting the Test

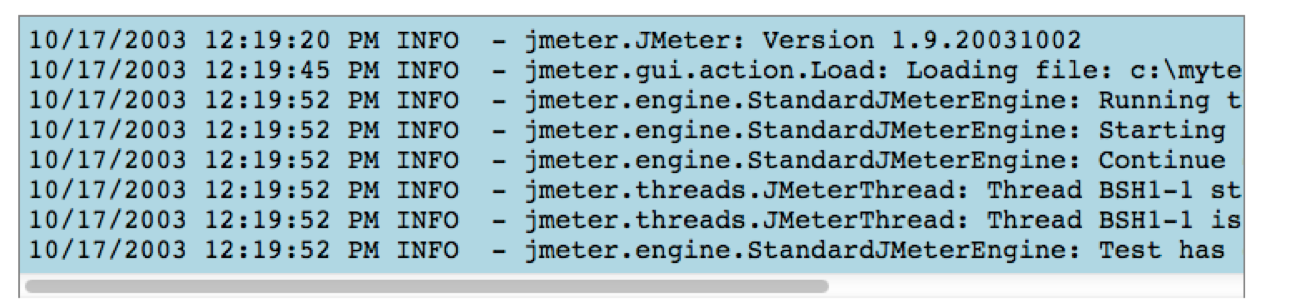
Now you can start load testing! To double-check the slave systems are working, open up JMeter.log in notepad. If it’s working correctly, you should see the following in the log:

Jmeter.engine.RemoteJMeterEngineImpl:Starting backing engine

Logging and Error Messages

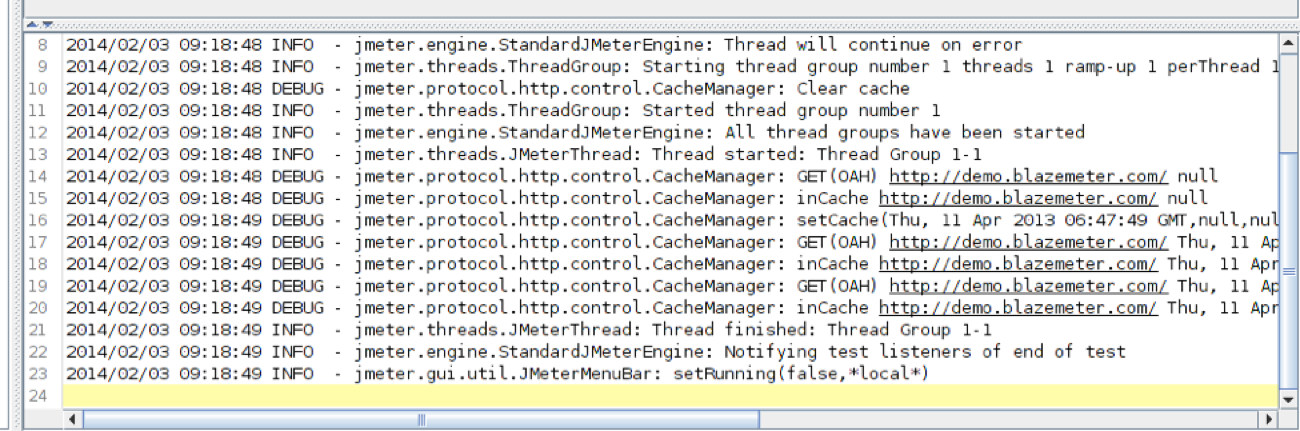
All application-level audit entries go into the JMeter log file—the main source of troubleshooting information. To view the log file, go to Options > Log Viewer. You’ll see this in the bottom pane on the main JMeter window. If you’re in GUI mode, you’ll see the number of error messages in the top-right corner. The log file also records information about the test run and can be very useful when determining the cause of an error.

A Typical JMeter Log File

Image title

Errors in the JMeter test itself (such as Assertions failures) are shown in the JTL log file. You can also see these in a more user-friendly format in the Listener that you set up (For example: the View Results Tree Listener).

It’s important to set the actions you want JMeter to take if there’s an error. To do this, go to your thread group, and you’ll see an option called “Actions to be taken after a Sampler Error.” Here you can choose to continue with the test, start the next thread loop, stop the thread, stop the test, or stop the test now.

Debugging

You could argue that debugging is one of the most important software development practices. If software doesn’t work immediately upon coding, you need to detect bugs and fix them.

Here are a few useful JMeter debugging methods:

Real Time Sampler/Expression Debugging

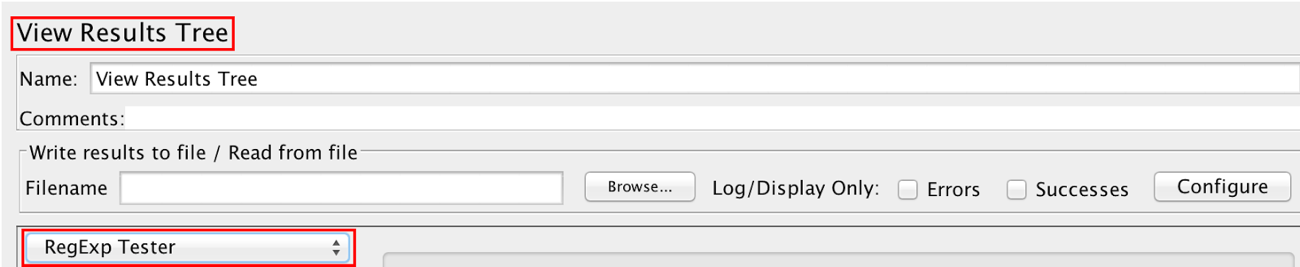
Testing an expression with the RegExp Tester (which is in the View Results Tree Listener) shows you that the expression is correct and will work when you run a test. However, sometimes a test will run well with the RegExp Tester but won’t work when you run the actual test. This is usually due to dynamic content.

Image title

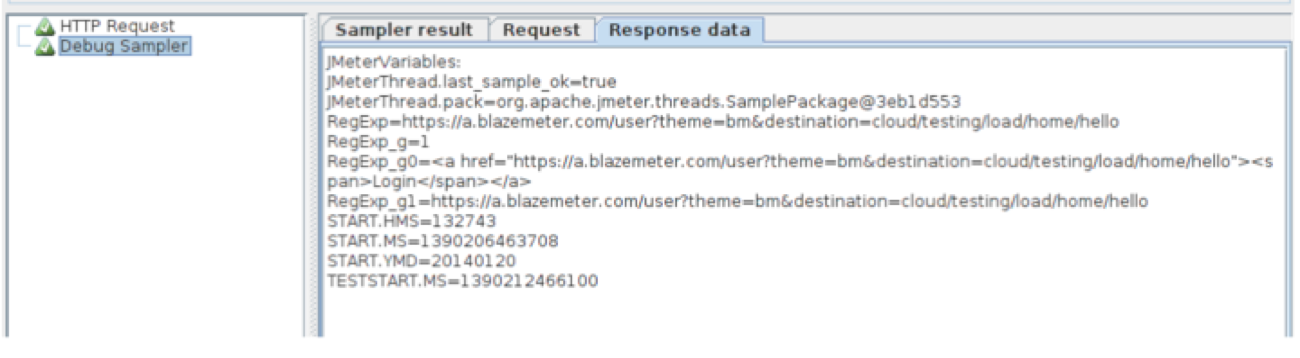
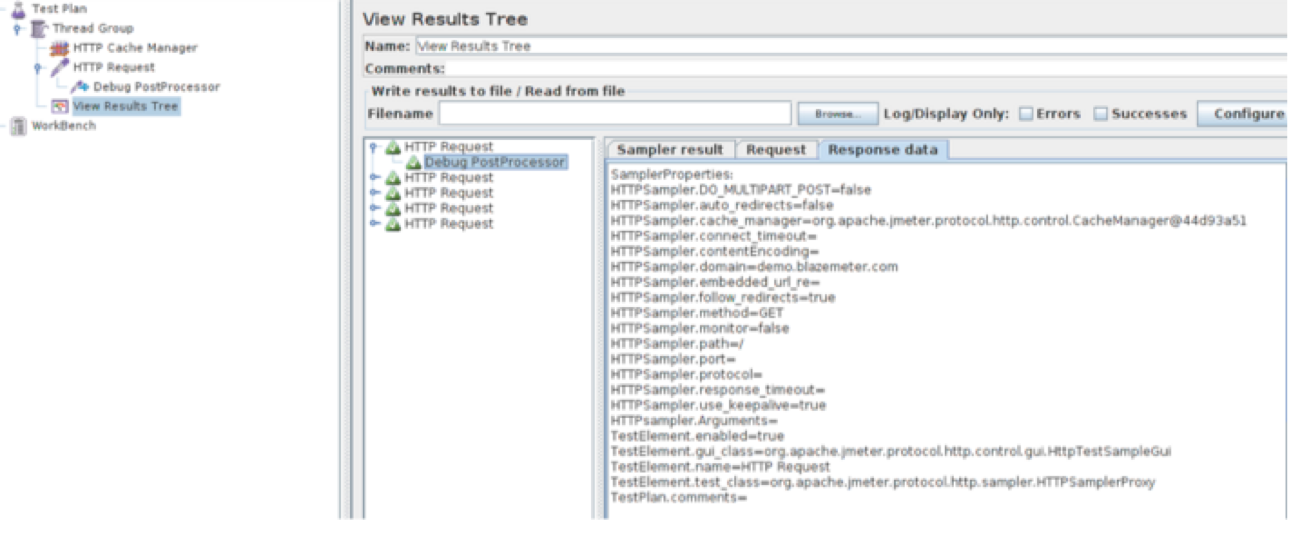
In such cases, it’s easy to find the problem with the Debug Sampler. Just add the Debug Sampler before View Results Tree and run the test. After the test is completed, open up View Results Tree and select Debug Sampler.

Image title

The Debug Sampler has three options:

  1. JMeter Properties
  2. JMeter Variables
  3. System Properties

JMeter Variables should be true to debug Post Processors. If you want to debug a sampler, you need to add “Debug PostProcessor” as a child item. This prints sampler properties, which will help you find the actual problem in the sampler.

Image title

Debugging With Fake Sampler Generation

The Dummy Sampler is a plugin that can generate fake samplers with defined values. This sampler is useful when you have very complex scripts, or when running a test will take you too much time. You just need to copy and paste “Response data” into the Dummy Sampler. When you run the test, the Dummy Sampler will generate a sampler with the pasted response data.

Create a new test and add “Thread Group,” “jp@gc - Dummy Sampler,” and “View Results Tree.” Before running it, increase the number of users and run the test.

Image title

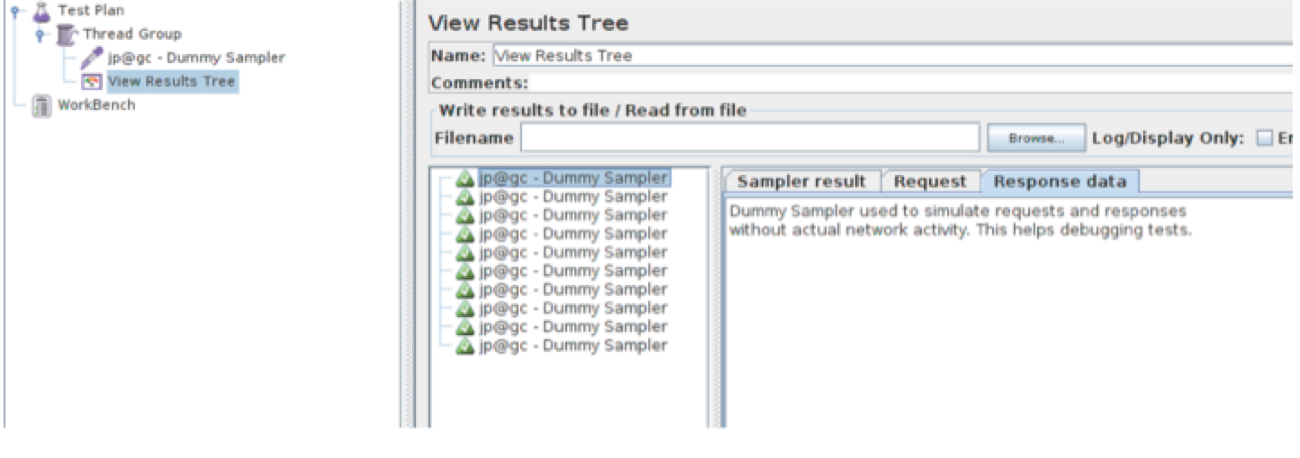
With this plugin, you can choose to view the latency, response time, response code, and response data—without any network activity.

Debugging JMeter Elements

You can debug all the items in the test tree by printing the debug log. Here’s how:

  1. Uncomment jmeter.loggerpanel.display=true in the jmeter.properties file. This change will open a log viewer every time JMeter is started.
  2. In the test tree select any item that you want to see the debug information for.
  3. Click the Help menu and then Enable debug. Run the test to see the debug information.
  4. Create a simple test with “HTTP Request” and add “HTTP Cache Manager.” Select HTTP Cache Manager click Help > Enable debug. Click Options > Log Viewer to see the log message. Now change the loop count to three and run a test.

Image title

You’ll now be able to see the debug log of the HTTP Cache Manager in the Log Viewer. To disable printing the debug information, select HTTP Cache Manager and click Help > Disable debug.

Configure JMeter

If you want to modify your JMeter properties, you should modify user.properties in the /bin directory. Alternatively, you can create your own copy of jmeter.properties and then specify it in the command line.

Parameterization

It’s vital that your load-testing tool can read dynamic data from external sources. If you’re testing the system with a large number of users, you need to make sure that JMeter can handle different types of external data inputs and pass the extracted data to the virtual users’ threads. Parameterization allows you to run load tests with dynamic data.

Instead of hard-coding certain parameters in the test plan, you can make your JMeter test-data-driven by populating the properties and variables from various sources, including:

  • The command-line arguments or properties’ files (e.g. you set the application under test host as “jmeter -Jhost=www.example.com” and access it as “${__P(host,)}” in the HTTP Request samplers)
  • The CSV files via the CSV Data Set Config test element of the CSVRead() function
  • Arbitrary file types via the FileToString() or StringFromFile() functions
  • Databases via JDBC test elements

Correlations

Dynamic data like those mentioned above (and more) often cause problems in your script—even if your app appears to be functioning properly. With JMeter, there are three steps you need to take for each value you need to parameterize:

  1. Identify the Value. With every request you capture in a JMeter recording, the request parameters are presented clearly in a text box—and they are often labeled something like “auth-token” or their value is a long string of random alphanumeric characters, like “h83ke0d8kgb8xow9cxynb84jSK.”
  2. Find Out Which Requests Issue the Value. For example: an authentication token is probably issued in the response to the login request. However, it’s not always the immediately preceding request that issues the value. In such cases, take a look at JMeter’s Results Tree to inspect the responses.
  3. Use a Regular Expression Extractor with a pattern that matches the expected content. Taking the example above, this might appear in the text as: <auth-token=“h83ke0d8kgb8xow9cxynb84jSK”>, in which case one easy regex would be “auth-token=(.*)”>. The parentheses tell JMeter to retain the value found inside them, and then places that value into the Reference Name you supplied for the extractor, which we may call something like “authenticity_token.”

Image title

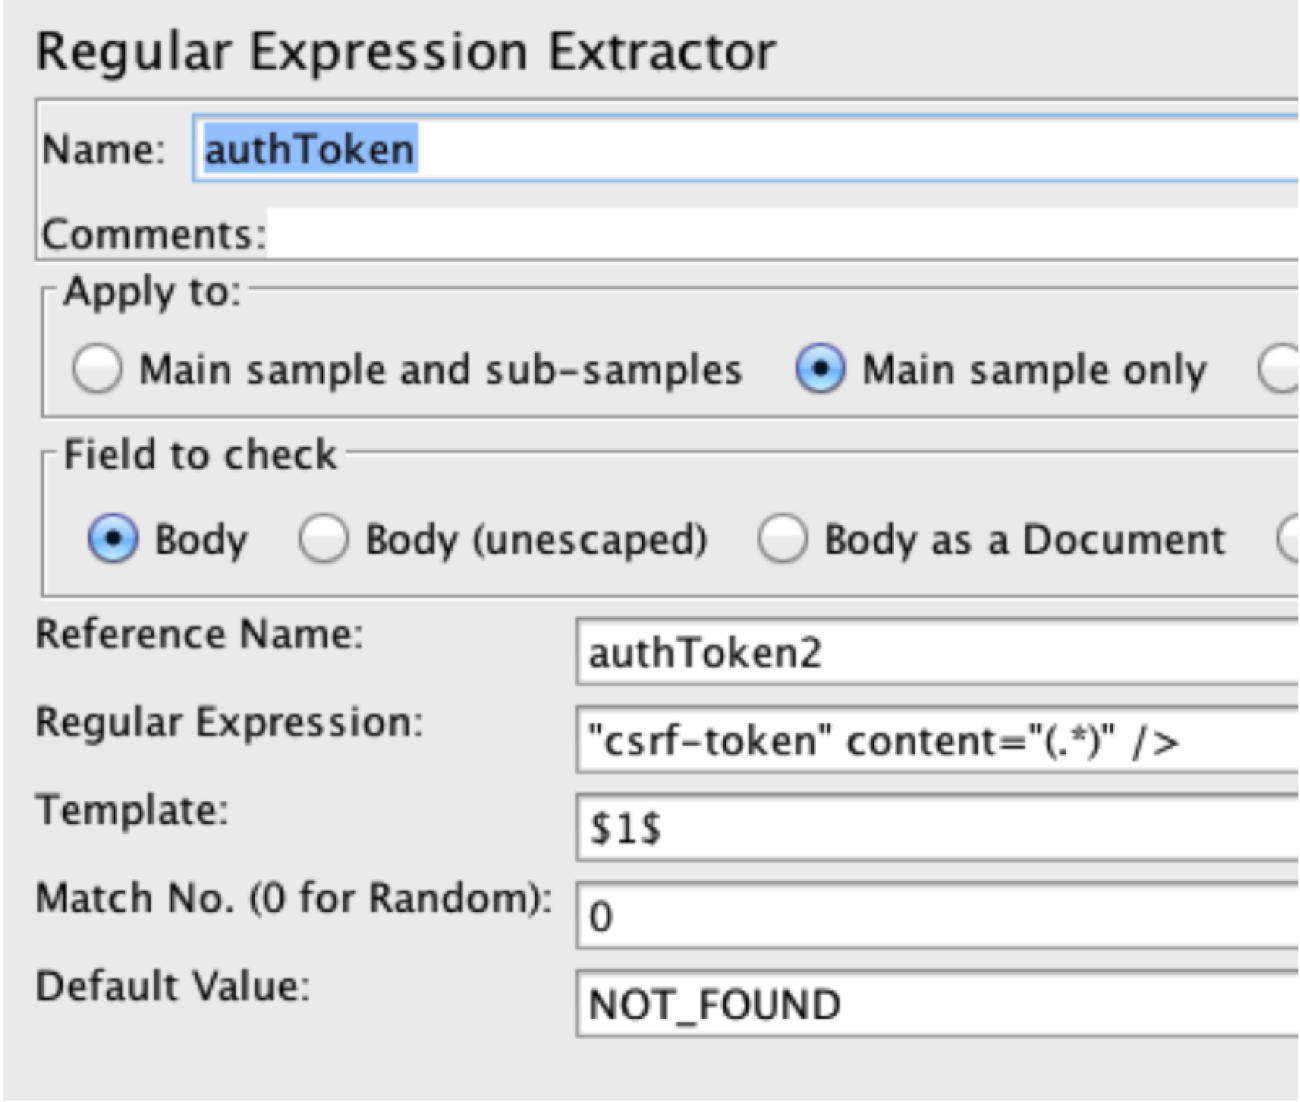
The JMeter variable format would then be ${authenticity_token}, so you finally go and replace the original captured value wherever it appears in subsequent requests with the variable, and you’re good to go.

Section 6

Reports and Performance Metrics

For an overview of the summary statistics— such as the total number of requests executed, failures percentage, throughput in requests/time, and KB/second—use the JMeter Aggregate Report Listener.

Here’s how:

  1. Open the JMeter GUI.
  2. Add the Aggregate Report Listener (it can be added everywhere).
  3. Click the Browse button in the listener and locate your .jtl test results file.

Performance Metrics and Their Explanations

Label

The label of the sample. If "Include group name in label?" is selected, then the name of the thread group is added as a prefix. This allows identical labels from different thread groups to be collated separately if required.

# Samples

The number of samples with the same label.

Average

The average time of a set of results.

Median

The time in the middle of a set of results (i.e. 50% of the samples took no more than this time; the remainder took at least as long).

90% Line

90% of the samples took no more than this time. The remaining samples at least as long as this.

Min

The shortest time for the samples with the same label.

Max

The longest time for the samples with the same label.

Error %

The percentage of requests with errors.

Throughput

The Throughput is measured in requests per second/minute/ hour. The time unit is chosen so that the displayed rate is at least 1.0. When the throughput is saved to a CSV file, it is expressed in requests/second (e.g. 30.0 requests/minute is saved as 0.5).

KB/Sec

The throughput measured in Kilobytes per second.

Section 7

Best Practices

That’s it—you’re almost ready to start testing! Just a few more things to bear in mind:

Ask Yourself These Key Questions

  1. What do we expect the normal load (average number of users) to be?
  2. What is our peak number of users likely to be?
  3. What days and times should we load test our applications (e.g. if the testing crashes our servers, when will it affect the least number of people)?
  4. What are we trying to achieve?

Follow These Best Practices

  1. Always Use the Latest JMeter Version
  2. Use the Correct Number of Threads
  3. Use the Non-GUI Mode to Run Large Scale Tests
  4. Add the Cookie Manager (unless your app specifically doesn’t use cookies)
  5. Filter Out Irrelevant Requests When Using the HTTP(S) Test Script Recorder
  6. Include User Variables
  7. Reduce the Drain on Resources
    For example: use the non-GUI mode, use fewer Listeners, only use Listeners while scripting and debugging, use CSV output rather than XML, only save the data you need, and use as few Assertions as possible.
  8. Avoid Scripting Wherever Possible.
    Try using JMeter’s built-in test elements and functions. If you have to script, use the JSR223 test elements and the Groovy language.
  9. Parameterize Tests
  10. Don’t Modify the JMeter.properties File
    Copy the property from jmeter.properties and modify its value in user.properties. This will make it easier for you to migrate to the next version of JMeter.

Like This Refcard? Read More From DZone

related article thumbnail

DZone Article

JMeter's Dummy Sampler - The Ultimate Guide
related article thumbnail

DZone Article

Using JMeter's Throughput Shaping Timer Plugin
related article thumbnail

DZone Article

How to Use the JSON Plugin in JMeter
related article thumbnail

DZone Article

JMeter's Weighted Switch Controller: The Ultimate Guide
related refcard thumbnail

Free DZone Refcard

Full-Stack Observability Essentials
related refcard thumbnail

Free DZone Refcard

Getting Started With Log Management
related refcard thumbnail

Free DZone Refcard

Observability Maturity Model
related refcard thumbnail

Free DZone Refcard

Getting Started With OpenTelemetry

ABOUT US

  • About DZone
  • Support and feedback
  • Community research
  • Sitemap

ADVERTISE

  • Advertise with DZone

CONTRIBUTE ON DZONE

  • Article Submission Guidelines
  • Become a Contributor
  • Core Program
  • Visit the Writers' Zone

LEGAL

  • Terms of Service
  • Privacy Policy

CONTACT US

  • 3343 Perimeter Hill Drive
  • Suite 100
  • Nashville, TN 37211
  • support@dzone.com

Let's be friends: