MongoDB Performance Monitoring Using the ELK Stack
Keep an eye on your database's performance with this guide to setting up monitoring via the ELK Stack
Join the DZone community and get the full member experience.
Join For Free
mongodb, one of the most popular nosql databases today, is designed to support massive amounts of data processing and storage. the tool is used by many well-known modern it organizations such as facebook, ebay, foursquare, and expedia. monitoring is a critical component of all database administration, and tight monitoring of your mongodb cluster will allow you to assess the state of your database. however, due to its complex architecture, which allows for virtually unlimited scaling, monitoring is a challenging task.
in this article, we will explain how to collect and analyze some of the mongodb metrics using the elk stack so that you can keep a close eye on your mongodb performance and growth.
mongodb metrics to track
in this article, we will use the latest version of mongodb (version 3.2) and focus on metrics that are available using the wiredtiger storage engine . this is currently mongodb 3.0's default storage engine. we will focus on tracking and metric analysis to get an overview of database performance, resource utilization, and saturation. these are accessible using mongodb commands.
throughput
mongodb (with the wiredtiger storage engine) provides several commands that can be used to collect metrics using mongo shell . mongo shell is an interactive javascript interface for mongodb that allows you to query data and take administrative actions.
one of the rich commands that provides a lot of information about items, including operations, connections, journaling, background flushing, memory, locking, asserts, cursors, and cache, is the serverstatus (i.e., db.serverstatus()) .
these throughput metrics are important as they can be used to avoid many performance issues, such as resource overloading. to get a general overview of your mongodb cluster activities, you should first look at the number of read/write clients and the number of database operations that they perform. these metrics can be retrieved using serverstatus opcounters and globallock objects.
the objects' output is in json, shown in the example below:
"opcounters":{
    "insert":0,
    "query":1,
    "update":12,
    "delete":5,
    "getmore":0,
    "command":23
    }
the opcounters.query and opcounters.getmore commands return metrics that indicate the number of read requests received from the time the mongod (a process that handles data requests and manages data access) instance last began. on the other hand, opcounters.insert, opcounters.update, and opcounters.delete return the number of write requests received.
by monitoring the number of read and write requests, you can quickly prevent resource saturation as well as spot bottlenecks and the root cause of overloads. in addition, these metrics will allow you to assess when and how you need to scale your cluster.
as shown above, globallock is a document that reports on the database's lock state and can provide you with information regarding read/write request statuses. these will allow you to check if requests are accumulating faster than they are being processed. the same applies to activeclients.readers and activeclients.writers. these can enable you to learn about the relationship between the amount of current active clients and your database load.
"globallock": {
   "totaltime": numberlong(254415000),
   "currentqueue": {
       "total": 0,
       "readers": 0,
       "writers": 0
        },
   "activeclients": {
        "total": 8,
        "readers": 0,
        "writers": 0
        }
    }
…
performance and failover
using a replica set (a master-slave replication that facilitates load balancing and failover) is a must to ensure your production robustness. the oplog (operations log) is the main component of the mongodb replication mechanism. below, you can see the relevant metrics that can be retrieved using the getreplicationinfo and replsetgetstatus commands.
as shown below, replica set member statuses are composed of a few indications such as the replica state and optimedate field, which is important for calculating the replication lag metric that contains the date when the last entry from the oplog is applied to that member):
...
"members" : [
    {
        "_id" : 0,
        "name" : "<host1>",
        "health" : 1,
        "state" : 1,
        "statestr" : "primary",
        "uptime" : 250,
        "optime" : {
            "ts" : timestamp(1447946570, 1),
            "t" : numberlong(1)
            },
        "optimedate" : <date>,
        "infomessage" : "could not find member to sync from",
        "electiontime" : <timestamp>,
        "electiondate" : <date>,
        "configversion" : 1,
        "self" : true
        },
    {
        "_id" : 1,
        "name" : "<host2>",
        "health" : 1,
        "state" : 2,
        "statestr" : "secondary",
        "uptime" : 13,
        "optime" : {
            "ts" : timestamp(1447946549, 1),
            "t" : numberlong(-1)
            },
        "optimedate" : <date>,
        "lastheartbeat" : <date>,
        "lastheartbeatrecv" : <date>,
        "pingms" : numberlong(0),
        "configversion" : 1
        },
    {
        "_id" : 2,
        "name" : "<host2>",
        "health" : 1,
        "state" : 2,
        "statestr" : "secondary",
        "uptime" : 13,
        "optime" : {
            "ts" : timestamp(1447946549, 1),
            "t" : numberlong(-1)
            },
        "optimedate" : <date>,
        "lastheartbeat" : <date>,
        "lastheartbeatrecv" : <date>,
        "pingms" : numberlong(0),
        "configversion" : 1
        }
    ]
…
resource utilization
one of the most important metrics is the number of client connections. this includes current active connected clients and the unused connections as well. these can be reported using serverstatus :
...
"connections": {
    "current": 1,
    "available": 818,
    "totalcreated": numberlong(4)
    }
...
an unexpected rise in the client connections metric can occur if the connection is not handled well or if there is an issue inside of the mongodb driver that is used for handling the connection. tracking the behavior of these metrics will allow you to set the relevant summary metrics.
another set of very important metrics is related to storage. these can be be retrieved using the db.stats() command, which will return statistics for the selected database. running it using the mongo shell to get statistics on the database test_mongo_db looks like this:
mongo test_mongo_db --eval "db.stats()"
{
    "db": "test",
    "collections": 1,
    "objects": 1,
    "avgobjsize": 40,
    "datasize": 40,
    "storagesize": 4096,
    "numextents": 0,
    "indexes": 1,
    "indexsize": 4096,
    "filesize": 0,
    "ok": 1
    }
monitoring datasize, indexsize, or storagesize metrics will show you the change in physical memory allocation and will help you to keep your cluster healthy with enough storage to serve your database. on the other hand, a large drop in datasize can also indicate that there are many requested deletions, which should be investigated to confirm that they are legitimate operations.
the following metrics that should be monitored are the memory metrics using serverstatus . the interested tuple of metrics is virtual memory usage, which is located in the mem.virtual property (in mb), and the amount of memory used by the database, which is located in the mem.resident property (in mb). similar to the storage metrics, memory metrics are important to monitor because overloading ram memory within your server(s) is never good. this can lead to the slowing or crashing of your server, which will leave your cluster weakened. or, even worse, if you have only one dedicated server, mongodb can dramatically slow down or even crash.
another important set of metrics is located in the extra_info.page_faults property of the serverstatus output: the number of page faults or the number of times mongodb failed to get data from the disk.
"mem": {
    "bits": 64,
    "resident": 82,
    "virtual": 245,
    "supported": true,
    "mapped": 0,
    "mappedwithjournal": 0
    }
"extra_info": {
"note": "fields vary by platform",
"heap_usage_bytes": 59710000,
"page_faults": 1
}
collecting and monitoring using elk
in this section, we will describe how to ship, store, and monitor your mongodb performance metrics detailed above using the logz.io elk stack .
we will use the ubuntu server 16.04 on amazon cloud. you can also read our step-by-step article if you would like to know how to install and configure the elk stack on amazon cloud .
extracting the mongodb metrics
in the next step, we will demonstrate how to ship metrics to elasticsearch with logstash. using some programming to retrieve metrics will give you better control and allow you to run complex pre-shipping actions.
to ship logs, we will create a logstash configuration file with the input path, including how to interpret it and where to send it. learn more about logstash configuration here .
before we create the logstash configuration file, we will describe how to retrieve the mongodb metrics specifically — using the mongo shell interface via the bash of your os.
if we want to execute the serverstatus command via our terminal, without staying in the mongo shell program, we can use –eval flag of the mongo shell program as follows:
mongo --eval "db.serverstatus()"
and the output:
mongodb shell version: 3.2.7
connection to: <db>
{
    <the json objects>
    }
so, our command will look like this:
mongo --eval 'db.serverstatus()' | tail -n +3
next, we want to remove the numberlong(x) and isodate(x) from the json file. again, sending these to logstash will trigger a json parsing exception, and storing in elasticsearch will fail. to transform the stream of the text, we will use the sed command with a regex pattern that will find numberlong and isodate data types. it will then replace it with the arguments that exist inside these data types:
{
    ….
    "localtime": isodate("2016-06-23t16:43:19.105z"),
    …
    "connections": {
        ….
        "totalcreated": numberlong(62)
        …
        }
    }
now, using the pipeline command and adding the piece for transforming the text, the final command will look as follows:
mongo --eval 'db.serverstatus()' | tail -n +3 | sed 's/\(numberlong([[:punct:]]\?\)\([[:digit:]]*\)\([[:punct:]]\?)\)/\2/' | sed 's/\(isodate(\)\(.*\)\()\)/\2/'
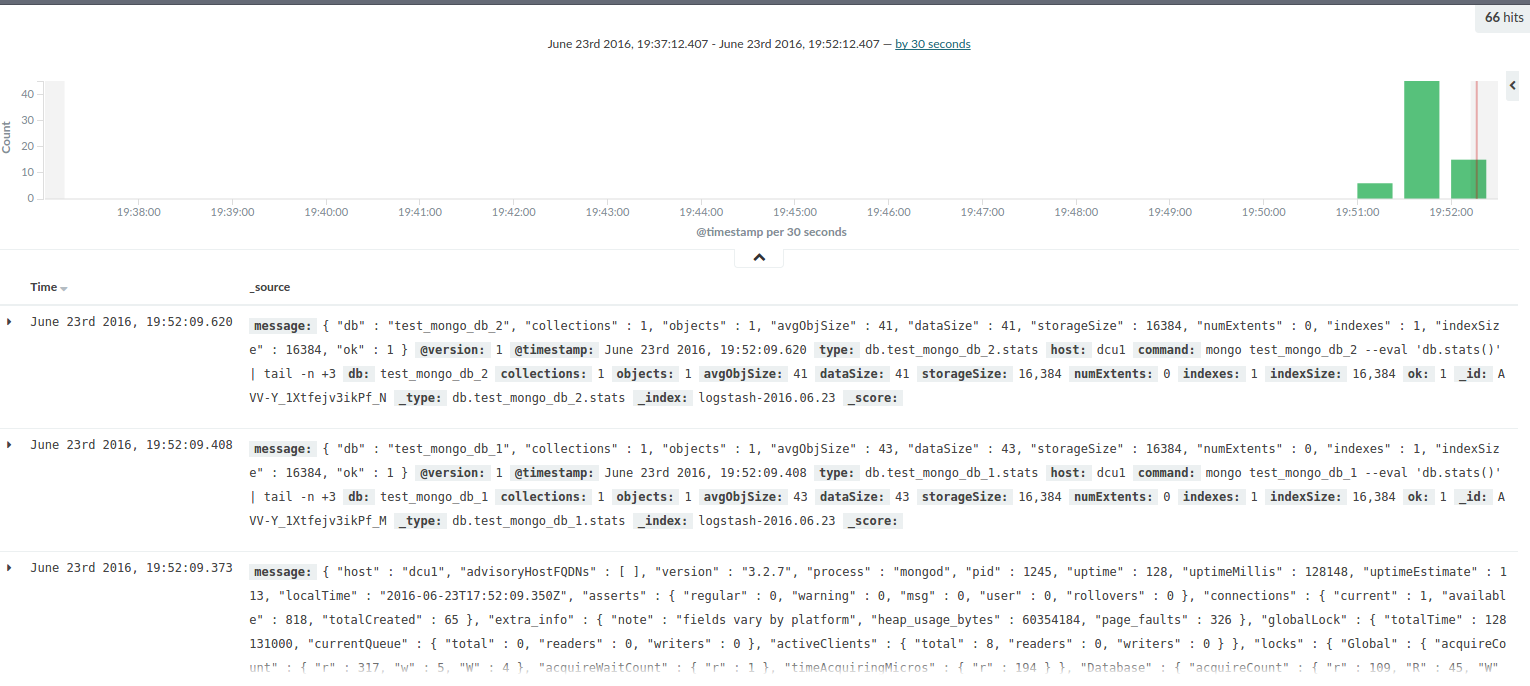
in addition to the serverstatus command, we will also use the db.stats() command to gather storage metrics for specific databases. for the purpose of this tutorial, we created two databases for which we want to monitor storage allocation with the names test_mongo_db_1 and test_mongo_db_2 .
again, we will use the commands for gathering storage statistics for these two databases together with pipeline and tail commands to comply with the json formatting rules:
mongo test_mongo_db_1 --eval "db.stats()" | tail -n +3

mongo test_mongo_db_2 --eval "db.stats()" | tail -n +3
configuring logstash
next, we will take the created commands from above and place them in the logstash configuration file (logstash.config) using the exec input plugin. to forward the data to elasticsearch, we will use the elasticsearch output plugin :
input {
    exec {
        command => "mongo --eval 'db.serverstatus()' | tail -n +3 | sed 's/\(numberlong([[:punct:]]\?\)\([[:digit:]]*\)\([[:punct:]]\?)\)/\2/' | sed 's/\(isodate(\)\(.*\)\()\)/\2/'"
        interval => 7
        type => "db.serverstatus"
        }
    exec {
        command => "mongo test_mongo_db_1 --eval 'db.stats()' | tail -n +3"
        interval => 7
        type => "db.test_mongo_db_1.stats"
        }
    exec {
        command => "mongo test_mongo_db_2 --eval 'db.stats()' | tail -n +3"
        interval => 7
        type => "db.test_mongo_db_2.stats"
        }
    }
filter {
    json {
        source => "message"
        }
    }
output {
    elasticsearch {
        hosts => ["localhost:9200"]
        }
    }
we're now going to start the logstash configuration using the next command:
./bin/logstash -f logstash.config
shipping to logz.io using logstash
logz.io provides the elk stack as an end-to-end service so that the logs that you send to us are indexed and stored in elasticsearch and available in real-time through kibana.
while we support a wide range of techniques for shipping the logs (available under the log shipping section in the ui), in the next section i will explain how to use our logstash integration to ship mongodb logs into logz.io.
in the logz.io ui, select the log shipping tab located at the top of the page, and under the platforms menu on the left, select the logstash item.
on the right, you will see what needs to be added to the current logstash configuration to send logs to logz.io. two additional changes are required: one is adding token through the filter plugin , and the second is changing the output, where the elasticsearch output is replaced with tcp pointing to the listener.logz.io server in charge of processing incoming logs.
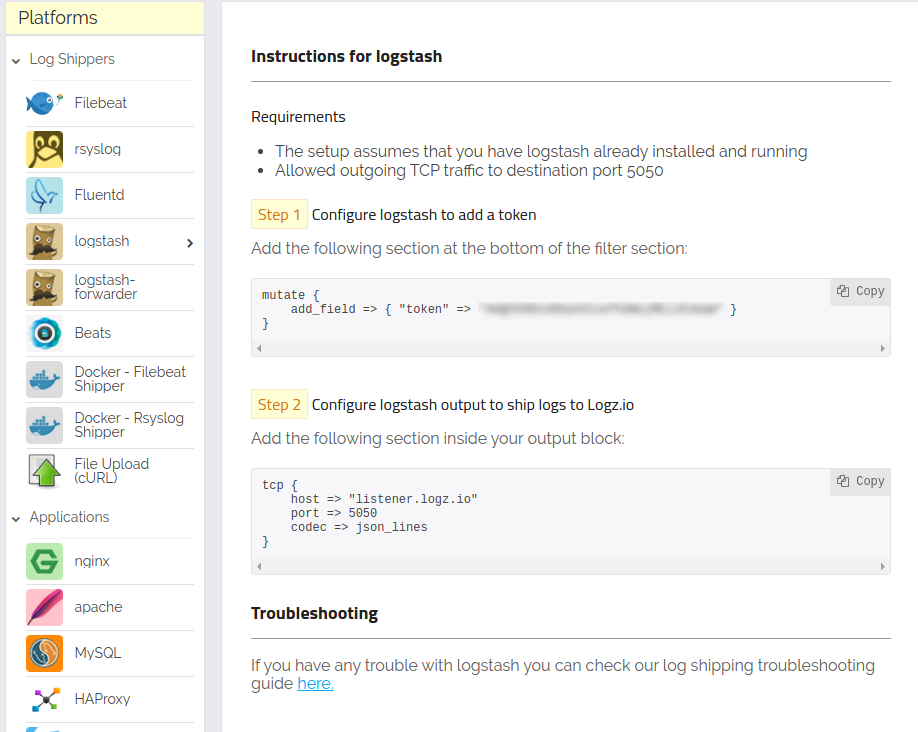
logstash shipping page
after adding these changes, the logstash configuration file for shipping logs to logz.io looks like this:
input {
    exec {
        command => "mongo --eval 'db.serverstatus()' | tail -n +3 | sed 's/\(numberlong([[:punct:]]\?\)\([[:digit:]]*\)\([[:punct:]]\?)\)/\2/' | sed 's/\(isodate(\)\(.*\)\()\)/\2/'"
        interval => 7
        type => "db.serverstatus"
        }
     exec {
        command => "mongo test_mongo_db_1 --eval 'db.stats()' | tail -n +3"
        interval => 7
        type => "db.test_mongo_db_1.stats"
        }
     exec {
        command => "mongo test_mongo_db_2 --eval 'db.stats()' | tail -n +3"
        interval => 7
        type => "db.test_mongo_db_2.stats"
        }
    }
filter {
    json {
        source => "message"
        }
    mutate {
        add_field => {"token" => "<token>"}
        }
    }
output {
    tcp {
        host => "listener.logz.io"
        port => 5050
        codec => json_lines
        }
    }
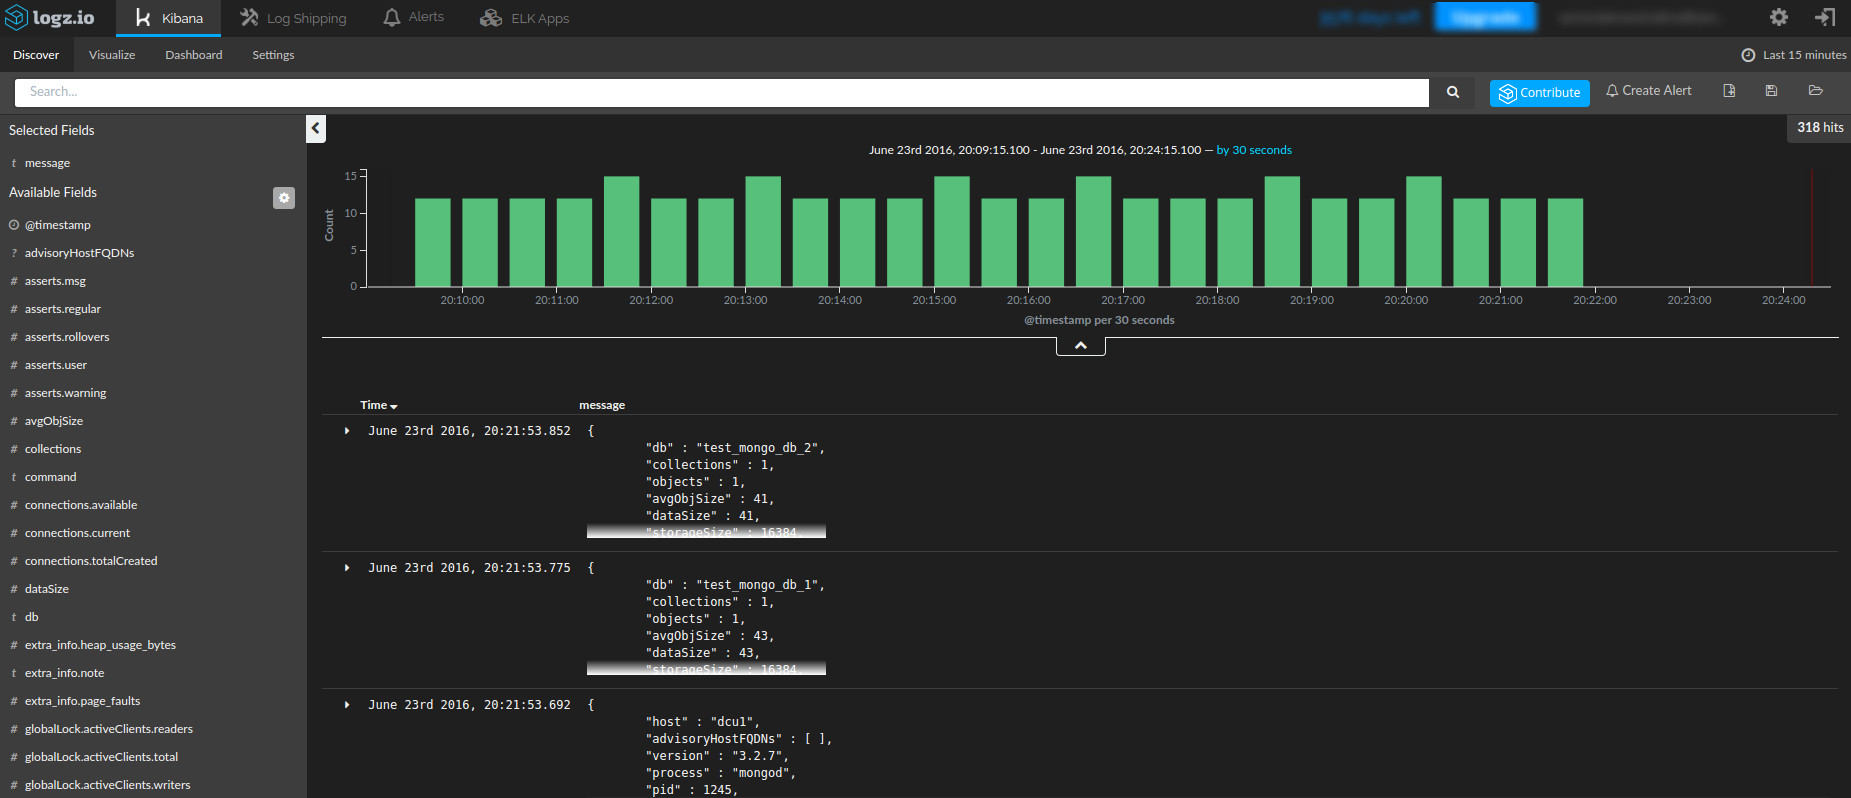
the logz.io discover section after starting a new logstash configuration
shipping to logz.io using amazon s3
another way to ship logs into logz.io is with aws s3. you would first need to create the log files themselves from the mongodb command output, and then use the aws cli to sync with an s3 bucket.
creating the log files
in the previous section, we used the pipeline command to execute and filter command output. the next step is to redirect this output to the file.
first, we will create a new log file:
mongo --eval 'db.serverstatus()' | tail -n +3 | sed 's/\(numberlong([[:punct:]]\?\)\([[:digit:]]*\)\([[:punct:]]\?)\)/\2/' | sed 's/\(isodate(\)\(.*\)\()\)/\2/' >> mongo_server_status_$(date +"%y-%m-%d-%h")
mongo test_mongo_db_1 --eval 'db.stats()' | tail -n +3 >> mongo_test_mongo_db_1_stats_$(date +"%y-%m-%d-%h")

mongo test_mongo_db_2 --eval 'db.stats()' | tail -n +3 >> mongo_test_mongo_db_2_stats_$(date +"%y-%m-%d-%h")
syncing with s3 and shipping to logz.io
logz.io supports shipping from s3 natively. in the logz.io ui, open the log shipping section and expand the aws section. select the s3 bucket option and configure logz.io to be able to read from your s3 bucket.
to find more information on how to configure this type of shipping of the logs and how to use aws cli sync command to copy files to an s3 bucket, you can read the section "s3 syncing and shipping" in our article on creating a pci dss dashboard .
the mongodb performance dashboard
now that all of our mongodb metrics are shipped to elasticsearch, we are ready to build a monitoring dashboard. we will start with a series of kibana visualizations for the throughput metrics.
first and as an example, we will create a line chart that visualizes the number of read requests. after clicking on the visualize section and selecting the line chart visualization type from the menu, we will set up metrics fields on the left side in the kibana:
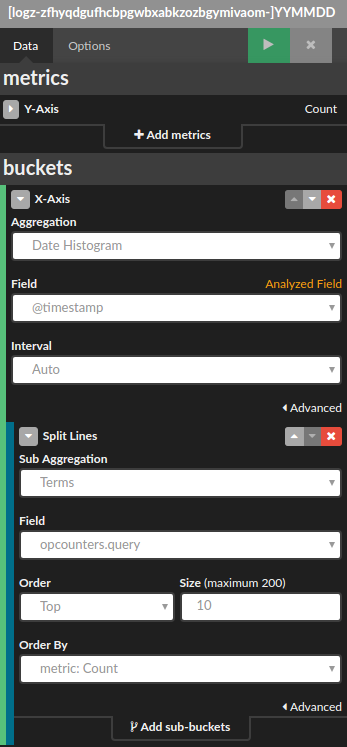
the metrics configuration for query number
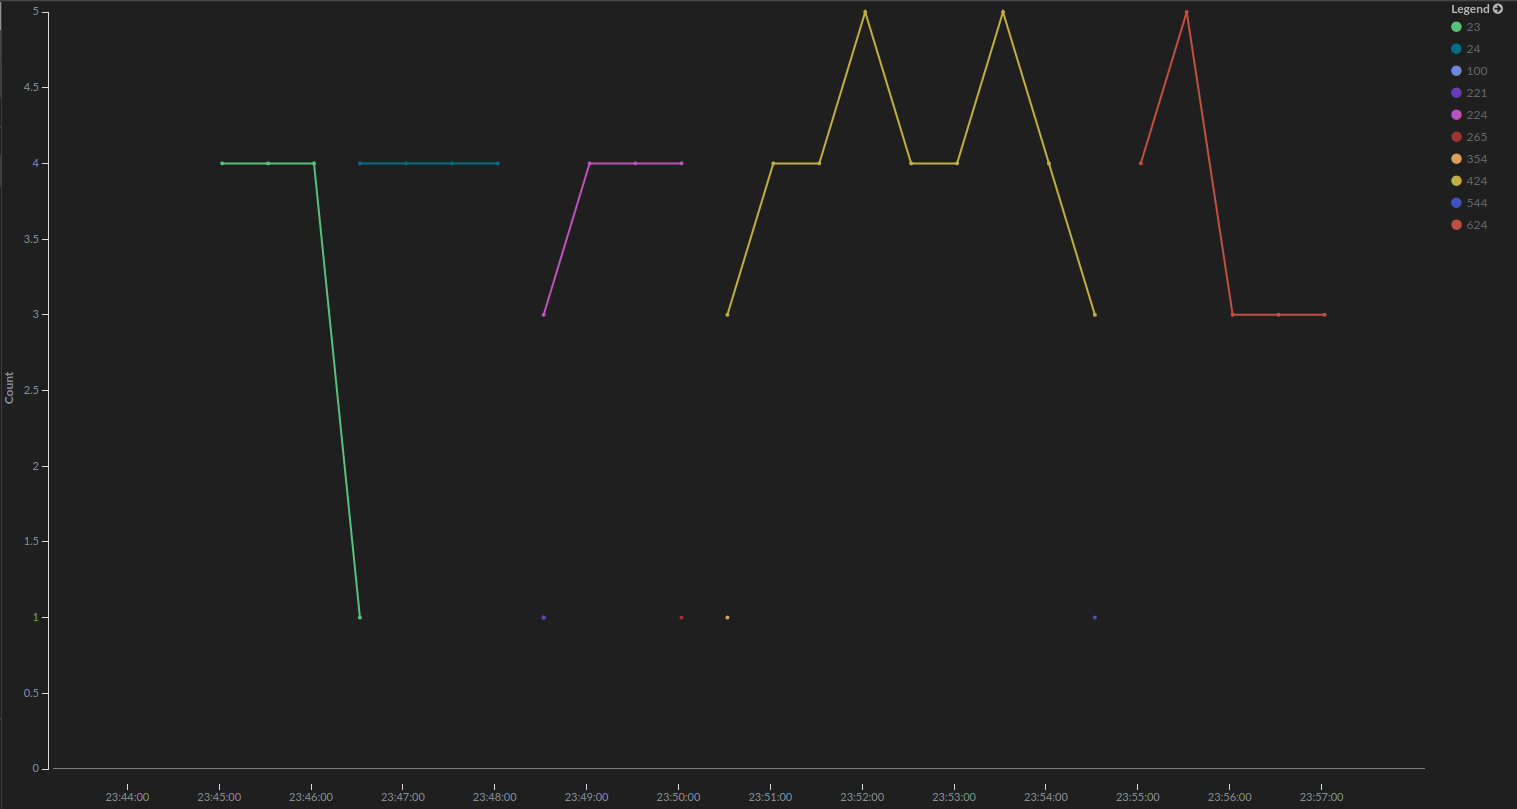
a line chart for query number
we will do the same thing for the rest of the throughput metrics. the configuration will only differ in the aggregation fields used (where for query we pointed on the opcounters.query from the field dropdown).
after adding and saving these charts in the kibana dashboard, you will be able to see throughput metrics visualized:
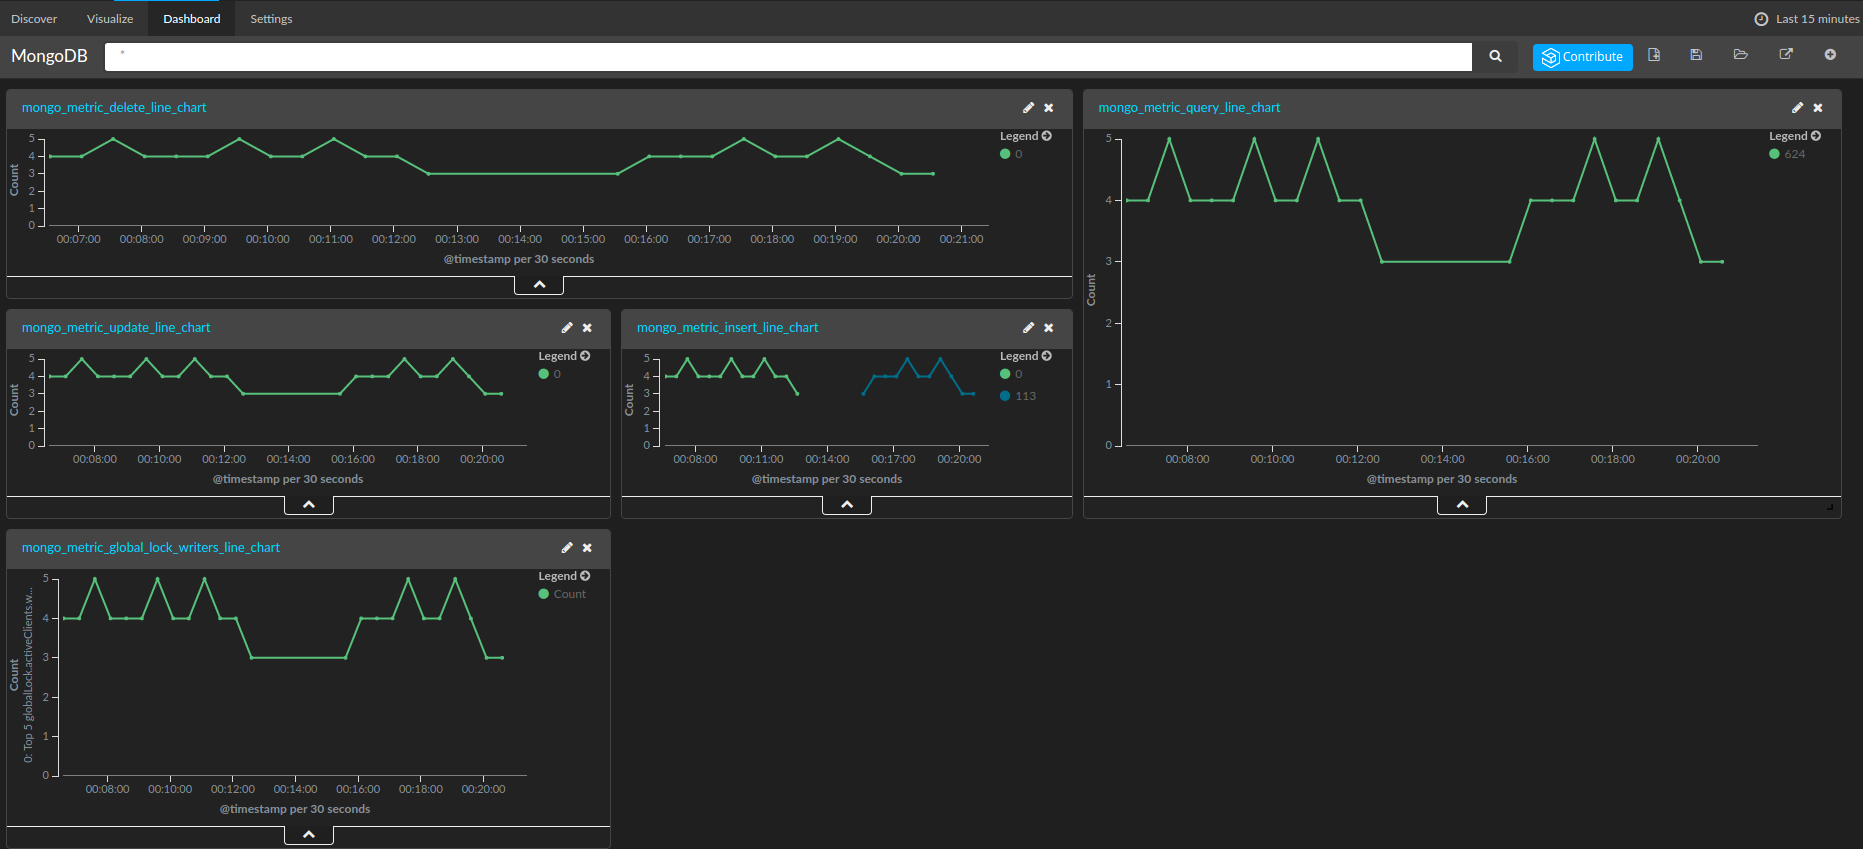
a dashboard with visualized throughput metrics
in a similar fashion, we can visualize the other metrics described in the mongodb metrics section.
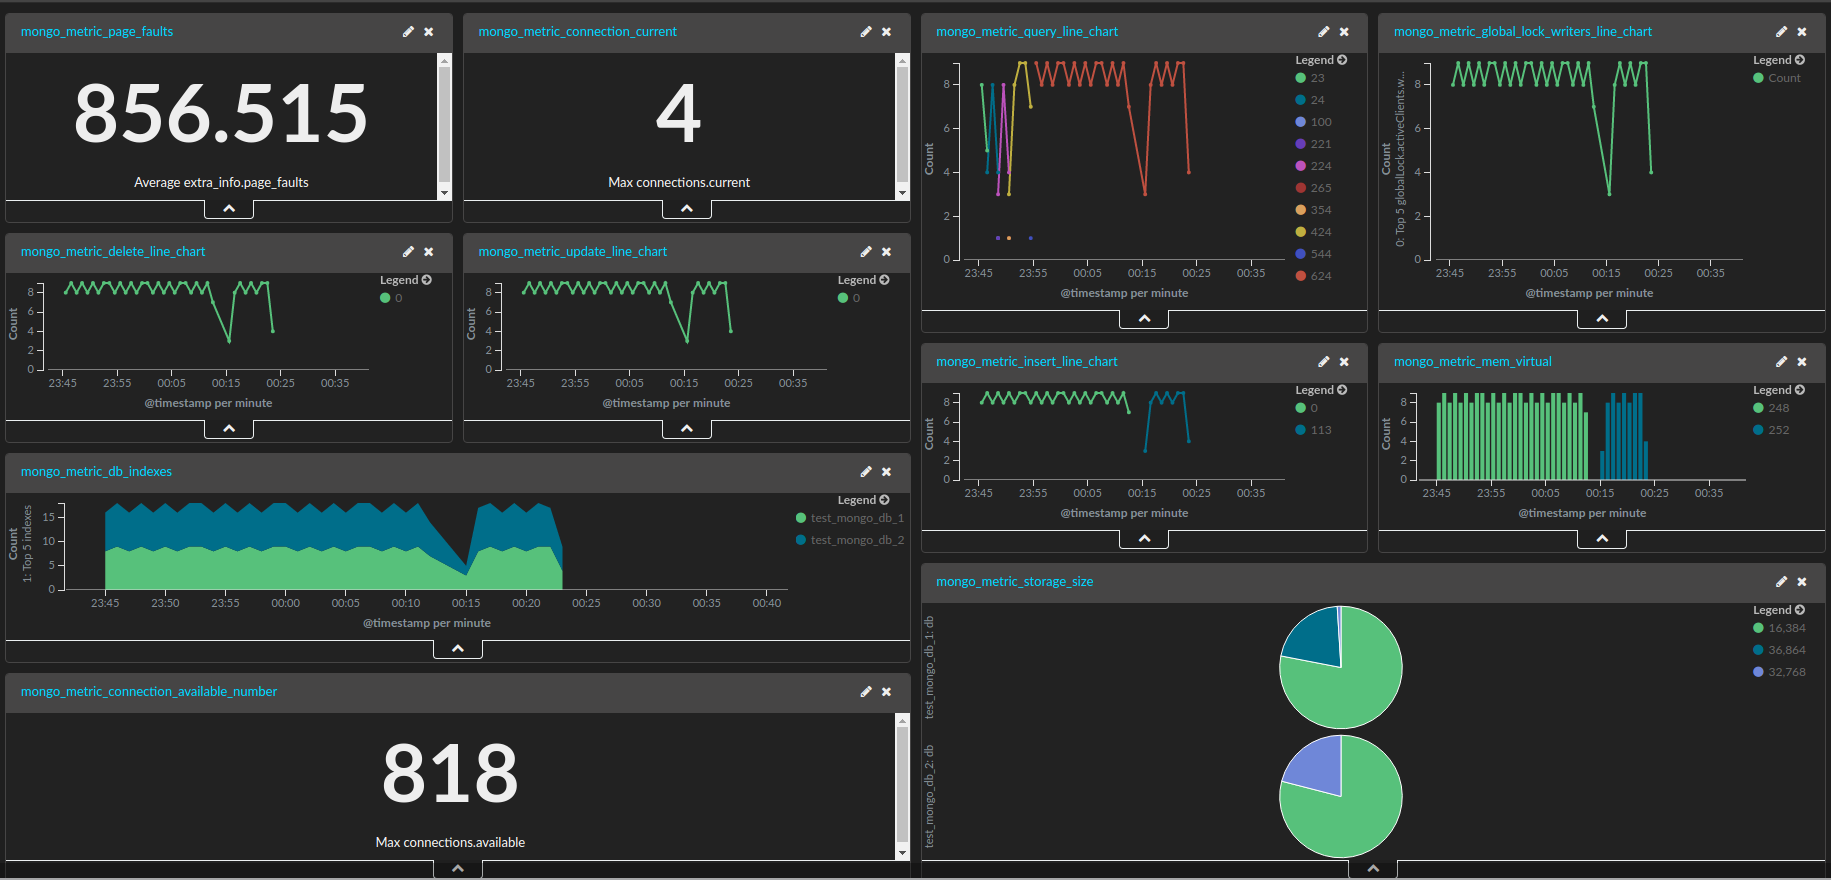
the final dashboard for mongodb metrics
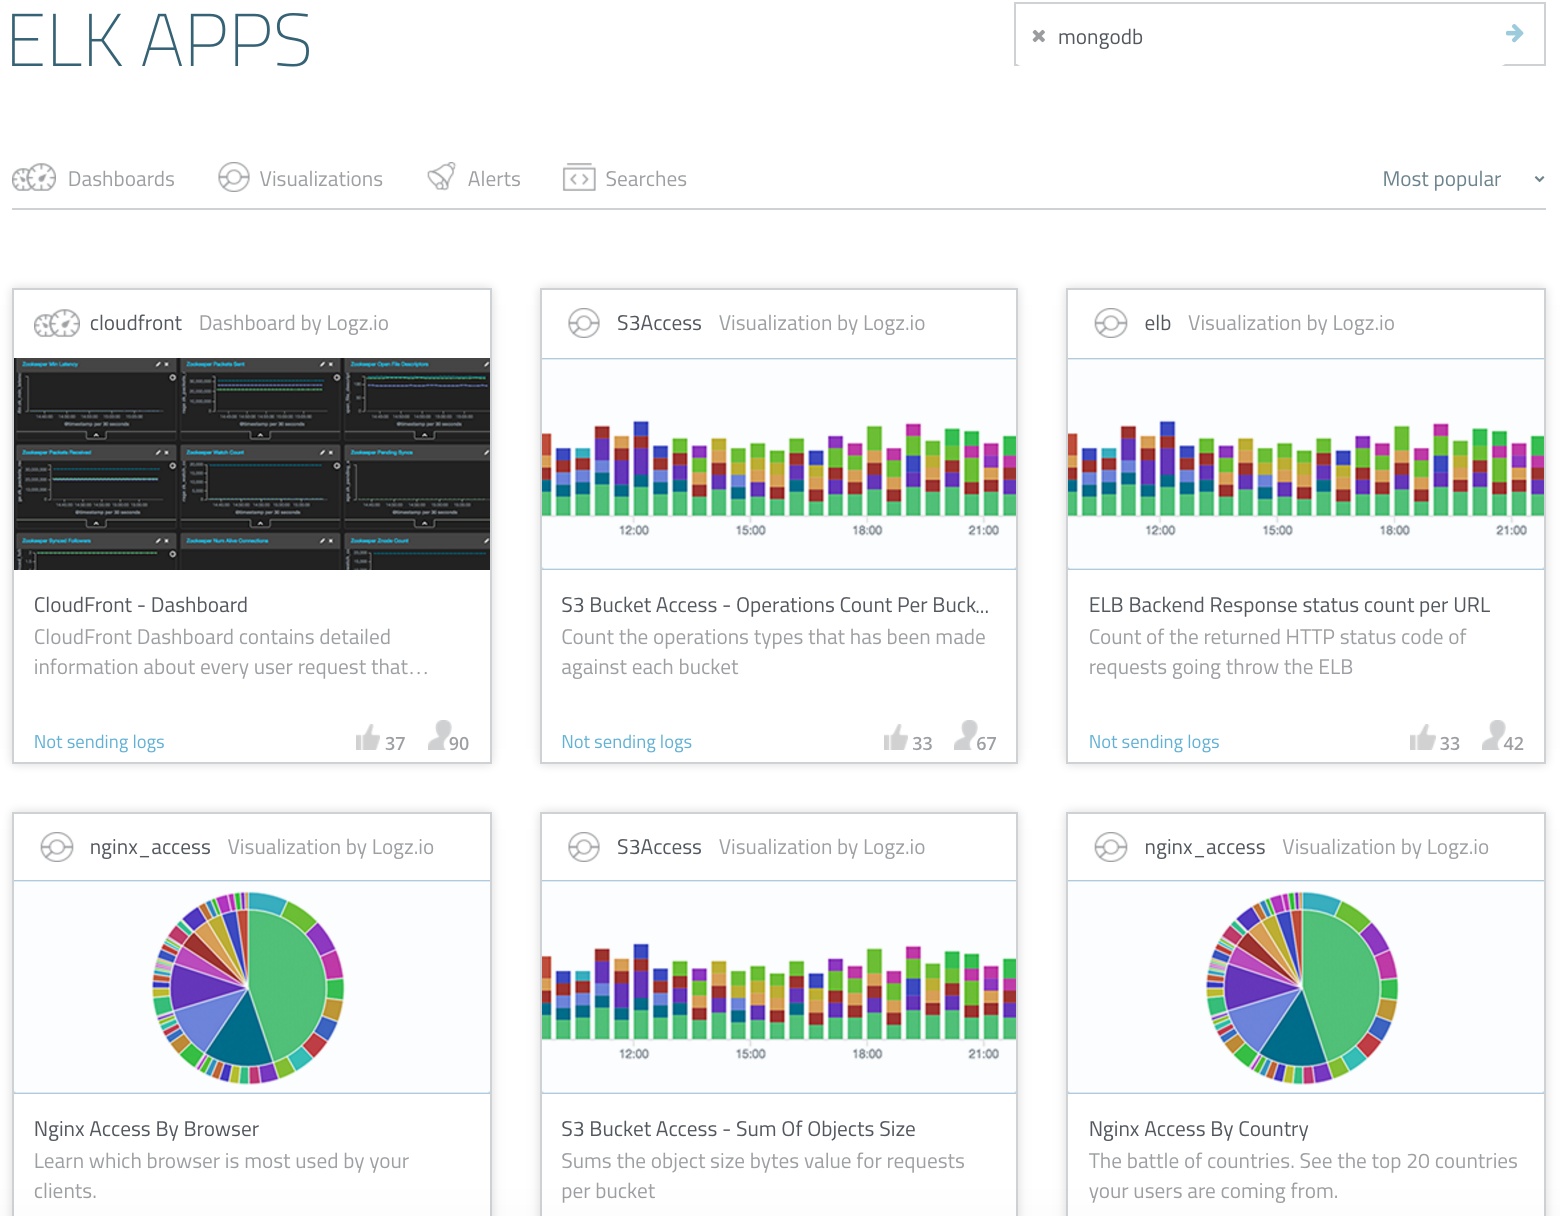
to help you to hit the ground running, we’ve added this dashboard to elk apps — our free library of ready-made visualizations and dashboards that can be installed in one click. simply search for mongodb in the elk apps page, and click to install.
your job doesn't necessarily stop there — set up alerts for the metrics that we have added here. learn how to create alerts for the elk stack .
Published at DZone with permission of Daniel Berman. See the original article here.
Opinions expressed by DZone contributors are their own.
Comments