Monitoring a Dockerized ELK Stack With Prometheus and Grafana
If you’re using Docker, the combination of Prometheus and Grafana offers an extremely enticing option to explore for reasons of ease of use and functionality.
Join the DZone community and get the full member experience.
Join For Freethe elk stack is today the world’s most popular log analysis platform. it’s true .
trump and humor aside — and as we’ve made the case in previous posts — running an elk stack in production is not a simple task, to say the least, and it involves numerous challenges that consume both time and resources. one of these challenges involves monitoring the stack — understanding when your elasticsearch cluster is stretched to the limit and when your logstash instances are about to crash.
that’s why if you’re running elk on docker, as many devops team are beginning to do, it’s imperative to keep tabs on your containers. there are plenty of monitoring tools out there, some specialized for dockerized environments, but most can get a bit pricey and complicated to use as you go beyond the basic setup.
this article explores an alternative, easy, and open-source method to monitor a dockerized elk: using prometheus as the time-series data collection layer and grafana as the visualization layer.
prometheus has an interesting story. like many open-source projects, it was initially developed in-house by the folks at soundcloud, who were looking for a system that had an easy querying language, was based on a multi-dimensional data model, and was easy to operate and scale. prometheus now has an engaged and vibrant community and a growing ecosystem for integrations with other platforms. i recommend reading more about prometheus here .
let’s take a closer look at the results of combining prometheus with grafana to monitor elk containers.
installing elk
if you haven’t got an elk stack up and running, here are a few docker commands to help you get set up.
the dockerized elk i usually use is here .
with rich running options and great documentation, it’s probably one of the most popular elk images used (other than the official images published by elastic).
setting it up involves the following command:
git clone https://github.com/deviantony/docker-elk.git

cd docker-elk

sudo docker-compose up -d
you should have three elk containers up and running with port mapping configured:
container id         image                     command                   created              status               ports                                            names

9f479f729ed8         dockerelk_kibana          "/docker-entrypoin..."   19 minutes ago   up 19 minutes        0.0.0.0:5601->5601/tcp                        dockerelk_kibana_1

33628813e68e         dockerelk_logstash        "/docker-entrypoin..."   19 minutes ago   up 19 minutes        0.0.0.0:5000->5000/tcp                        dockerelk_logstash_1

4297ef2539f0         dockerelk_elasticsearch   "/docker-entrypoin..."   19 minutes ago       up 19 minutes    0.0.0.0:9200->9200/tcp, 0.0.0.0:9300->9300/tcp   dockerelk_elasticsearch_1
don’t forget to set the
max_map_count
value. otherwise, elasticsearch will not run:
sudo sysctl -w vm.max_map_count=262144installing prometheus and grafana
next up, we’re going to set up our monitoring stack.
there are a number of pre-made docker-compose configurations to use, but in this case, i’m using the one developed by stefan prodan .
it will set up prometheus , grafana , cadvisor , nodeexporter and alerting with alertmanager .
to deploy, use these commands:
git clone https://github.com/stefanprodan/dockprom cd dockprom docker-compose up -dafter changing the grafana password in the user.config file, open up grafana at http://<serverip>:3000 , and use "admin" and your new password to access grafana.
defining the prometheus data source
your next step is to define prometheus as the data source for your metrics. this is easily done by clicking creating your first data source .
the configuration for adding prometheus in grafana is as follows:
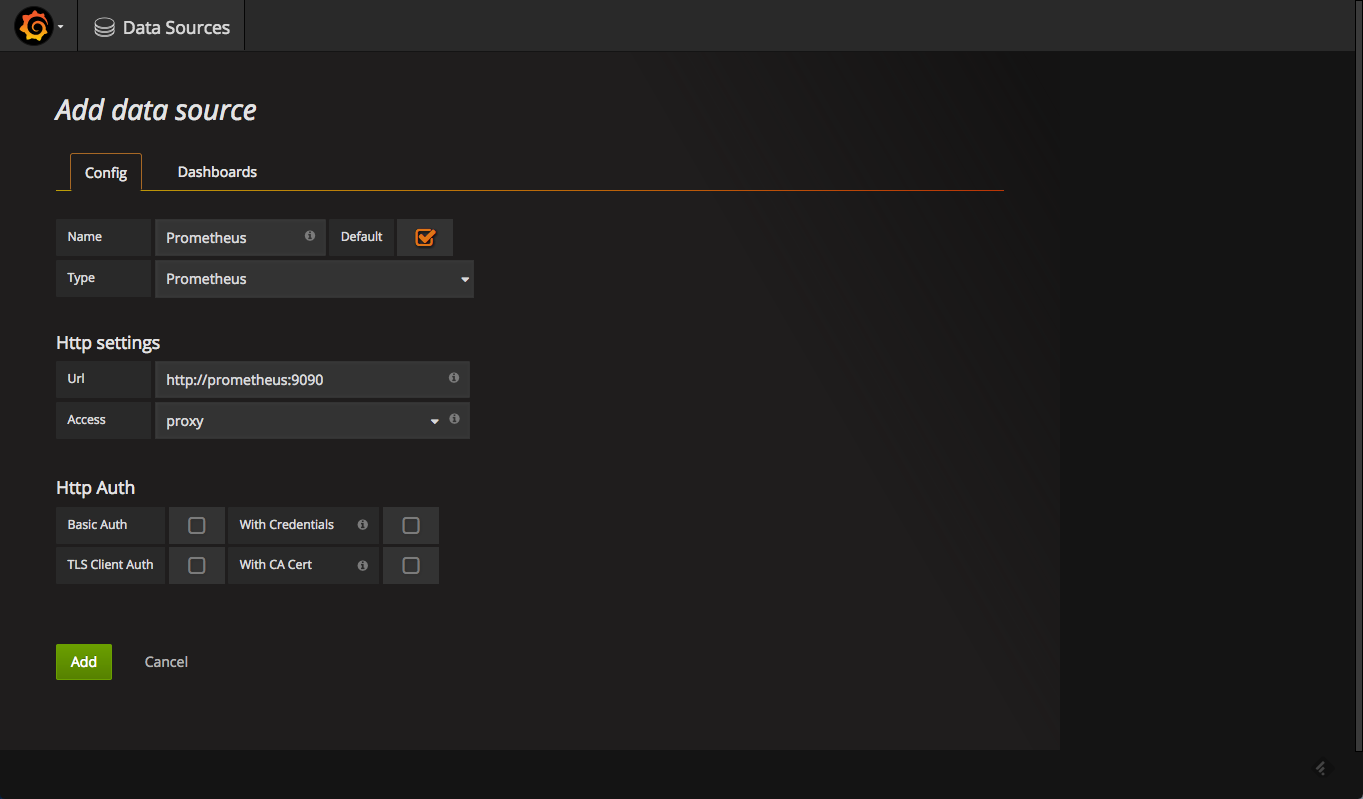
once added, test and save the new data source.
adding a monitoring dashboard
now that we have prometheus and grafana set up, it’s just a matter of slicing and dicing the metrics to create the beautiful panels and dashboards grafana is known for.
to hit the ground running, the same github repo used for setting up the monitoring stack also contains some dashboards we can use out-of-the-box.
in grafana, all we have to do is go to dashboards > import and then paste the json in the required field. please note that if you changed the name of the data source, you will need to change it within the json, as well. otherwise, the dashboard will not load.
the docker containers dashboard looks like this:
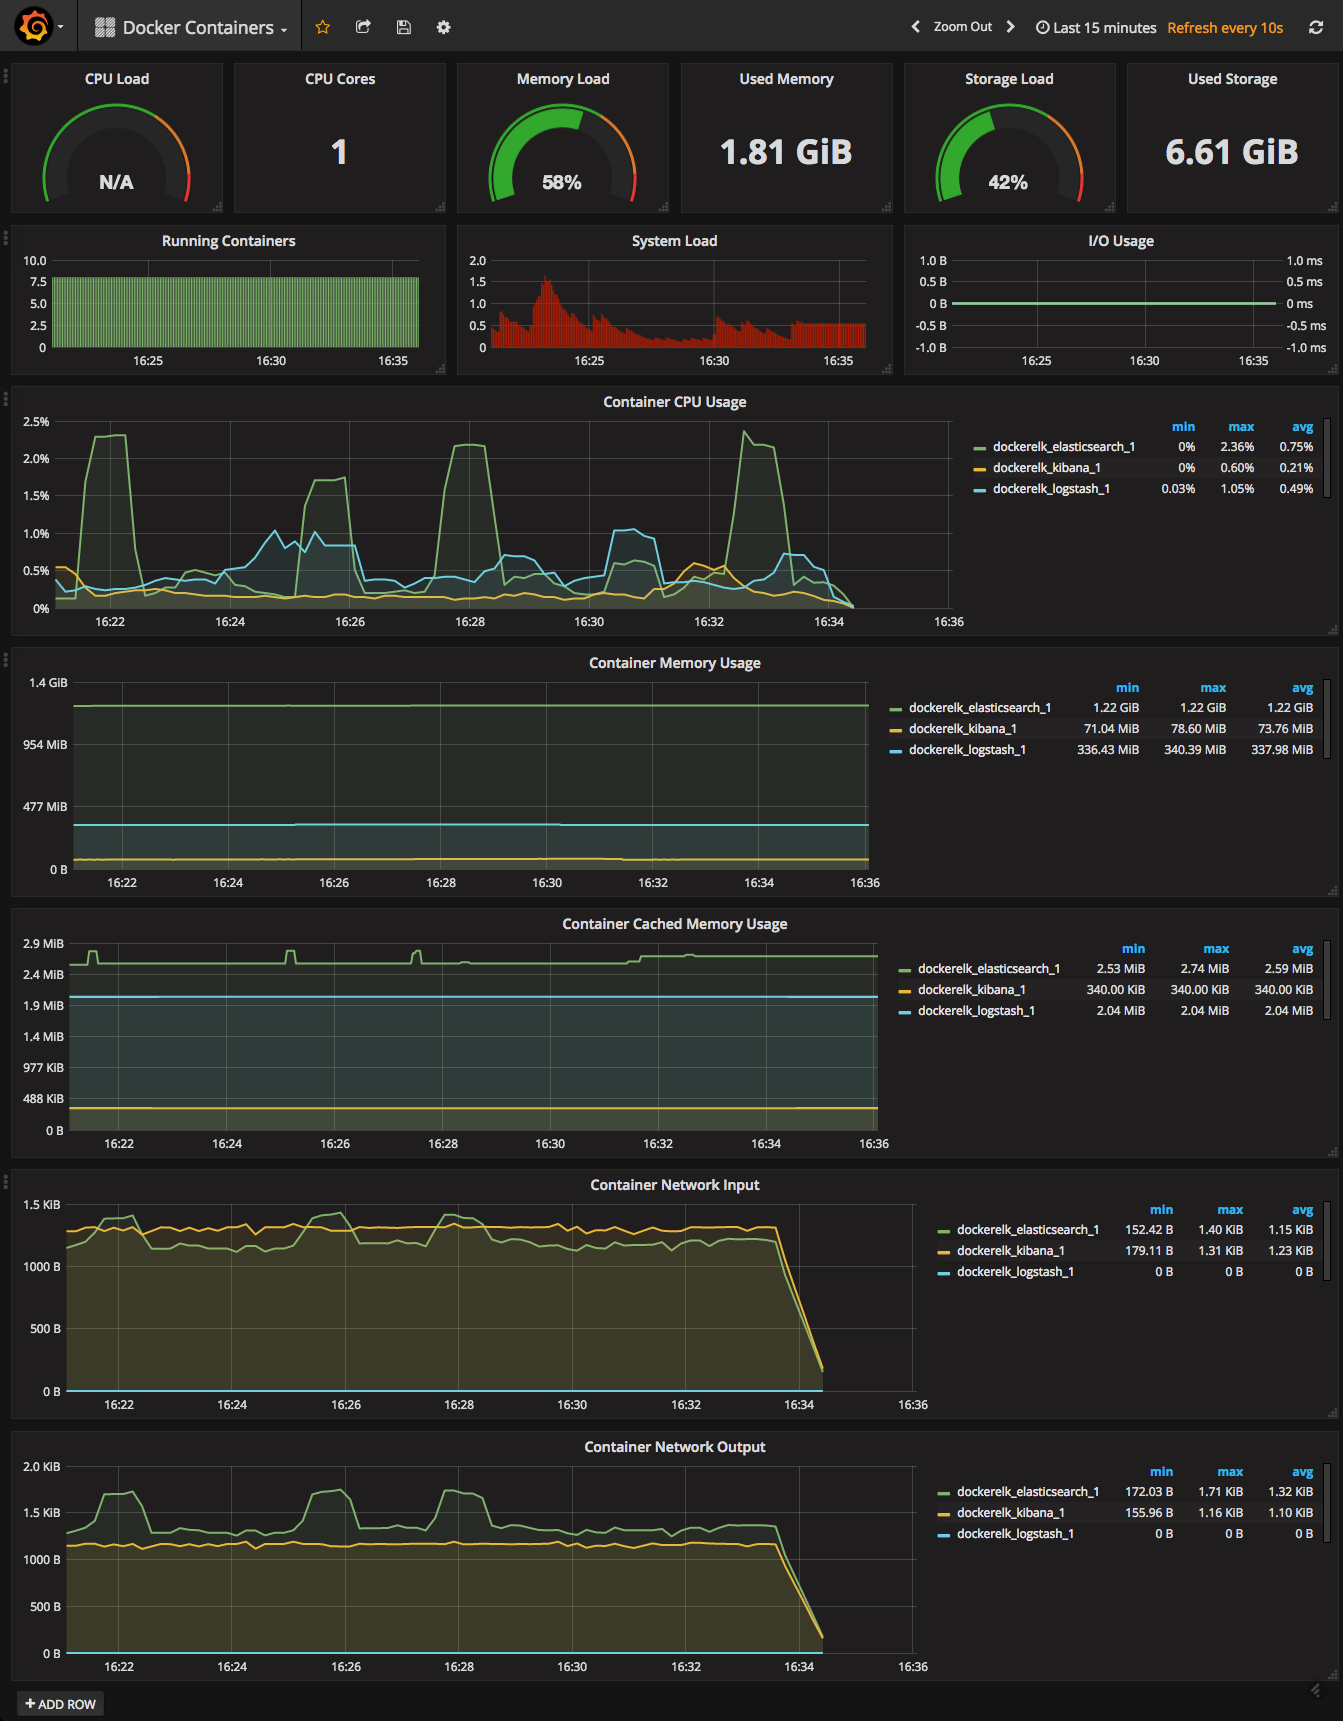
it really is that simple. in a matter of minutes, you will have a docker monitoring dashboard in which you will be able to see container metrics on cpu, memory, and network usage.
another useful dashboard for your docker environment is the docker host dashboard, which is also available in the same repo and uploaded the same way. this dashboard will give you an overview of your server with data on cpu and memory, system load, io usage, network usage, and more.
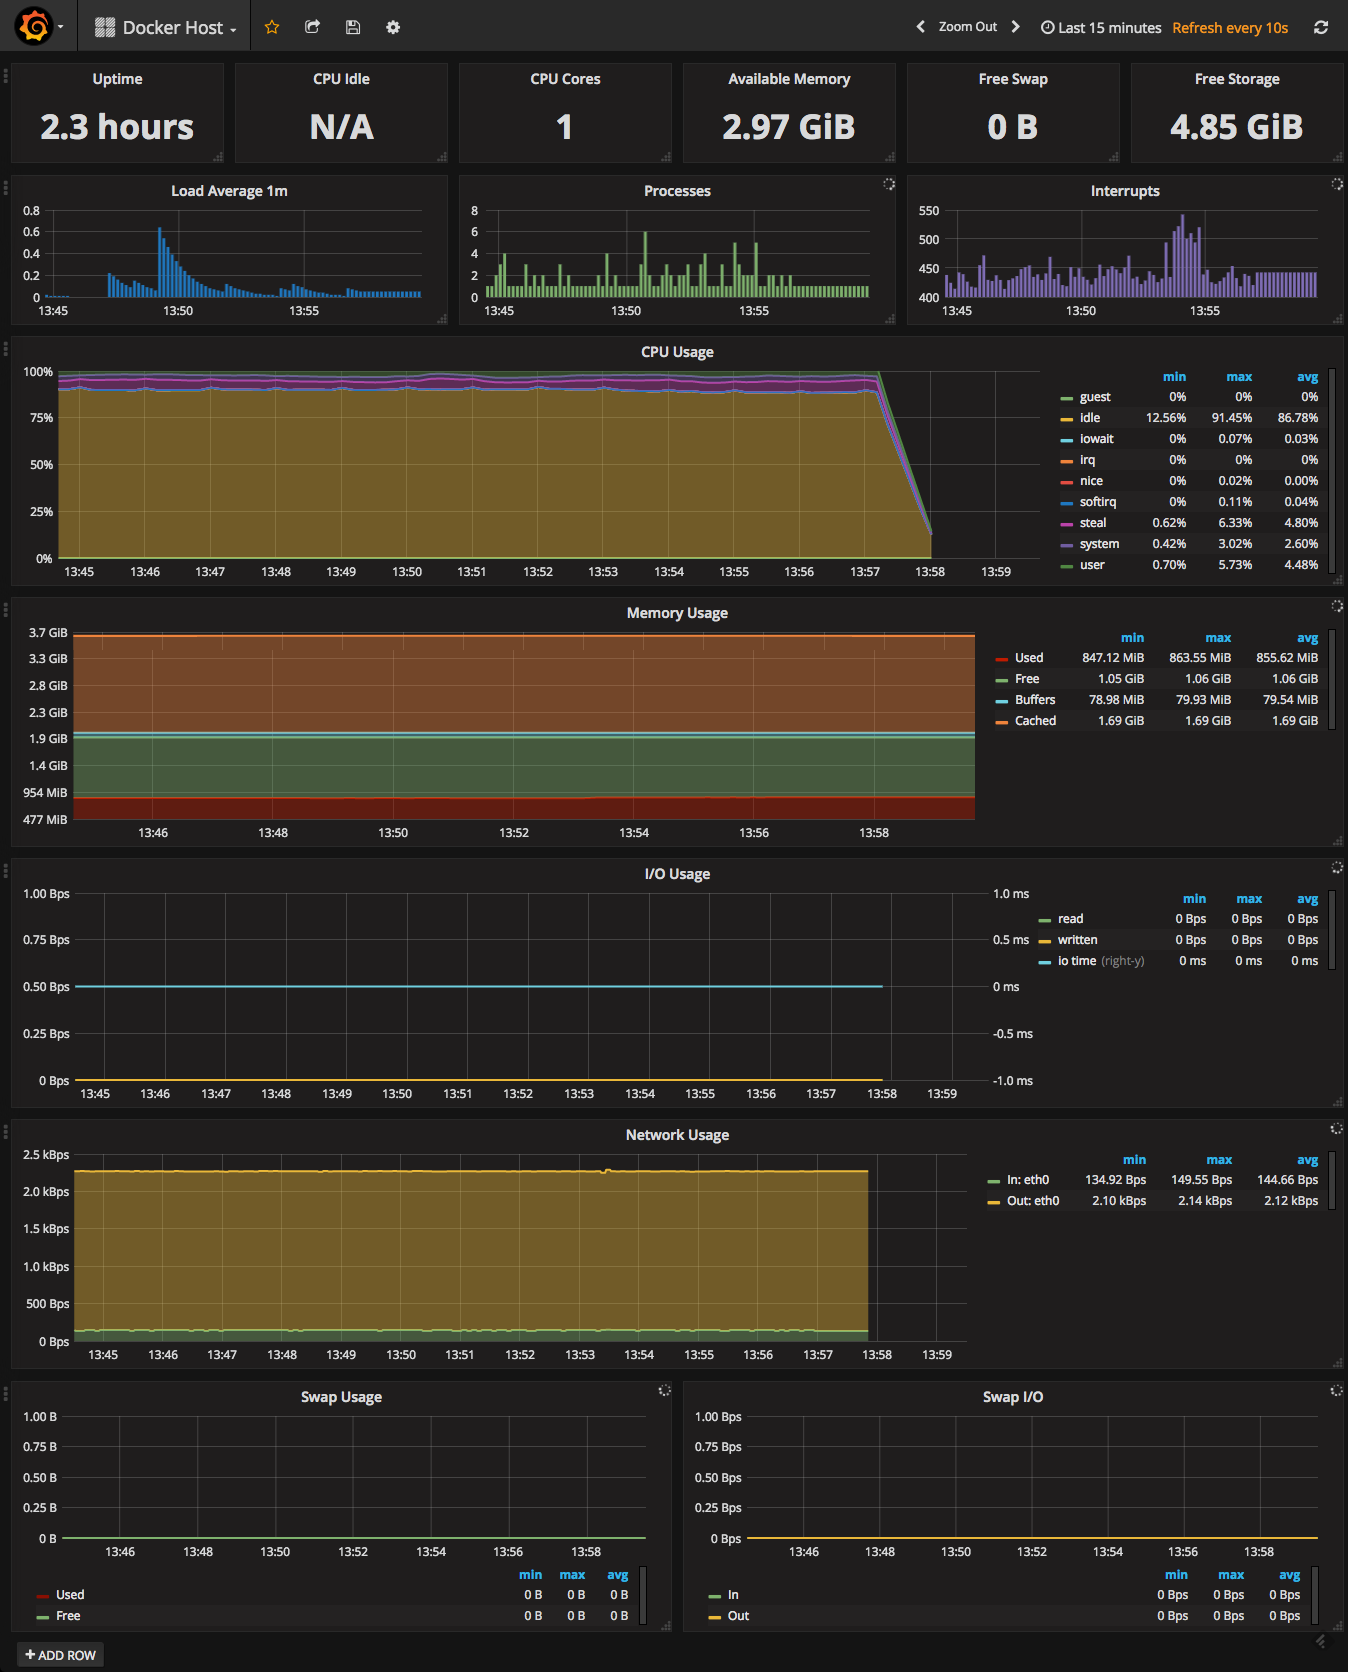
pictures are worth a thousand words, are they not?
the flat lines in the screenshots reflect the fact that there is no logging pipeline in action. as soon as we establish a basic pipeline, we can see our elasticsearch and logstash containers beginning to pick up.
as you can see in the case below, i’m using logspout to forward syslog logs:
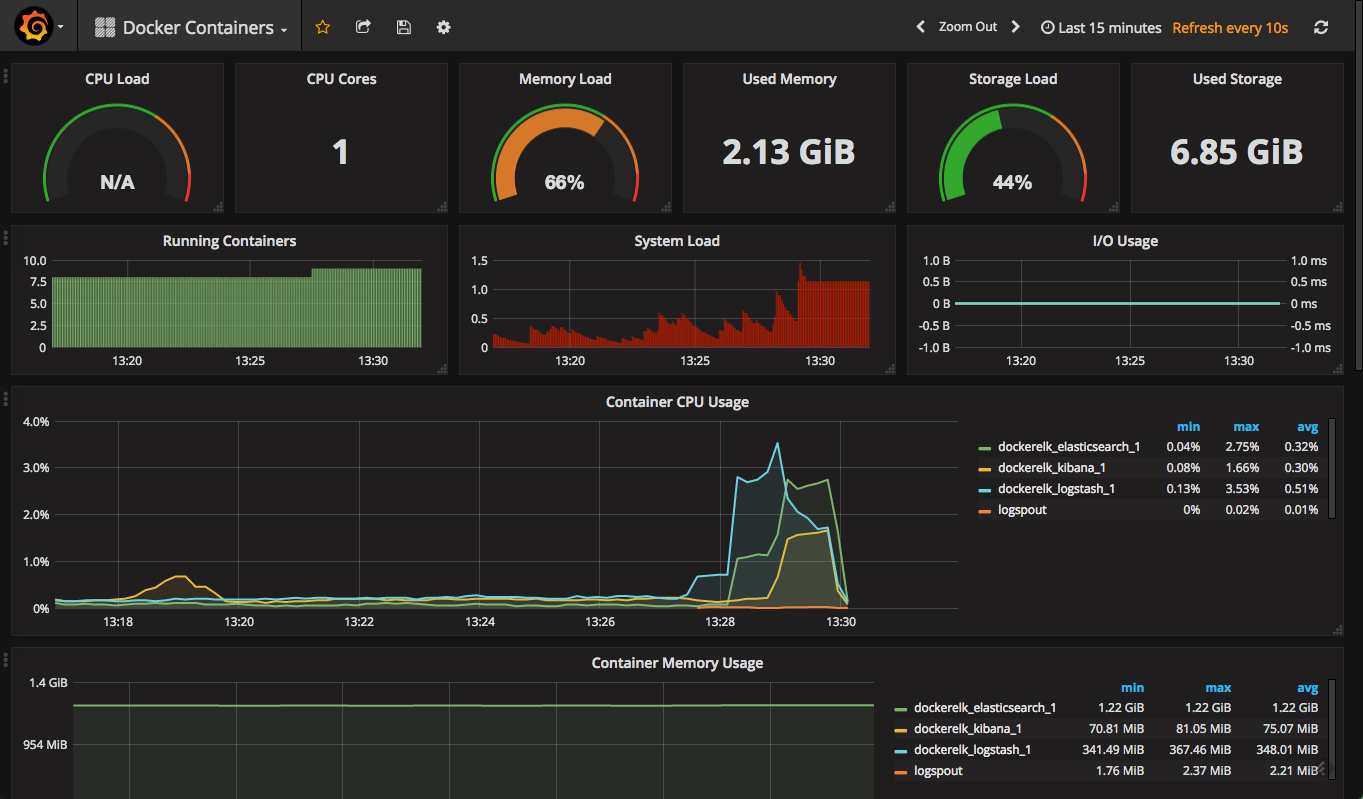
this, of course, is just a basic deployment. an elasticsearch container handling multiple indices and documents will present with more graphs in the red (meaning dangerous) zone.
summary
there are various ways of monitoring the performance of your elk stack, regardless of where you’re running it (for example, on docker).
in a previous post, roi ravhon described how we use grafana and graphite to monitor our elasticsearch clusters . since the release of elastic stack 5.x, monitoring capabilities have been built into the stack and even logstash, the performance base of the stack, now has a monitoring solution included in x-pack .
however, if you’re using docker, the combination of prometheus and grafana offers an extremely enticing option to explore for reasons of ease of use and functionality.
it’s definitely worth exploring, and if worse comes to worst — sudo docker rm .
Published at DZone with permission of Daniel Berman. See the original article here.
Opinions expressed by DZone contributors are their own.
Comments