Monitoring Applications at Scale in AWS
AWS provides local metrics/monitoring via CloudWatch. But things get complicated when we need to monitor multiple applications from all these accounts.
Join the DZone community and get the full member experience.
Join For FreeThe Problem
There are various scenarios when we choose to deploy our applications in different AWS accounts:
- There are multiple microservices deployed in different AWS accounts in different regions based on the use case.
- For an organization, there could be multiple AWS accounts configured that will deploy related/unrelated services.
- One AWS account, one AWS region, etc.
AWS provides local metrics and monitoring via AWS CloudWatch. But things will get complicated when we need to monitor multiple applications from all these accounts to extrapolate and make decisions based on the metrics.
The Technology
AWS released cross-account observability which will allow monitoring applications spanning across multiple accounts in a region. This will allow accounts to share the following to a central monitoring account:
- CloudWatch Metrics
- CloudWatch Log groups and
- AWS X-Ray Traces
Glossary
- Monitoring account: A central AWS account that will view and interact with the data generated by source accounts
- Source accounts: These are individual AWS accounts that will generate the above data. They are ’n’ in numbers.
Limitations
- 1 source account can share observability with at most 5 monitoring accounts
- Cross-region observability is not allowed.
- Only the source account can disable sharing with the monitoring account.
The Solution
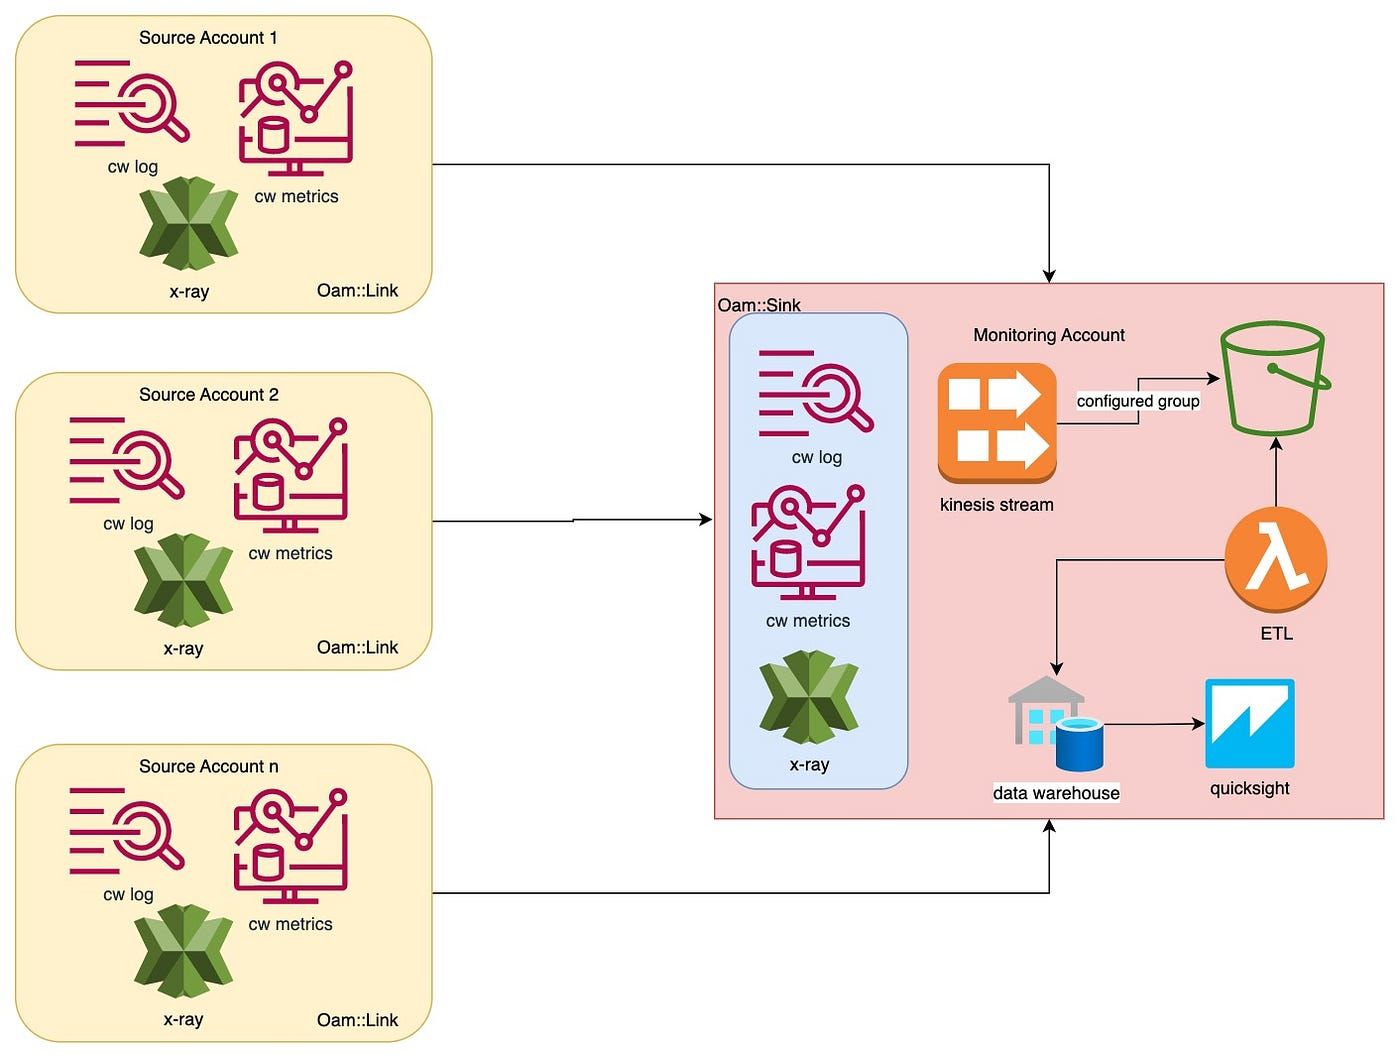
Cross-account observability and analyzing data
Above is a high-level diagram of sharing the metrics, logs, and X-ray data from multiple source accounts to a central metrics account using cross-account observability and then extending the solution to further analyze metrics data using ETL, Data Warehouse, and QuickSight. Let me discuss each section:
1. Monitoring Account
This is the central account to stream and visualize the CloudWatch and X-ray data from source accounts. In order to do this, certain AWS permissions and configurations are required.
- Login using the below permissions to configure Oam Sink or log in as admin:
{
    "Version": "2012-10-17",
    "Statement": [
        {
            "Sid": "AllowSinkModification",
            "Effect": "Allow",
            "Action": [
                "oam:CreateSink",
                "oam:DeleteSink",
                "oam:PutSinkPolicy",
                "oam:TagResource"
            ],
            "Resource": "*"
        },
        {
            "Sid": "AllowReadOnly",
            "Effect": "Allow",
            "Action": ["oam:Get*", "oam:List*"],
            "Resource": "*"
        }
    ]
}
- List of source accounts: In order to allow broader source accounts, an organization ID can be used. Replace
aws:ResourceAccountwithaws:PrincipalOrgID.
{
            "Action": [
                "oam:CreateLink",
                "oam:UpdateLink"
            ],
            "Effect": "Allow",
            "Resource": "arn:*:oam:*:*:sink/*",
            "Condition": {
                "StringEquals": {
                    "aws:ResourceAccount": [
                        "999999999999"
                    ]
                }
            }
        }
- Final policy for an AWS organization unit: You can remove any resource type that is not needed for your use case.
"Name": "SampleSinkPolicy",
"Policy": {
   "Version": "2012-10-17",
   "Statement": [{
       "Effect": "Allow",
       "Principal": "*",
       "Resource": "*",
       "Action": [ "oam:CreateLink", "oam:UpdateLink" ],
       "Condition": {
        "StringEquals": {"aws:PrincipalOrgID":"o-xxxxxxxxxxx"},
        "ForAllValues:StringEquals": {
          "oam:ResourceTypes": [
            "AWS::CloudWatch::Metric",
            "AWS::Logs::LogGroup",
            "AWS::XRay::Trace"
          ]
        }
       }
    }]
}
- Configure using AWS Console:
- Login -> CloudWatch -> Monitoring account configuration -> Configure (select appropriate options)
- Once the configuration is complete, you can navigate to CloudWatch -> Monitoring account configuration-> Resources to link accounts and select the type of configuration to download the CloudFormation Template or copy the URL. This will be used later to configure the source accounts.
- Using CDK:
const sinkPolicy = new iam.PolicyDocument({
      statements: [
        new iam.PolicyStatement({
          actions: ['oam:CreateLink', 'oam:UpdateLink'],
          resources: ['*'],
          principals: ['*'],
          conditions: {
            'ForAllValues:StringEquals': {
              'oam:PrincipalOrgID': 'o-xxxxxxxxxxx'
            }
          }
        })
      ]
    });

    this.sink = new oam.CfnSink(this, 'SampleMonitoringSink', {
      name: 'SampleMonitoringSink',
      policy: sinkPolicy
    });
2. Source Accounts
Source account configuration can be done in 3 ways.
1. Using CloudFormation
Once the monitoring account is configured and CloudFormation is downloaded, it can be used to deploy the stack using AWS CloudFormation. The CloudFormation will look like this:
{
    "LabelTemplate": "SampleLabel",
    "ResourceTypes": [
        "AWS::CloudWatch::Metric",
        "AWS::Logs::LogGroup",
        "AWS::XRay::Trace"
    ],
    "SinkIdentifier": "arn:aws:oam:eu-north-1:1111111111111111:sink/EXAMPLE-206d-4daf-9b42-1e17d5f145ef"
}
This will create a link between the source and monitor accounts.
2. Using URL
Log in to the source account and paste the URL. This will pre-populate the page with all the details. Select Link and Confirm.
3. Using CDK
new oam.CfnLink(this, 'SampleLink', {
          labelTemplate: 'SampleLabel',
          resourceTypes: [
                 'AWS::CloudWatch::Metric',
                 'AWS::Logs::LogGroup',
                 'AWS::XRay::Trace'
          ],
          sinkIdentifier: 'arn:aws:oam:eu-north-1:1111111111111111:sink/EXAMPLE-206d-4daf-9b42-1e17d5f145ef'
        });
Once done, all the selected resources; i.e., Metric, LogGroup, or X-Ray trace will be available in the monitoring accounts from source accounts.
Things To Consider
- Never use
*as a resource without an account ID or organization ID. - If
*is used without any check-in place, this will open a risk on the monitoring account to allow any source account to establish a link. - Always use a list of account IDs or organization IDs in monitoring account configuration.
Bonus
The above will provide cross-account observability to view and monitor logs, metrics, and X-rays from source accounts to a single monitoring account. This section will discuss transporting the log and metrics data to a data warehouse to analyze the extrapolation using QuickSight.
This will need the below configuration in the monitoring account.
- Create S3 bucket: This bucket will store metrics and logs from source accounts.
- Configure metrics stream: In order to stream and store the data from source accounts into the monitoring account S3 bucket, you’ll need to configure the Metrics Stream. In order to do so:
- Navigate to CloudWatch -> Metrics -> Streams. Select Create a metric stream.
- Click on include source account metrics and select namespaces (or all namespaces) as required.
- Follow different configurations as required.
- Once configured, a new metric stream will be created. This will stream the data from all linked source accounts to the defined S3 bucket.
- You can configure an ETL job on top of S3 data (or use a firehose to do this as well).
- Use QuickSight or any other visualization application to visualize collected data.
- Make a decision!!
Published at DZone with permission of Pranav Kumar Chaudhary. See the original article here.
Opinions expressed by DZone contributors are their own.
Comments