Monitoring AWS Lambda Invocations With the ELK Stack
With the ELK stack more popular than ever, let's see how you can use it to monitor your serverless functions using AWS Lambda.
Join the DZone community and get the full member experience.
Join For FreeThe attention AWS Lambda received at re:Invent this year, coupled with the reported growth in usage (300% YoY), reaffirms a known truth — Lambda is fast becoming the de-facto standard of serverless computing.
An area in which Lambda is still surprisingly lacking, though, is logging and monitoring, and most users either neglect this aspect or rely on 3rd party integrations.
One of the most interesting news coming out of re:Invent in this context is the new CloudTrail support for logging Lambda invocations. Previously, only management actions could be recorded. Now, you can also record the execution activity of your Lambda functions, a capability that is especially important for security and compliance use cases.
The Lambda information recorded includes details on when a Lambda function was executed using the Invoke API, by whom and where. Additional information includes function details, client information, and user information.
All this data can be shipped into an S3 bucket of your choice (or CloudWatch) for further use in 3rd party platforms for aggregation, analysis, and visualization, and in this article I’m going to examine integrating this data with the ELK Stack (Elasticsearch, Logstash, and Kibana) and Logz.io.
Creating a Trail
Your first step is to create a new trail in CloudTrail (if you already have a trail defined, you can simply enable Lambda tracking for the existing trail). This is easily done via the CloudTrail console. Simply hit the Create trail button and configure your new trail.
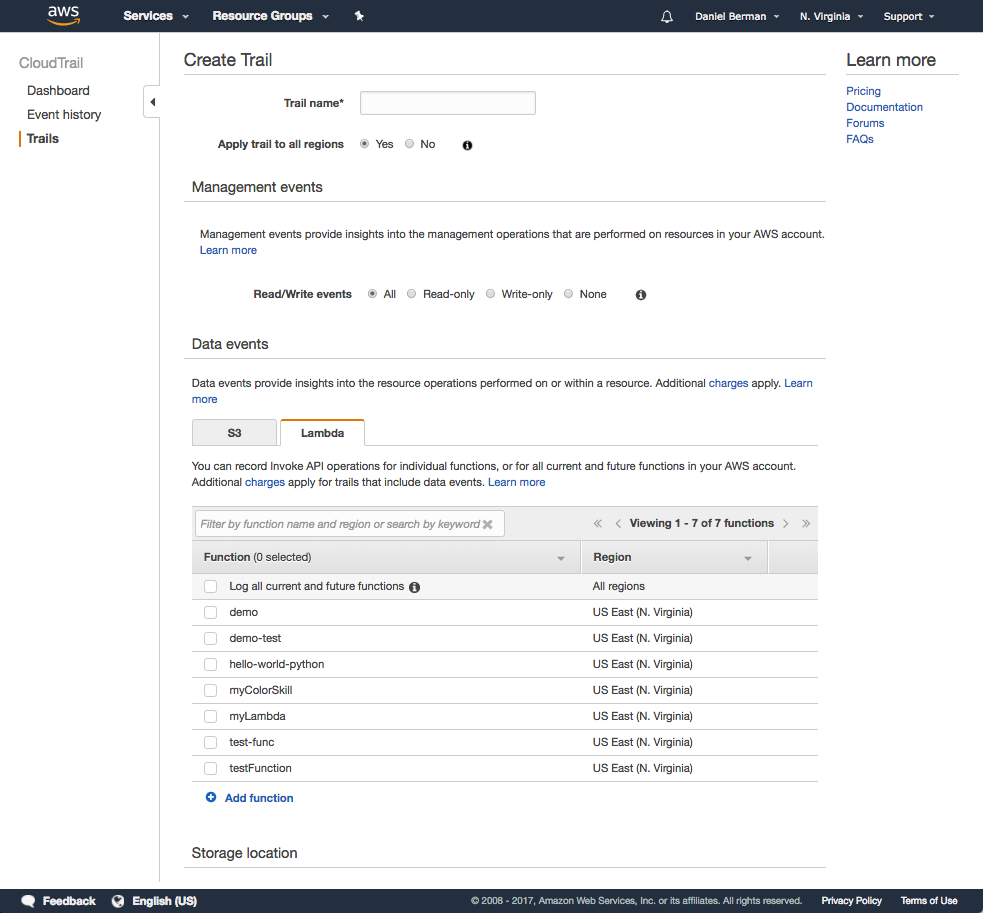
Open the lambda tab in the Data events section, and select what Lambda functions you want to track activity for. I chose to log all functions.
In the Storage location section, configure the S3 bucket you want to ship the data to. If you already have a bucket created, even better. Just select it in the relevant field. Advanced configuration options allow you to decide if you want to encrypt the data or not, or send an SNS notification.
Hit Create when done. After a short while, you should see data in the defined S3 bucket.
Shipping Into ELK
There are various ways of shipping data from S3 into ELK. The most commonly used method is using the S3 Logstash input plugin, but other methods include using a Lambda function or even downloading the data as a file and using the File input plugin.
In the example below, I am using the S3 Input plugin.
Note the AWS user access key and secret key values. Most pipelines involving pulling data from S3 fail due to permissions issues. In the filter section, I’ve entered some basic configurations for processing the data. The output is defined as a local Elasticsearch instance.
input {
s3 {
access_key_id => "XXXXXXXXX"
secret_access_key => "XXXXXXXXXXXXXXXXX"
bucket => "lambda-cloudtrail-data"
codec => "plain"
region => "us-east-1"
type => "cloudtrail"
}
}
filter {
if [type] == "cloudtrail" {
json {
source => "message"
}
geoip {
source => "sourceIPAddress"
target => "geoip"
add_tag => ["cloudtrail-geoip"]
}
}
}
output {
elasticsearch {
hosts => ["localhost:9200"]
}
stdout {
codec => rubydebug
}
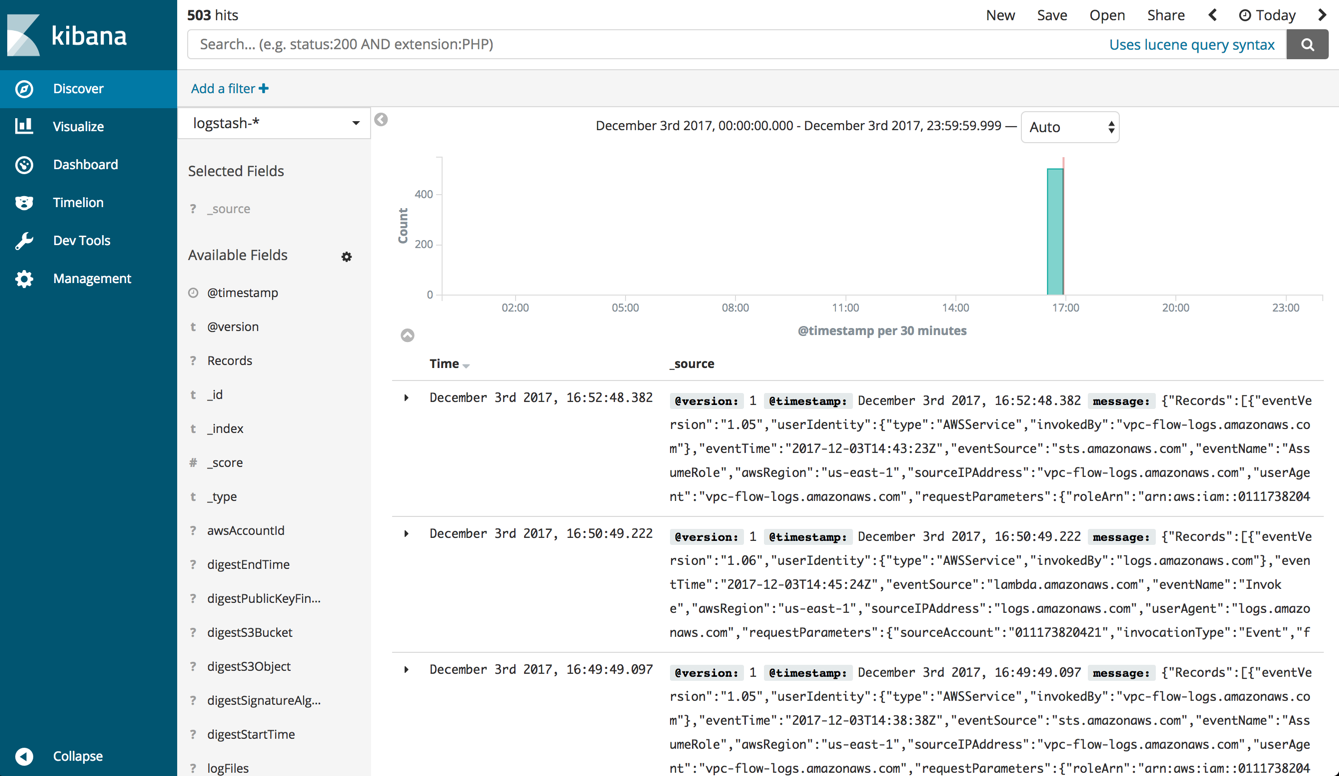
}Starting Logstash, a new index will be created and you will be able to define the new index pattern in Kibana to start analyzing the data.
Shipping Into Logz.io
Logz.io includes built-in support for shipping from CloudTrail via S3. All you need to do is define the S3 bucket and your AWS account credentials in the relevant area in Logz.io.
First, make sure that your AWS user has the correct permissions for accessing the bucket (s3:ListBucket AND s3:GetObject). If you’re not sure, read more about this here.
Then, go to the Log Shipping page in Logz.io, open the AWS → CloudTrail tab, and enter the following information:
- S3 bucket – name of your bucket
- Prefix (retrieve this from S3) – AWSLogs/<accountID>/CloudTrail/
- S3 access key – the AWS user’s access key
- S3 secret key – the AWS user’s secret key
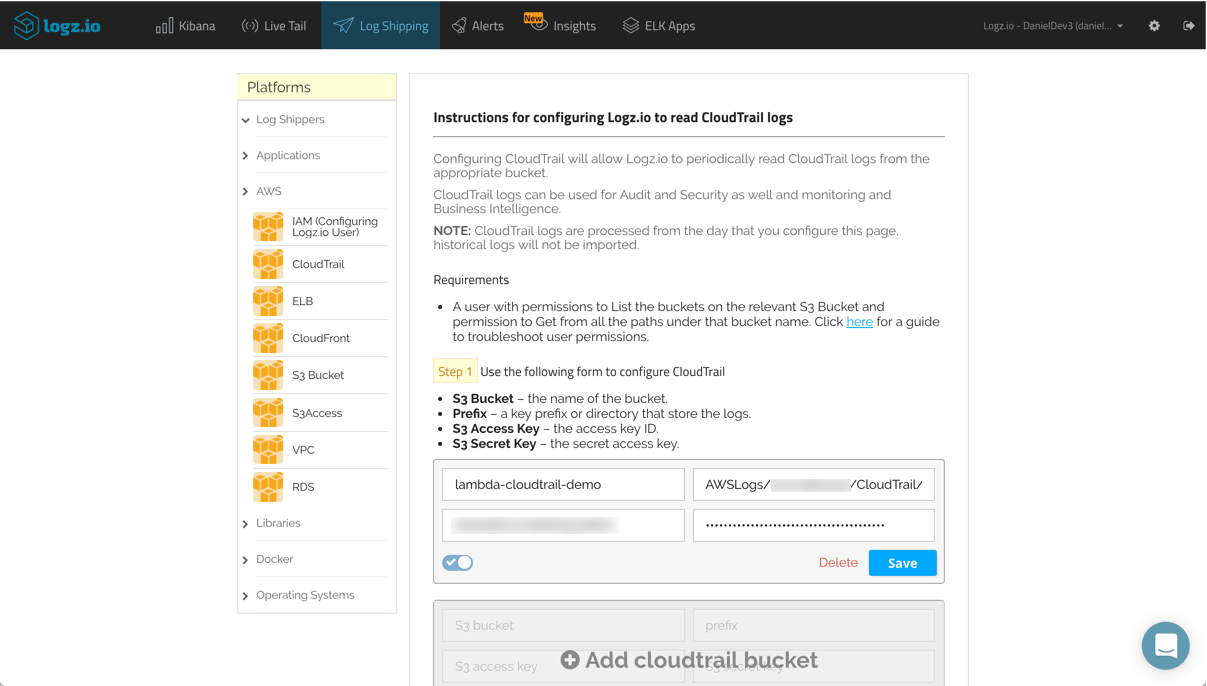
Hit Save. If all goes as expected, the bucket will be defined properly, and the data will begin showing up in Logz.io.
Analyzing Lambda Invocations
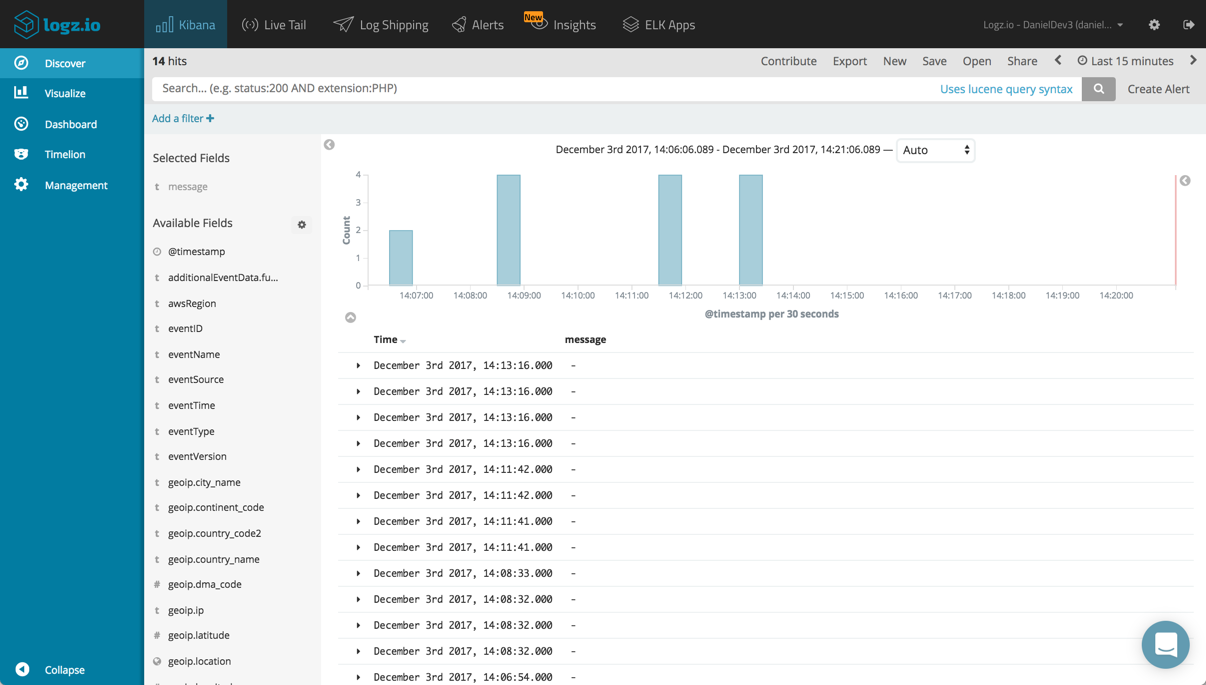
CloudTrail ships the Lambda records (called Data events) into ELK together with other management events, so your first step logical is to search the results to show only Lambda records.
To do this, you can use the filter option below the query box in the Discover tab to filter results by the eventSource field. Save the search for future use in visualizations and analysis.
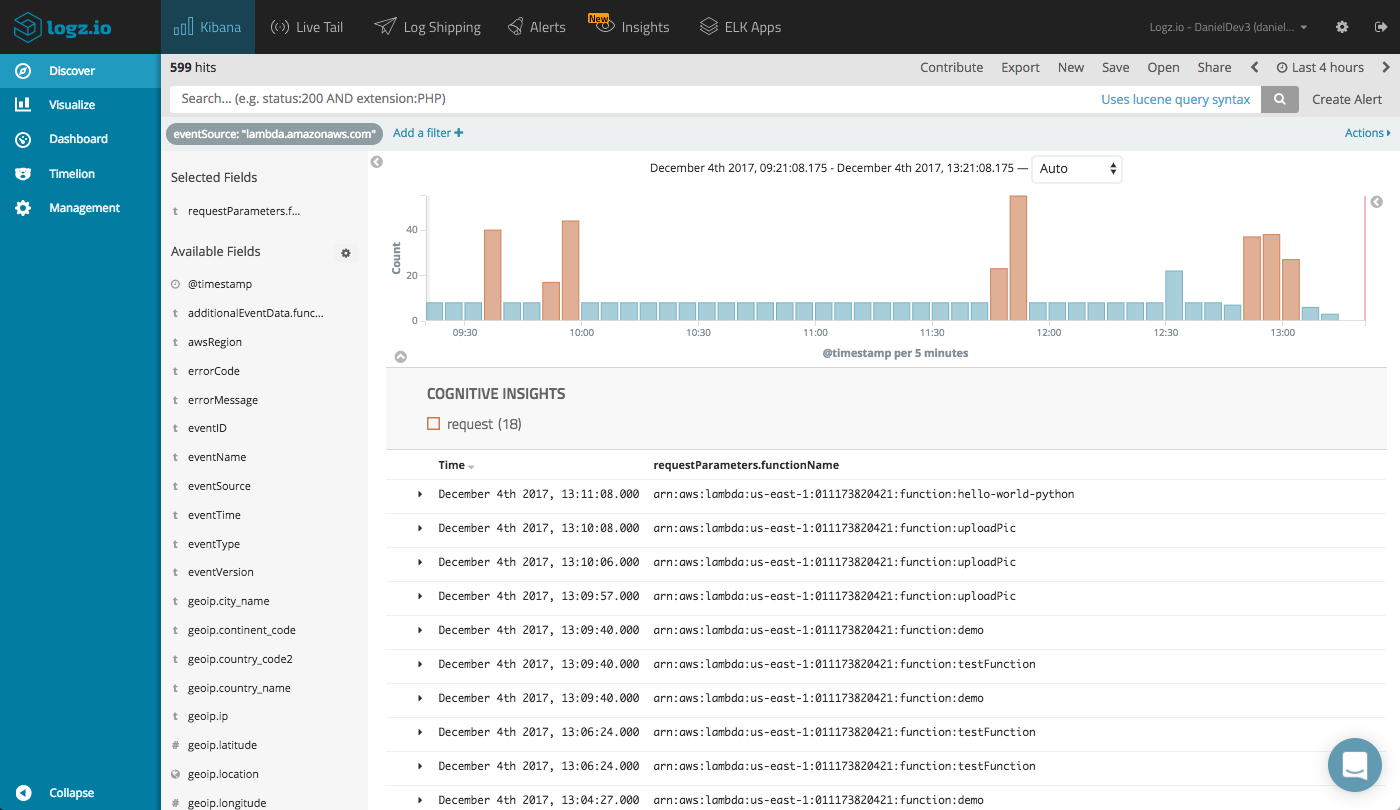
The Lambda data recorded by CloudTrail and indexed in Elasticsearch has a number of useful fields that can be used for analysis. Adding some of these fields to the main display area in the Discover tab helps give us a clearer picture of the list of records that quickly accumulates.
For example, we can add the name of the function (requestParametrers.functionName), the AWS region (awsRegion) and a bunch of fields relating to the user identity (e.g. userIdentity.type, userIdentity.userName, etc.). Here’s a sample of one of the records for an idea of the available information (I replaced sensitive info with xxx).
"_source": {
    "eventID": "2ea1aed7-9817-4b1c-aed6-304ac4bbf6ac",
    "awsRegion": "ap-southeast-2",
    "geoip": {
        "city_name": "Kiryat Ono",
        "timezone": "Asia/Jerusalem",
        "ip": "79.182.131.17",
        "latitude": 32.055,
        "country_name": "Israel",
        "country_code2": "IL",
        "continent_code": "AS",
        "region_name": "TA",
        "location": [
            34.8579,
            32.055
        ],
        "real_region_name": "Tel Aviv",
        "longitude": 34.8579
    },
    "eventVersion": "1.05",
    "sourceIPAddress": "79.182.131.17",
    "eventSource": "lambda.amazonaws.com",
    "requestParameters": {
        "functionName": "arn:aws:lambda:ap-southeast-2:xxx:function:callApp"
    },
    "userAgent": "aws-internal/3",
    "userIdentity": {
        "accessKeyId": "xxx",
        "sessionContext": {
            "attributes": {
                "mfaAuthenticated": "false",
                "creationDate": "2017-12-04T10:57:44Z"
            }
        },
        "accountId": "xxx",
        "principalId": "xxx",
        "type": "IAMUser",
        "arn": "arn:aws:iam::xxx:user/john",
        "userName": "john"
    },
    "eventType": "AwsApiCall",
    "type": "cloudtrail",
    "tags": [
        "cloudtrail-geoip"
    ],
    "@timestamp": "2017-12-04T10:58:33.000+0000",
    "requestID": "120ba1fe-d8e2-11e7-905f-e36b765814a4",
    "eventTime": "2017-12-04T10:58:33Z",
    "eventName": "ListEventSourceMappings20150331",
    "recipientAccountId": "xxx"
}
Building a Monitoring Dashboard
Of course, Kibana is renowned for its visualization capabilities and in this context, can be a extremely useful for building a monitoring dashboard of your Lambda activity.
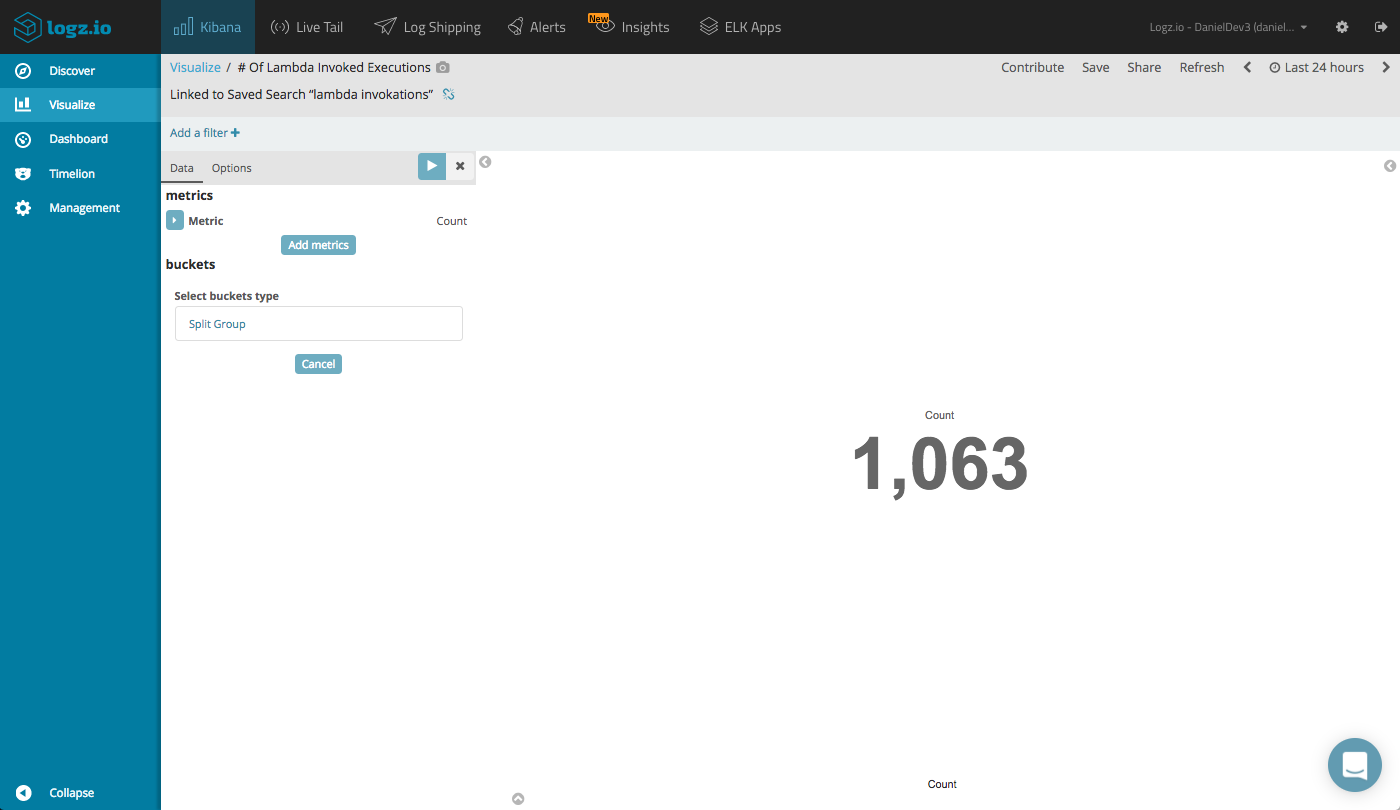
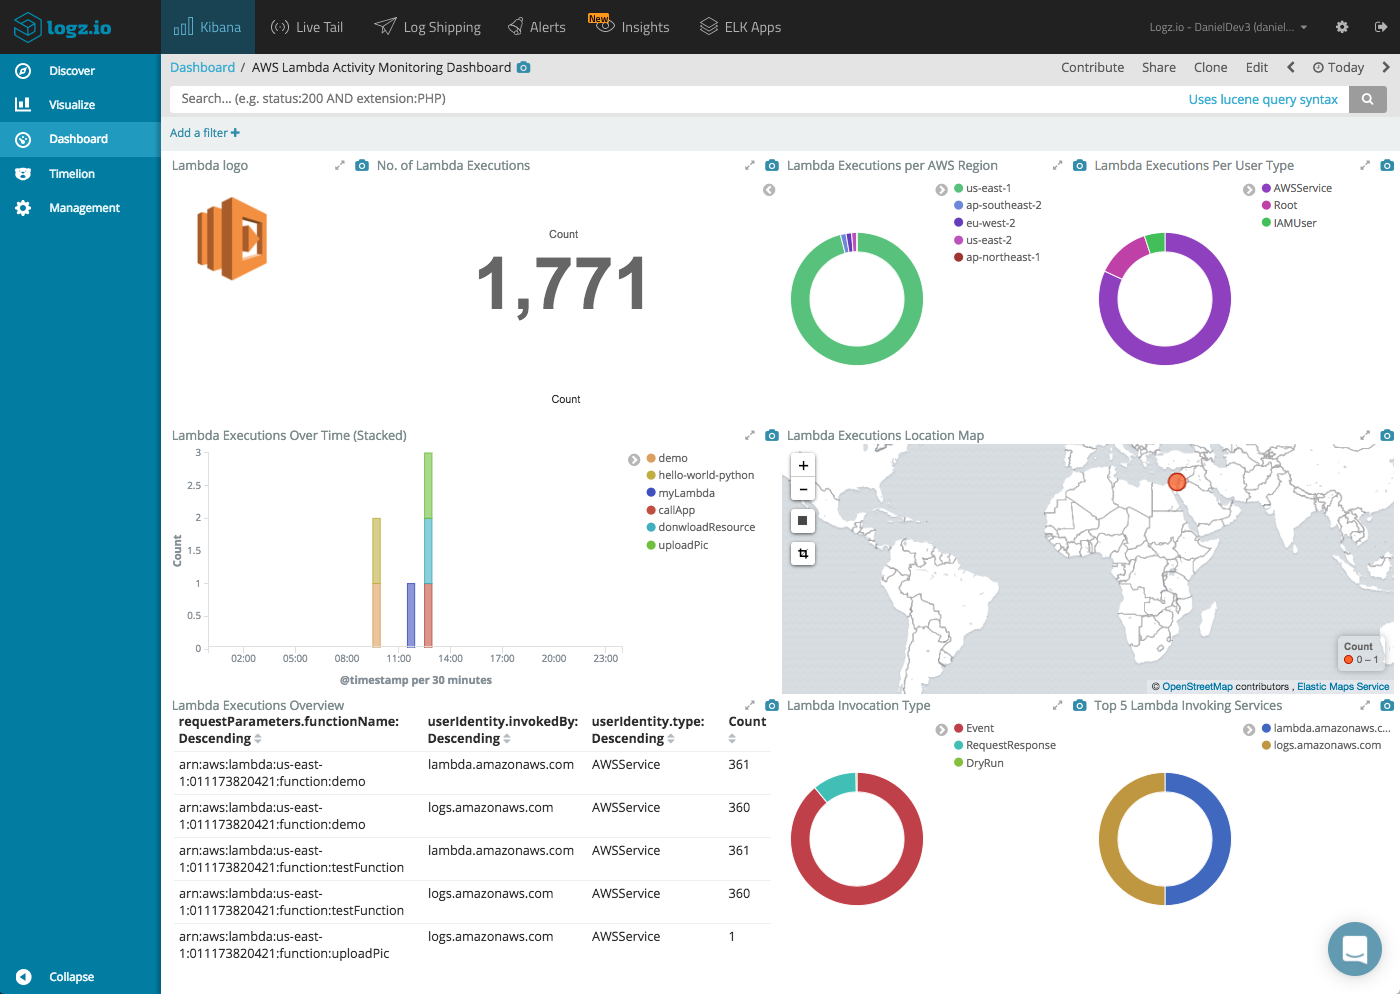
The most basic Metric visualization will tell us how many times our Lambdas have been invoked.
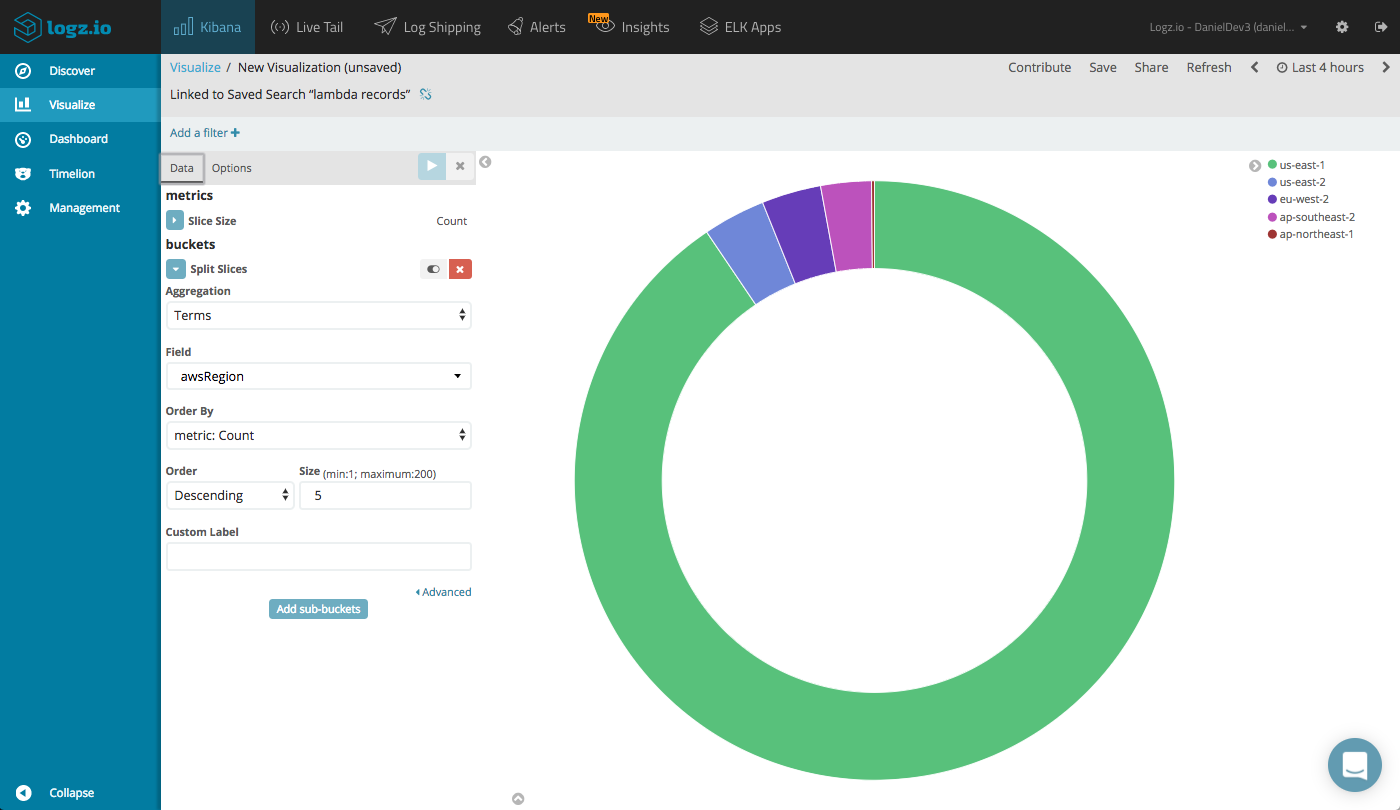
Another example is a Pie Chart visualization that gives us an idea of what regions our Lambdas are being invoked in.
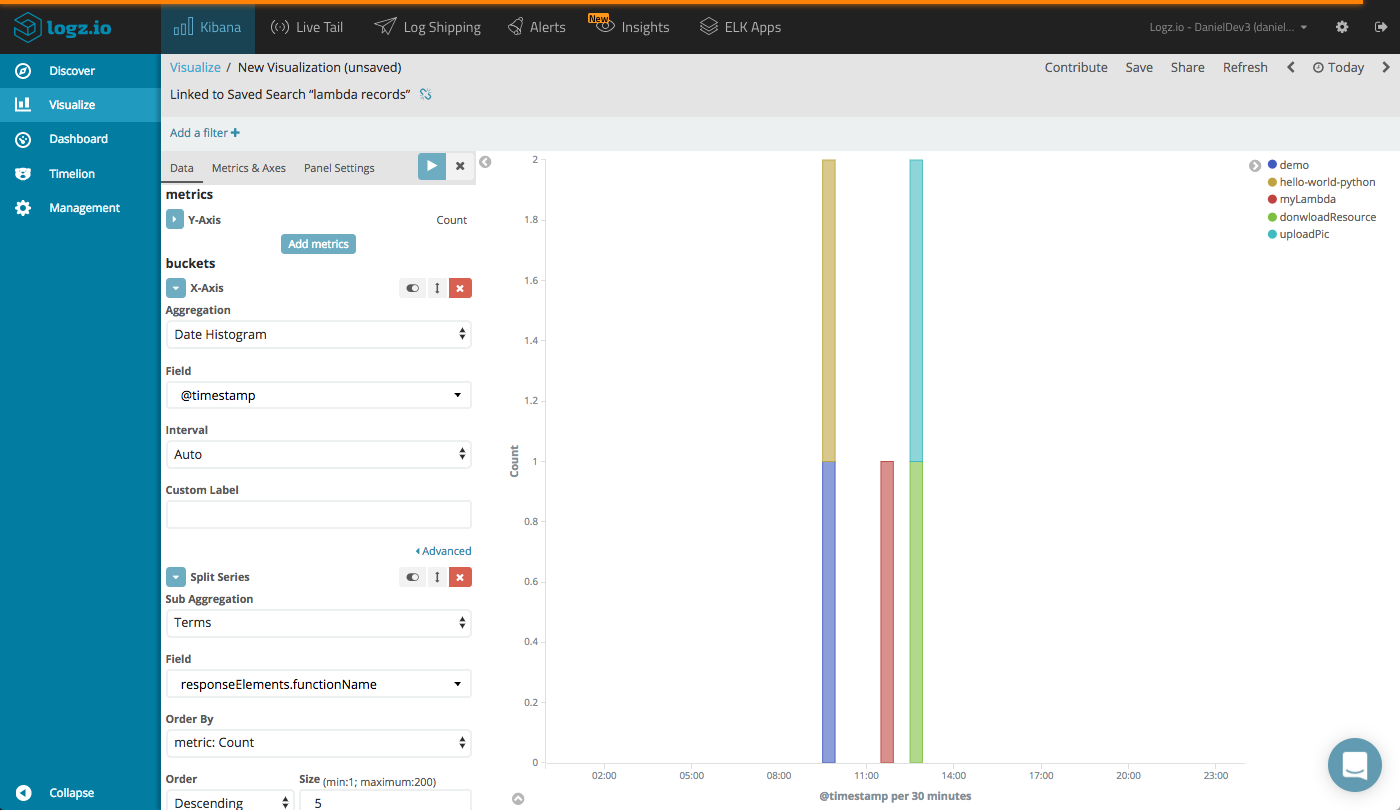
Or, we can see a breakdown of the executed functions with a vertical Bar Chart visualization using the responseElements.functionName field.
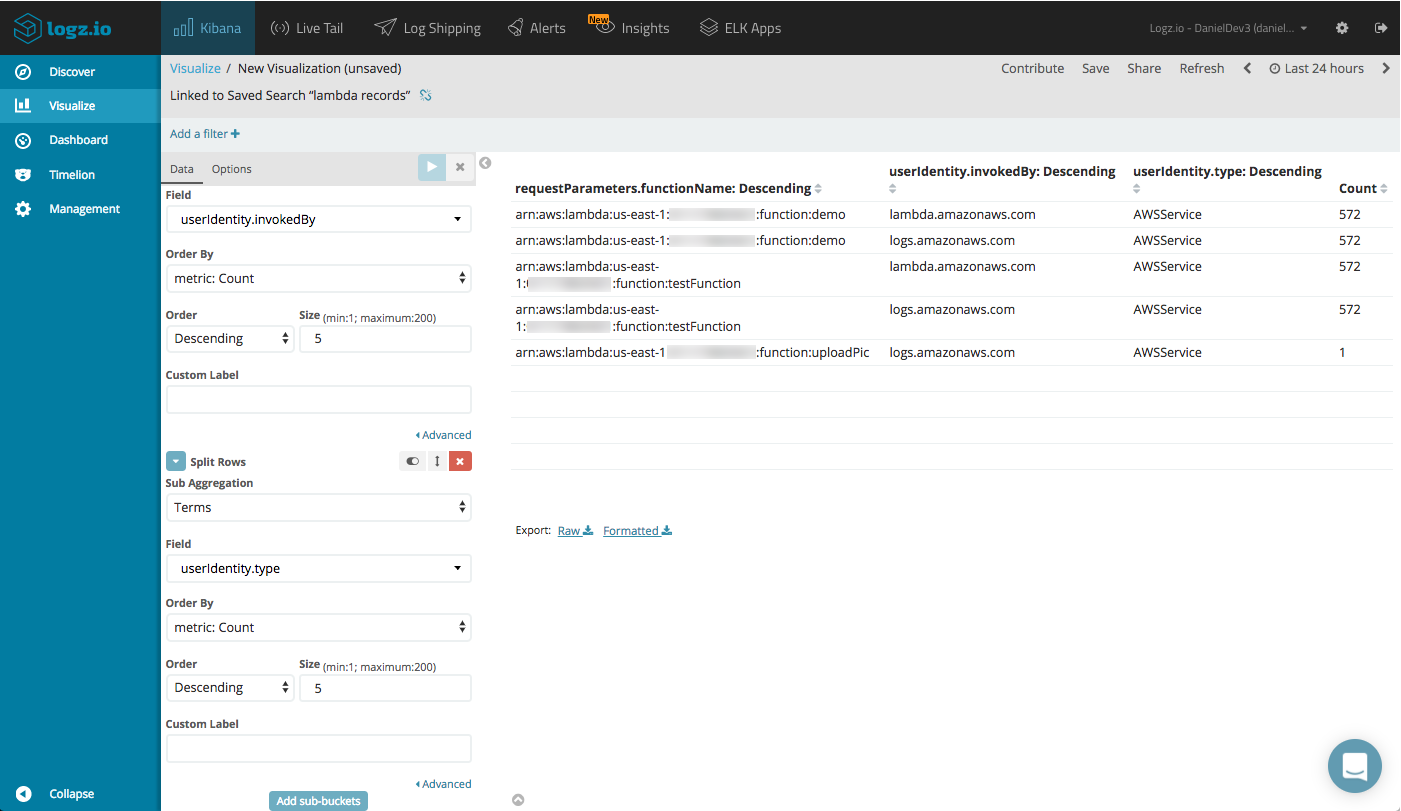
A Data Table visualization can give us a nice overview of the different functions — showing the number of invocations, and the AWS service and user invoking the function.
You can place all these visualizations into one nice comprehensive dashboard that will give you a nice overview of the different Lambda invocations in your AWS account. This dashboard is available in ELK Apps – Logz.io’s library of pre-made dashboards and visualizations– so you don’t have to build it from scratch on your own.
Summing it Up
This added capability in CloudTrail seems to have gone almost unnoticed in the noise of the other news coming out of re:Invent but is no less important. As Lambda gains popularity and is used by more and more companies in production, the need for an effective monitoring and auditing system intensifies.
Getting the records into S3 is great, but you will need to integrate with a 3rd party analysis tool such as the ELK Stack to go all the way. Logz.io’s integration and support for CloudTrail data will take you through all the steps necessary to set up a monitoring environment for Lambda invoke API activity.
Published at DZone with permission of Daniel Berman. See the original article here.
Opinions expressed by DZone contributors are their own.
Comments