Monitoring Kafka Data Pipeline
Learn how to use open-source tools to develop a monitoring and testing solution for a pipeline using Kafka without writing any code.
Join the DZone community and get the full member experience.
Join For FreeData pipelines for processing streaming data are common in IoT systems. However, it presents a unique challenge to test the functionality of such a system because of the streaming nature of the input data. Since the input never ends, in order to test the system, we have to create a never-ending stream of data for input and check the streaming output messages to see if the overall system is working as desired. It is difficult to see if the system is working fine unless we can visually check the data flowing through the input and output streams. In this article, we will build a visualization solution to monitor incoming and output messages in a data pipeline built using Kafka. We will use open-source tools for building this solution without writing any code.
Example Scenario
A common use case for Kafka is to act as a buffer for incoming streaming data that might be coming from sensors installed in an industrial environment. This data is then sent to a processing pipeline and finally, output derived messages are sent to another Kafka topic for the consumers to act upon. This is typical in IoT use cases, as illustrated below.
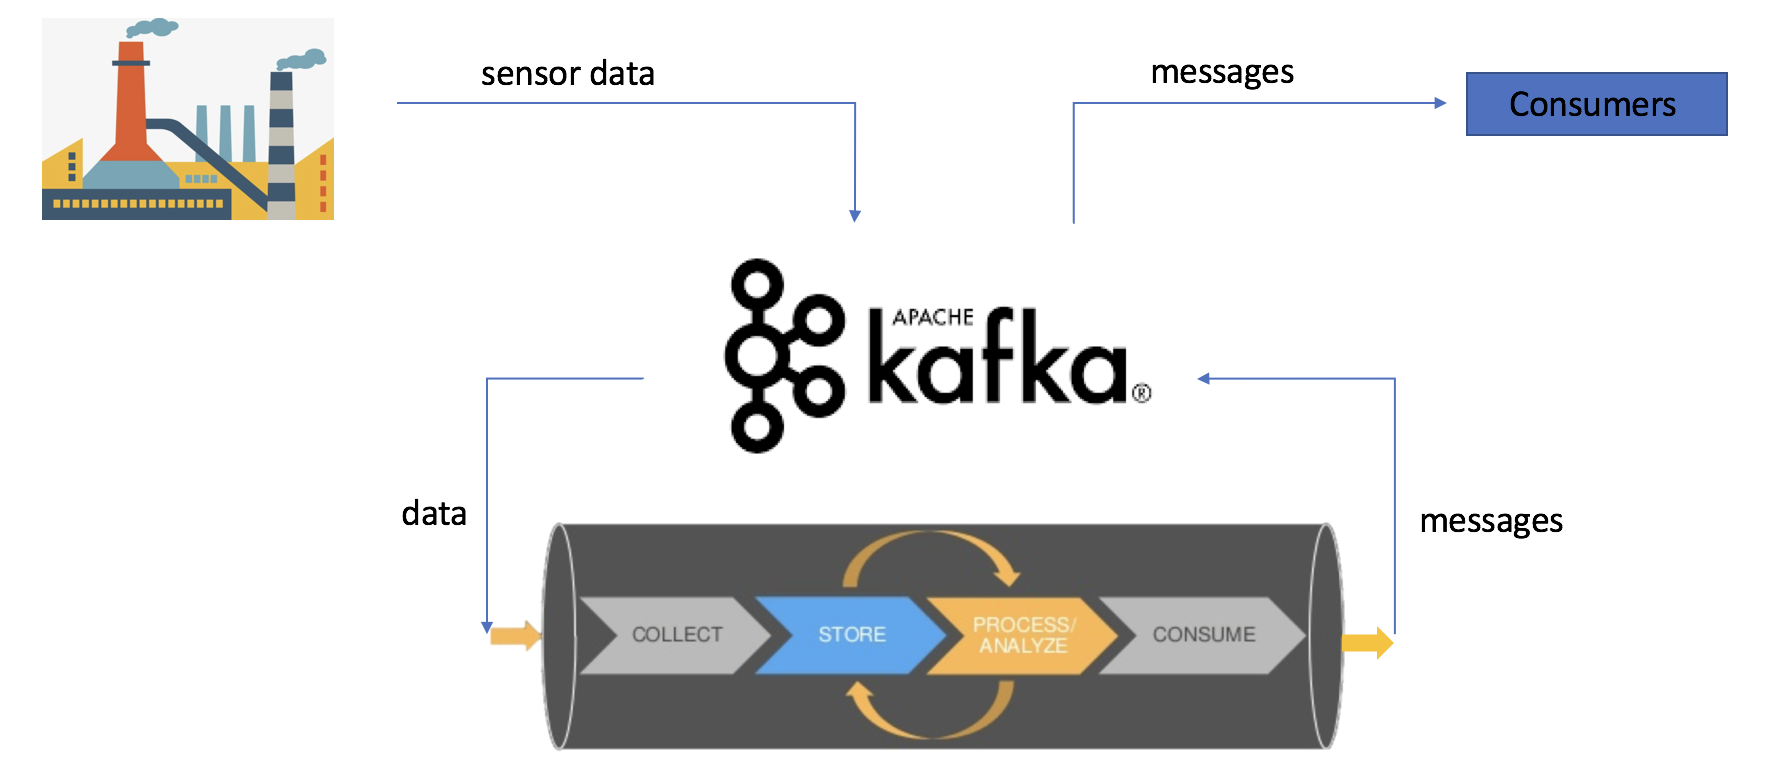
Let's assume that we have the above data pipeline deployed in production and we would like to monitor the data coming into the input topic and the message published to output topic. This may be required to ascertain if the pipeline is processing data as expected, i.e. the correct output messages are indeed getting generated for the incoming streaming data.
In our hypothetical scenario, let's assume that we have a set of temperature sensors sending temperature measurements. Assume that whenever the temperature is in the range 10-20 degrees Celsius, an alert should be raised. The measurement of events from sensors sent to the input Kafka topic is a JSON object:
{
      "event": {
        "payloadData": {
          "tag_id": “TEMPERATURE",
          "timestamp": 1516342733,
          "value": 18
        }
    }
}
And the alert messages generated by the processing pipeline, if the temperature is in the range 10-20 degrees Celsius, are JSON objects like the following:
{
"event": {
"payloadData": {
"message": “Temperature is 18",
"asset_name": “Sensor1",
"value": 18,
"timestamp": 1516342733
}
}
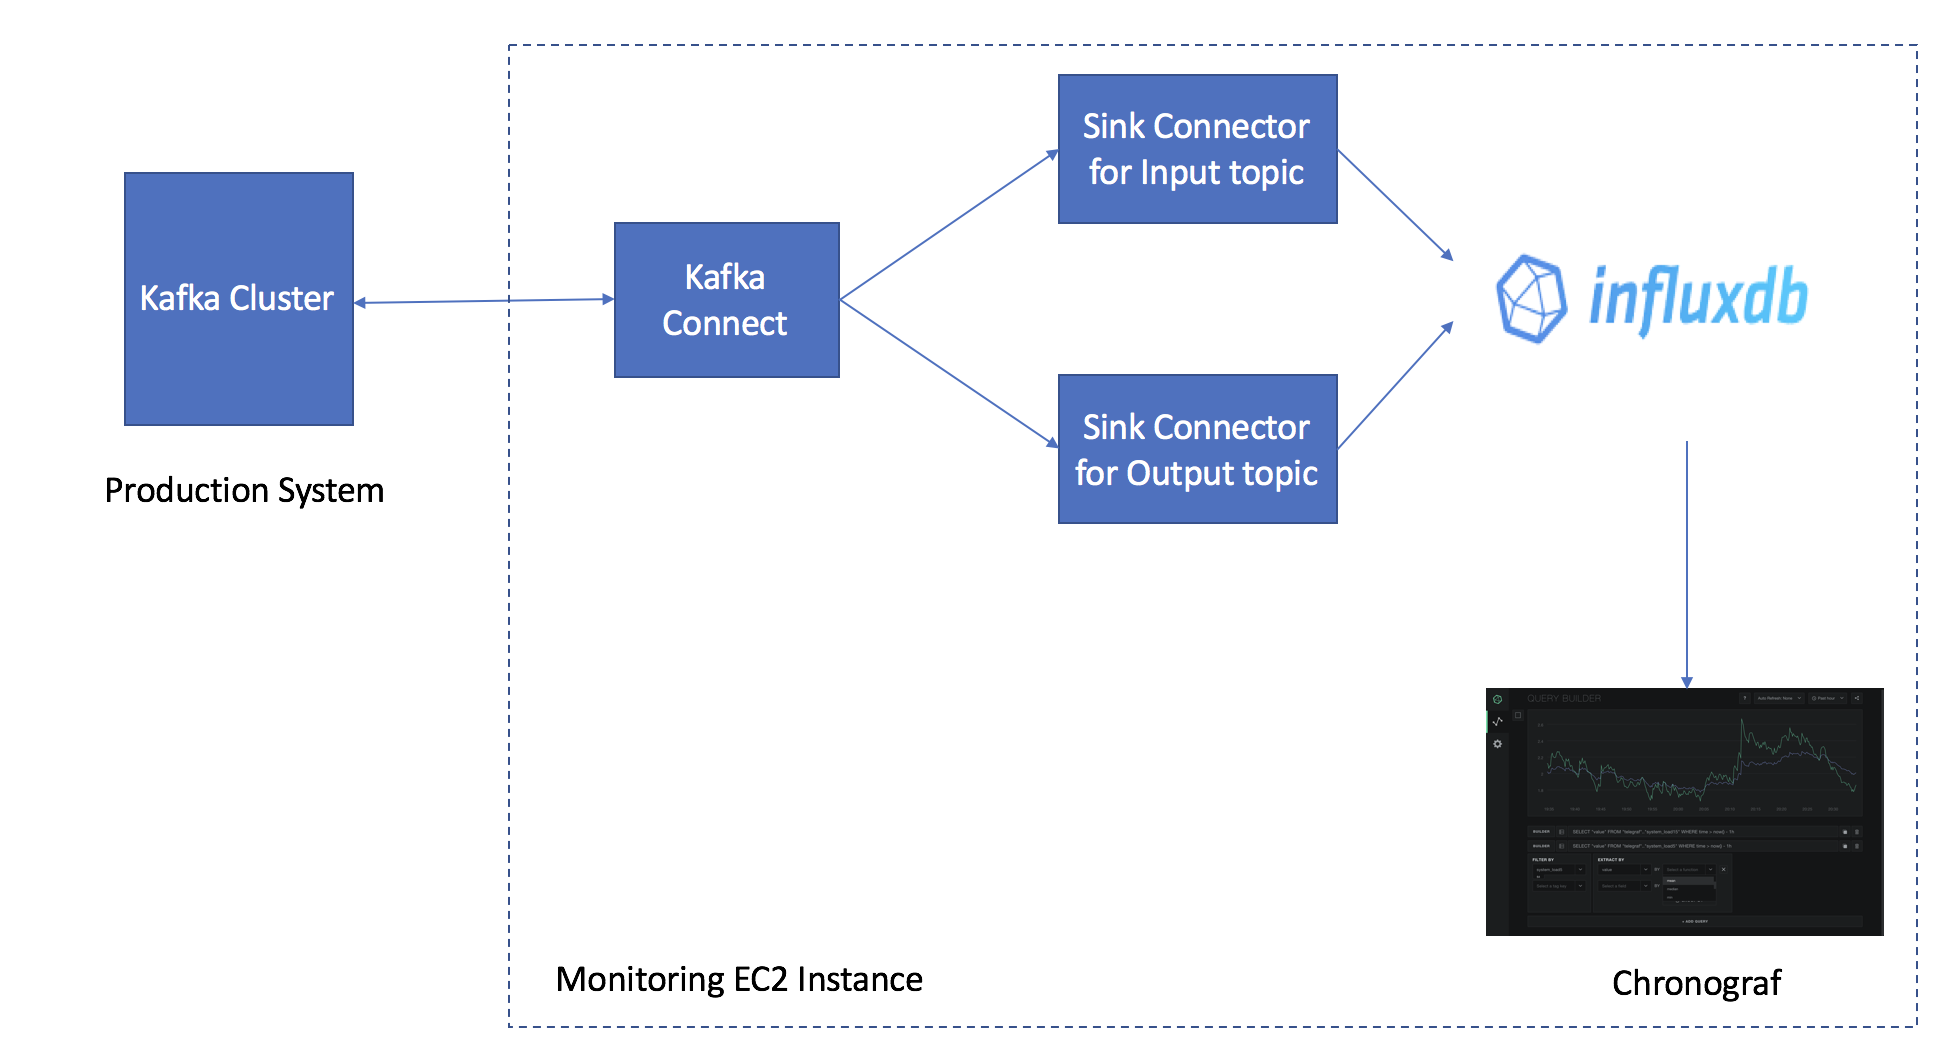
}The solution uses the following open-source tools. The solution architecture is illustrated below.
Apache Kafka Connect is a tool to stream data between Apache Kafka and other components.
InfluxDB which is a time series database from InfluxData. It will be used to store time series data from Kafka input and output topics.
Influx sink connector from Datamountaineer. It is a connector and sink to write events from Kafka to InfluxDB.
Chronograf is an open-source monitoring solution from InfluxData.
Monitoring Solution Setup
We will use an AWS t2.mini instance with a CentOS 7 image to set up the tools. Make sure Java 8 is installed on your machine.
Kafka Connector Setup
Download Apache Kafka (>=0.11.0.1). Extract contents to a directory of your choice, say, ~/kafka.
Go to ~/kafka. Edit the file at config/connect-distributed.properties and change bootstrap.servers to include the IPs and ports of the Kafka Brokers in your cluster. Set plugin.path=<directory of your choice>.
Download InfluxDB Kafka Connector. Extract the contents in the path set in the plugin.path property.
We have events in JSON format and we do not want to enforce any schema.
key.converter=org.apache.kafka.connect.json.JsonConverter
value.converter=org.apache.kafka.connect.json.JsonConverter
key.converter.schemas.enable=false
value.converter.schemas.enable=false
Start Kafka Connect in distributed mode. You can tail the nohup.out for logs. Kafka Connect has a REST interface available at port 8083.
nohup bin/connect-distributed.sh config/connect-distributed.properties &InfluxDB and Sink Connectors Setup
Download and install InfluxDB.
wget https://dl.influxdata.com/influxdb/releases/influxdb-1.4.2.x86_64.rpm
sudo yum localinstall influxdb-1.4.2.x86_64.rpm
Launch the InfluxDB client and create a database. The time series data from input and output Kafka topics will be stored in this database.
influx
> CREATE DATABASE sensordb
Create sink connectors for Kafka input and output topics.
curl -s -X POST -H "Content-Type: application/json" \
--data '{"name": "influxdb-input-topic-sink", \
    "config":{ \
    "connector.class":\
        "com.datamountaineer.streamreactor.connect.influx.InfluxSinkConnector",\
    "tasks.max":"1",
    "topics":"input-topic" \
    "connect.influx.kcql":"INSERT INTO inputEvents SELECT event.payloadData.value\
    FROM input-topic WITHTIMESTAMP sys_time()" \
"connect.influx.url": "http://localhost:8086" \
"connect.influx.db":"sensordb" \
}}' http://127.0.0.1:8083/connectors

curl -s -X POST -H "Content-Type: application/json" \
--data '{"name": "influxdb-output-topic-sink", \
    "config":{ \
    "connector.class":\
        "com.datamountaineer.streamreactor.connect.influx.InfluxSinkConnector",\
    "tasks.max":"1",
    "topics":"output-topic" \
    "connect.influx.kcql":"INSERT INTO outputEvents SELECT event.payloadData.value\
    FROM output-topic WITHTIMESTAMP sys_time()" \
"connect.influx.url": "http://localhost:8086" \
"connect.influx.db":"sensordb" \
}}' http://127.0.0.1:8083/connectors
Check if connectors have been created successfully. If the connectors are not returned, check logs for errors.
curl -s 127.0.0.1:8083/connectorsChronograf Setup
Download and install Chronograf. Refer to details to get started with Chronograf.
wget https://dl.influxdata.com/chronograf/releases/chronograf-1.4.0.1.x86_64.rpm
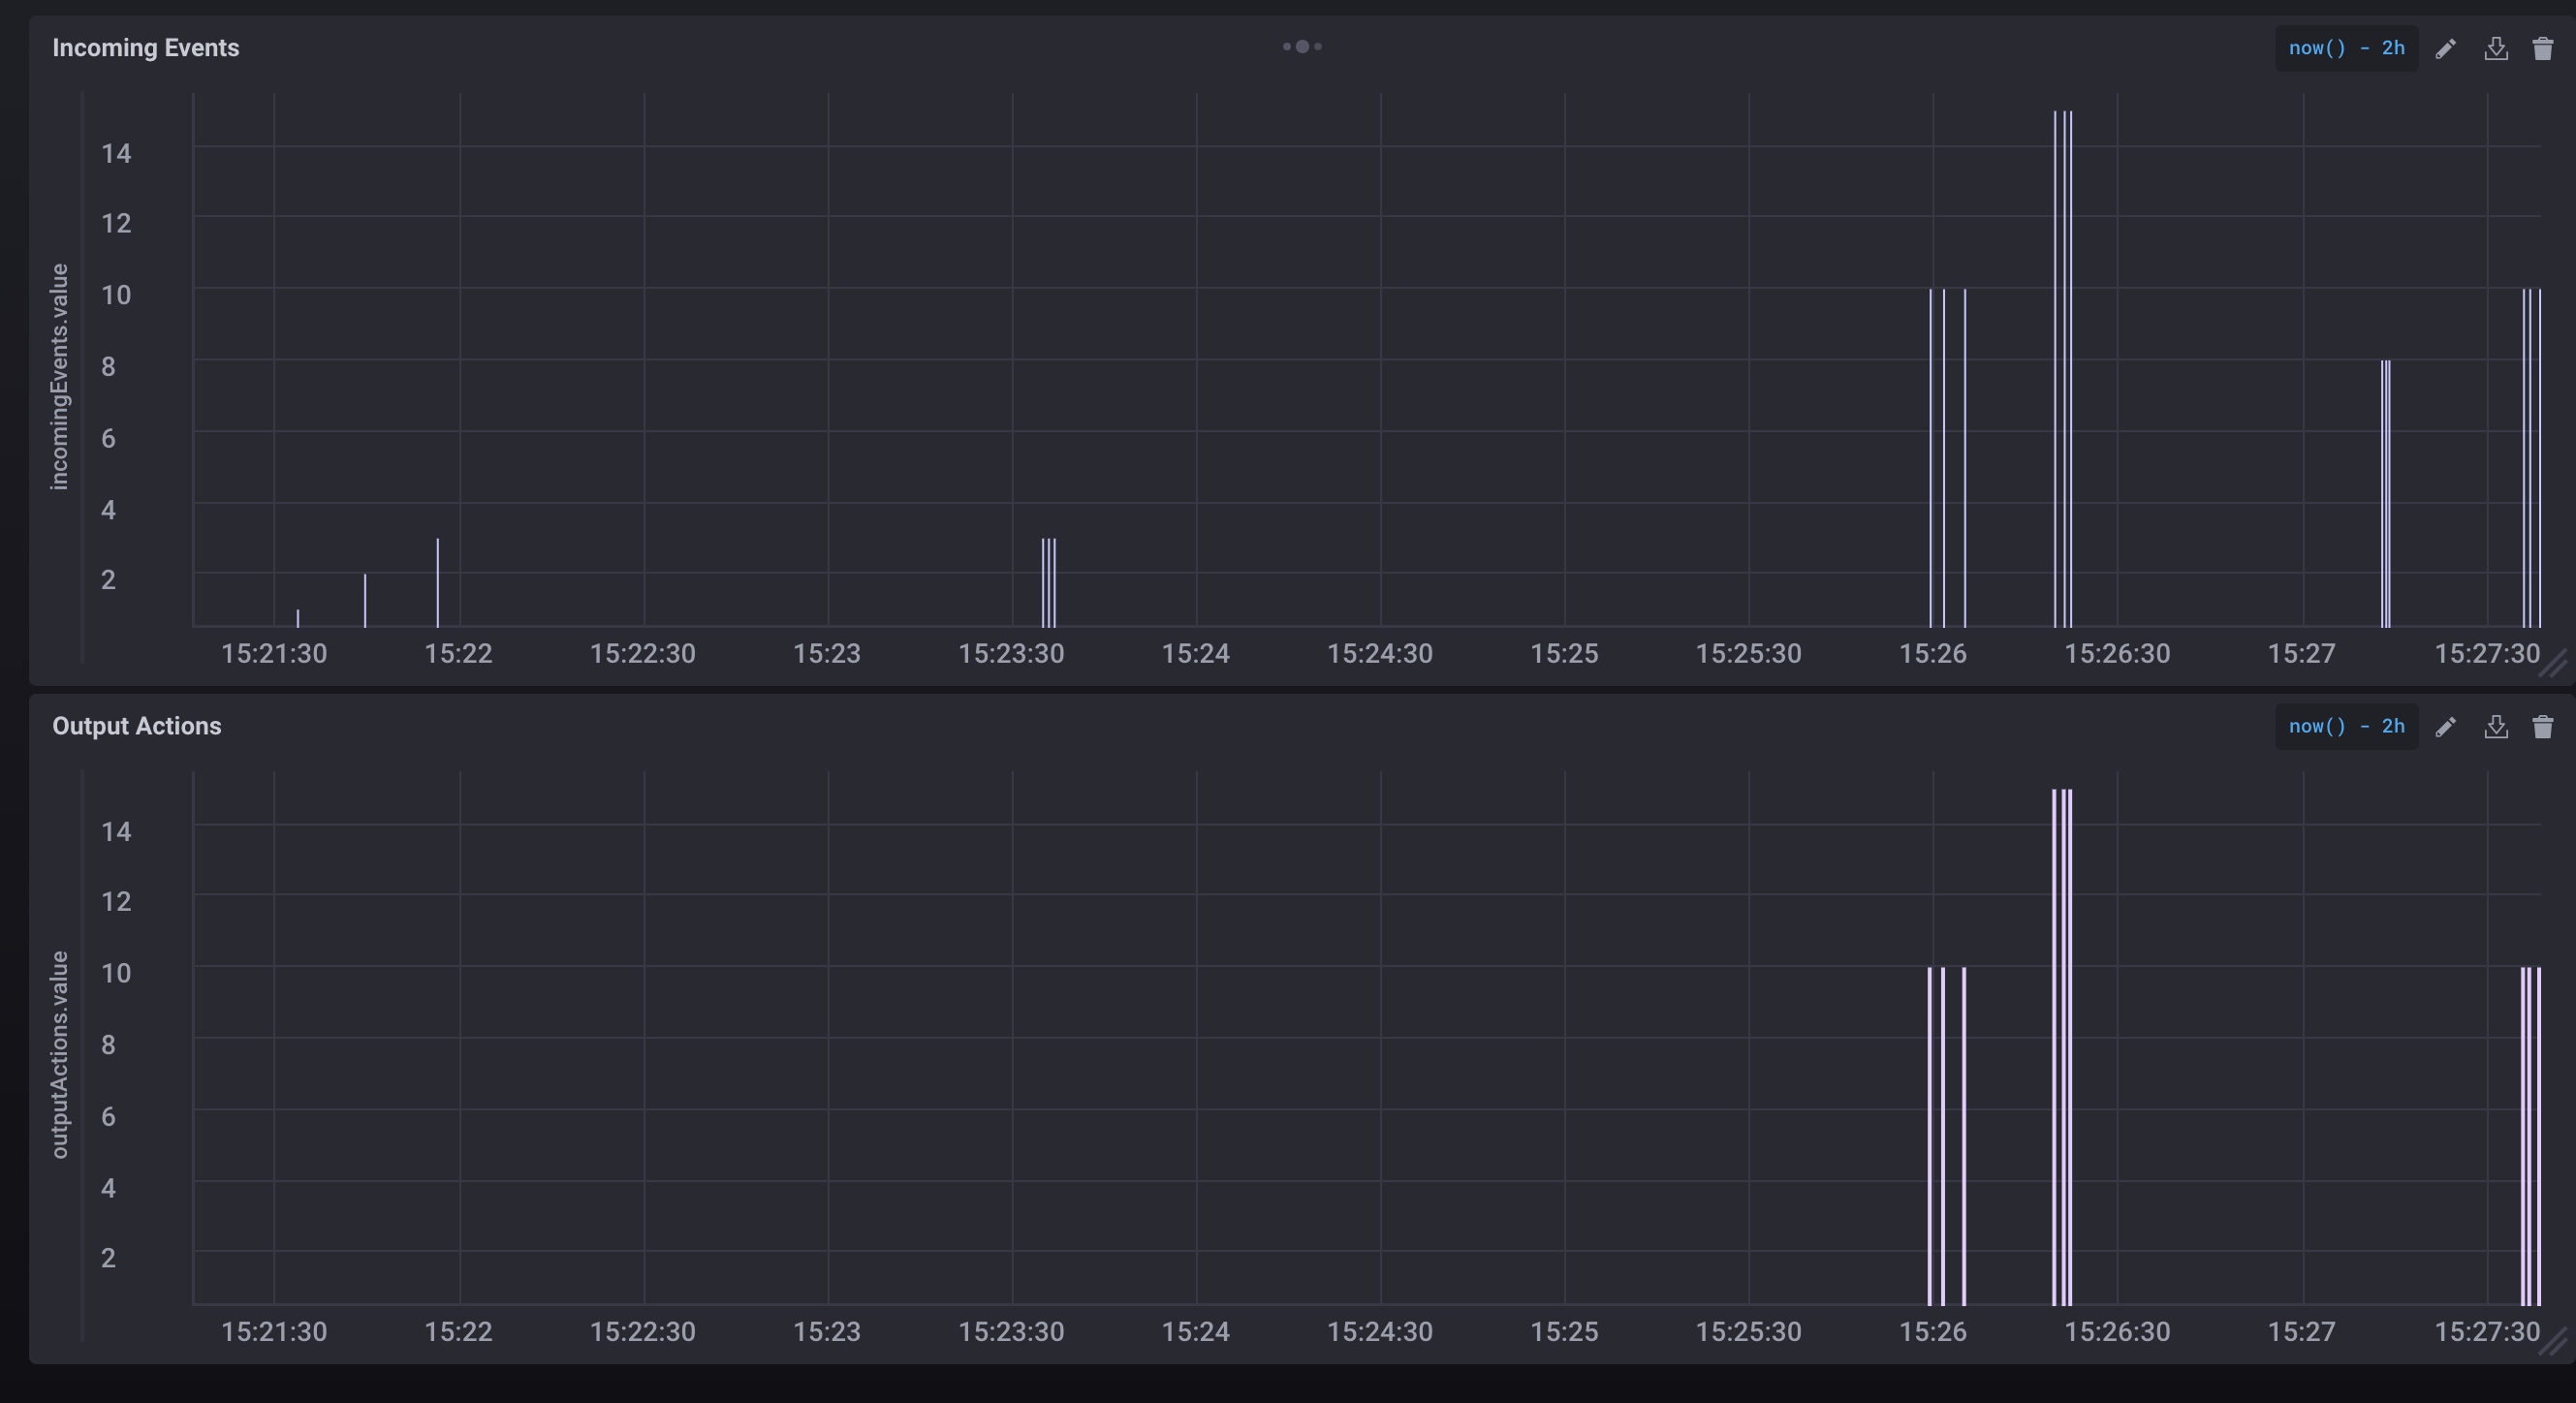
sudo yum localinstall chronograf-1.4.0.1.x86_64.rpmCreate a dashboard with two cells: one for plotting the values of input events and the other for values of the output events. We would like to confirm if the inputs values in the range 10-20 degrees Celsius result in the generation of output events. Use the following queries to create charts in the cells for plotting time series values for the last two hours.
SELECT “value” FROM “sensordb”.“autogen”.“outputActions” WHERE time > now() - 2h
SELECT “value” FROM “sensordb”.“autogen”.“incomingEvents” WHERE time > now() - 2h
The dashboard with the corresponding charts is shown below. The first cell is plotting the incoming events and the second cell displays the output messages if they are generated by the pipeline. By looking at the charts, we can visually satisfy ourselves that the system is behaving as designed.
In this article, we used open-source tools to develop a monitoring and testing solution for a pipeline using Kafka without writing any code. We were able to visually check the functionality of the streaming pipeline, which is difficult to verify otherwise.
Opinions expressed by DZone contributors are their own.
Comments