Monitoring Microsoft Azure With Logz.io
Take a look at how you can monitor your Azure instance and create dashboards with other integrations.
Join the DZone community and get the full member experience.
Join For FreeMicrosoft Azure has long proven it’s a force to be reckoned with in the world of cloud computing. Over the past year, Azure has made some significant steps in bridging the gap with AWS by offering new services and capabilities as well as competitive pricing.
A growing number of our users are Azure fans, and so we’re happy to introduce a new Logz.io integration for Azure as well as premade dashboards for monitoring different Azure resources!
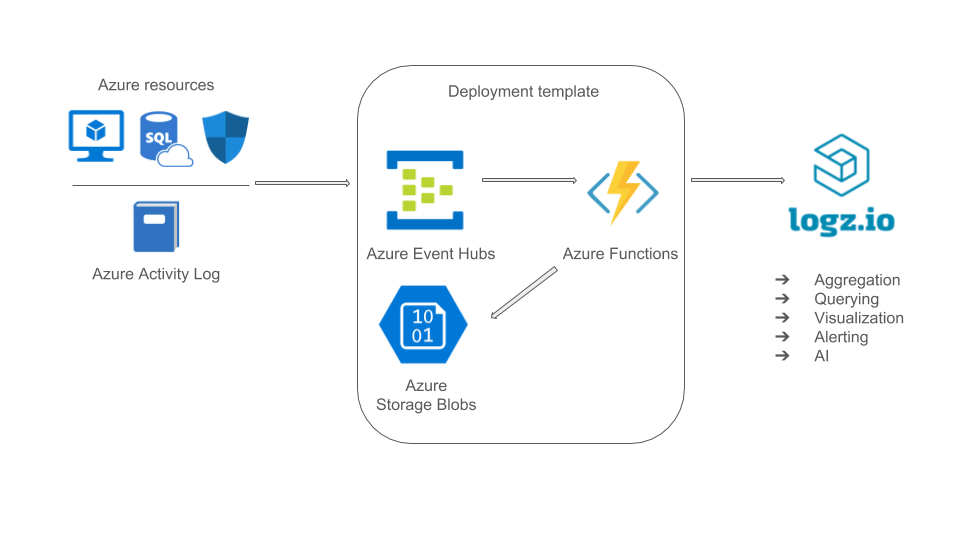
The integration is based on a ready-made Azure deployment template that sets up all the necessary building blocks of the pipeline — an Events Hub namespace, two Events Hubs, an Azure Function app, two Azure Functions, two Azure Storage Blobs, and all the correct permissions and connections required.
How Does It Work?
The Azure functions are triggered by data streamed to an Event Hub from your Azure resources. The functions process the data, whether logs or metrics, and forward it to a Logz.io account for aggregation and analysis. For backups and archiving, you can use the Azure Storage Blob created as part of the deployment.
In this article, I’ll take you through the steps for deploying this template and using it to integrate your Azure environment with Logz.io.
Deploying the Template
Our first step is to deploy the Logz.io Azure integration template.
You could upload the template manually by copying the template code and uploading it to the Azure portal but the easiest way is to use the Deploy to Azure button displayed in the first step of the repo’s readme:
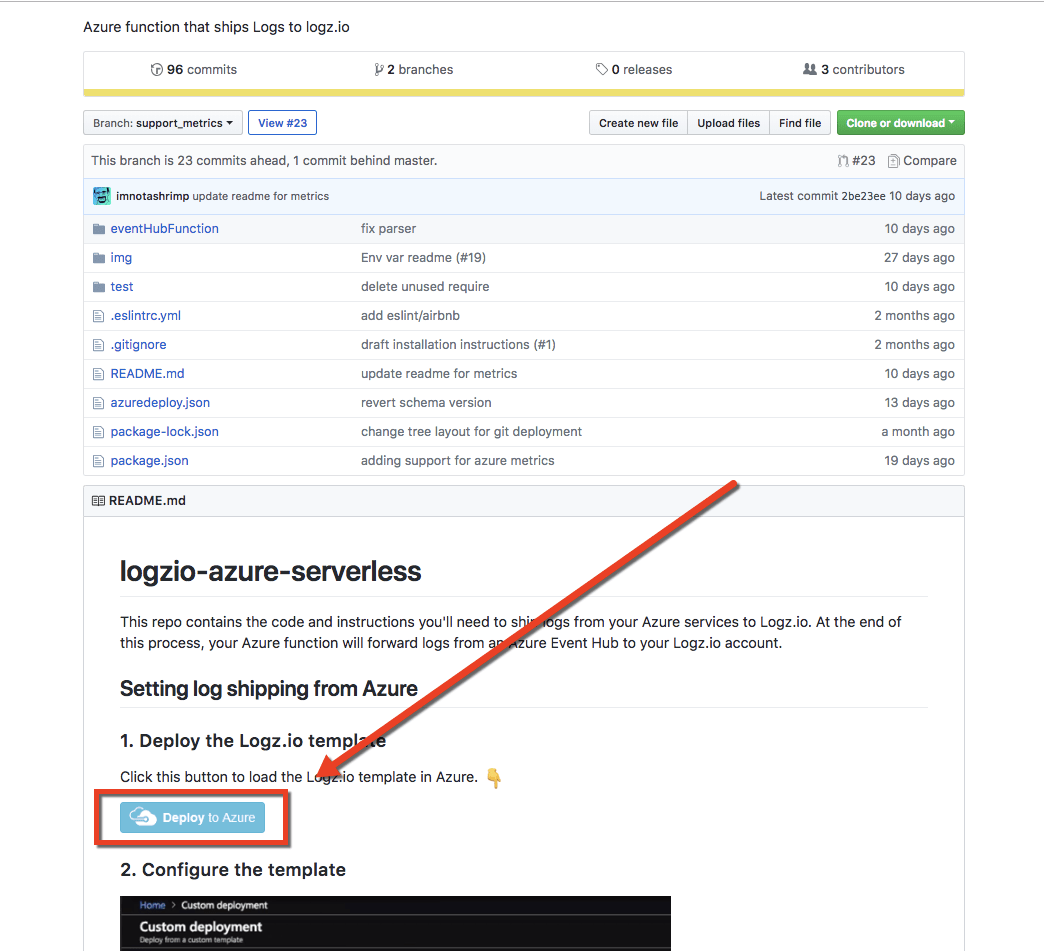
Once clicked, the Custom Deployment page in the Azure portal will be displayed with a list of pre-filled fields.
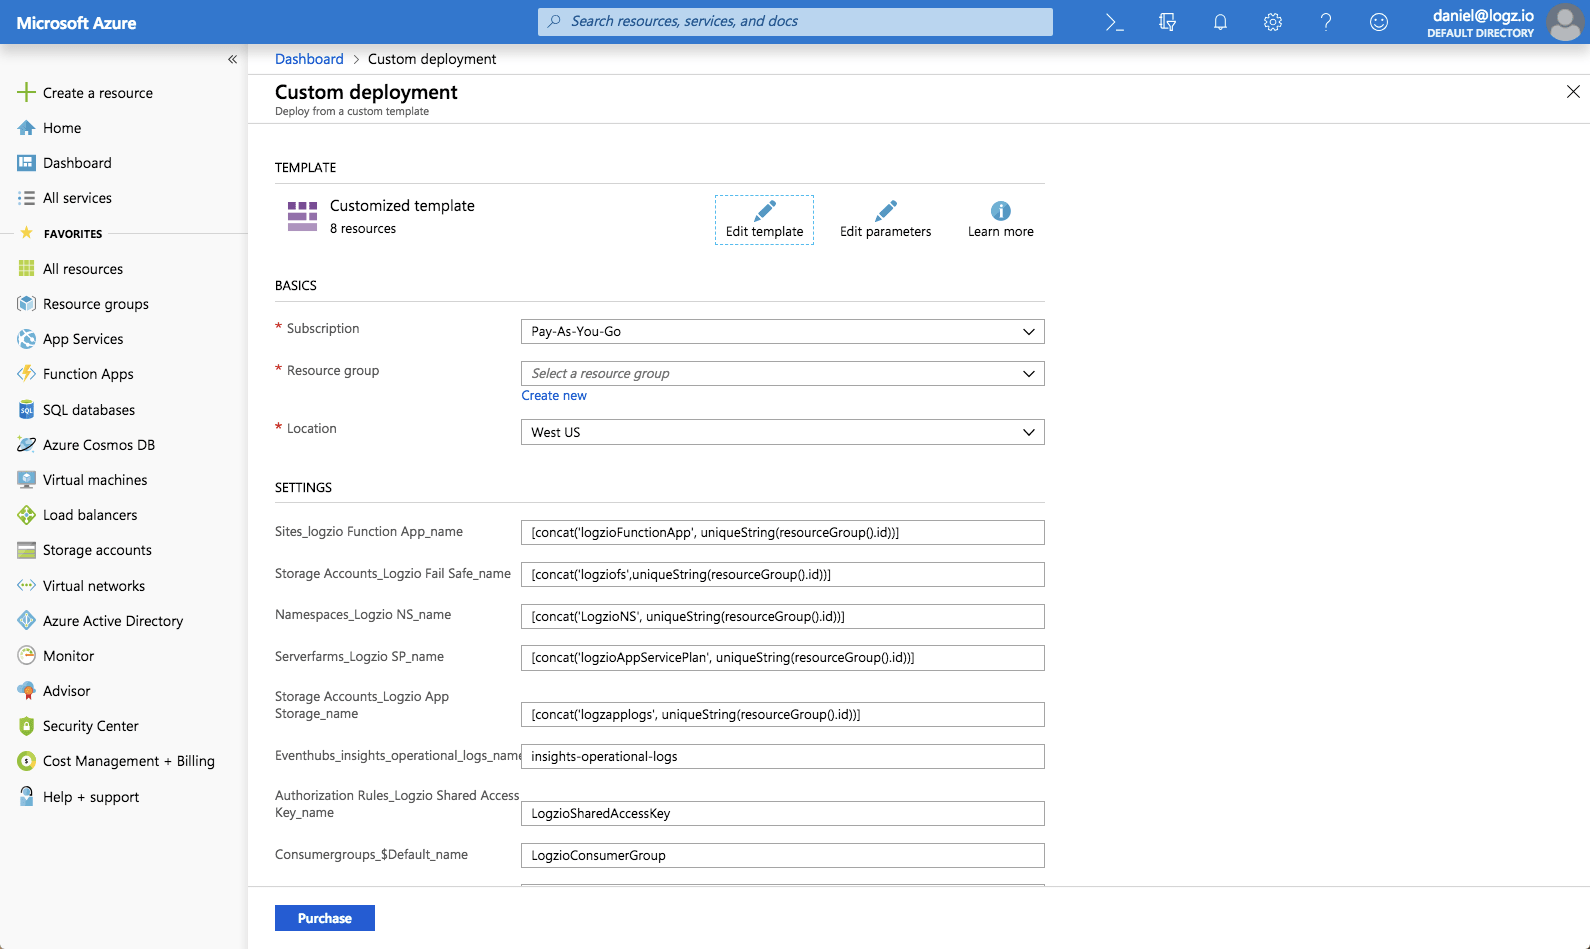
You can leave most of the fields as-is but be sure to enter the following settings:
- Resource group: Either select an existing group or create a new one.
- Logzio Logs Host: Enter the URL of the Logz.io listener. If you’re not sure what this URL is, check your login URL – if it’s app.logz.io, use listener.logz.io (this is the default setting). If it’s app-eu.logz.io, use listener-eu.logz.io.
- Logzio Metrics Host: Enter the URL of the Logz.io listener. If you’re not sure what this URL is, check your login URL – if it’s app.logz.io, use listener.logz.io (this is the default setting). If it’s app-eu.logz.io, use listener-eu.logz.io.
- Logzio Logs Token: Enter the token of the Logz.io account you want to ship Azure logs to. You can find this token on the account page in the Logz.io UI.
- Logzio Metrics Token: Enter a token for the Logz.io account you want to use for shipping Azure metrics to. You can use the same account used for Azure logs.
Agree to the terms at the bottom of the page, and click Purchase.
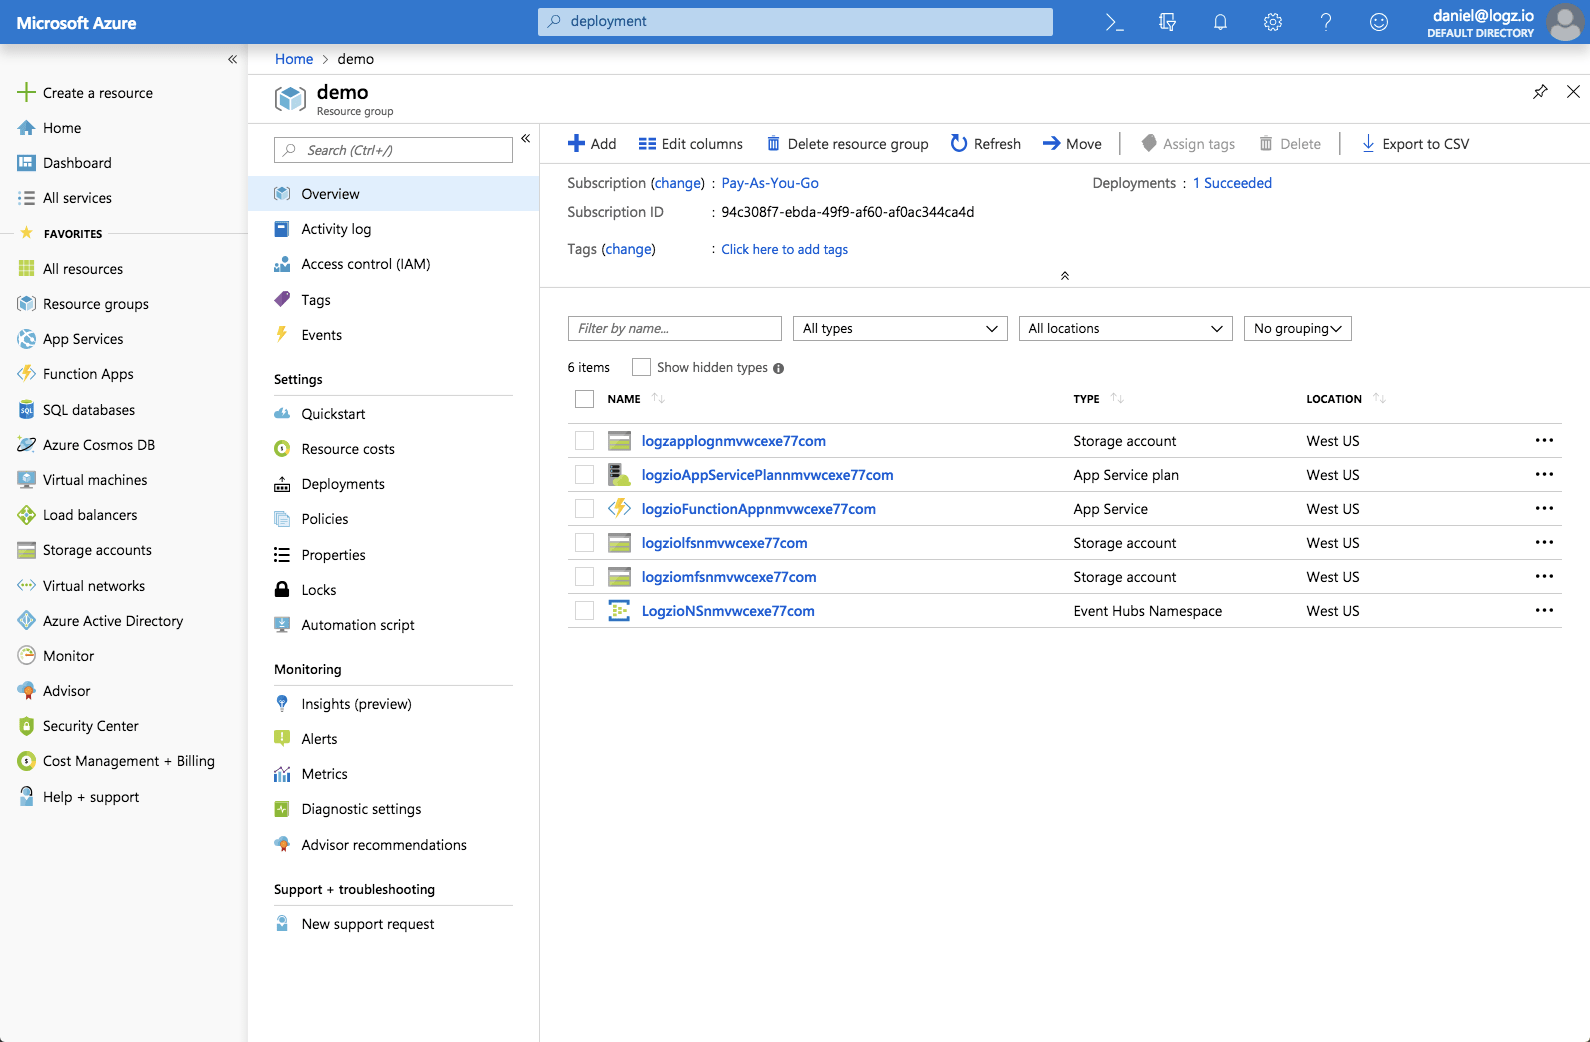
Azure will then deploy the template. This may take a while as there is a long list of resources to be deployed, but after a minute or two, you will see the Deployment succeeded message at the top of the portal.
You can visit the defined resource group to review the deployed resources:
Streaming Azure Monitoring Data to Logz.io
Azure Monitor collects a large amount of operational data from various Azure resources to provide users with insight into how these resources are running. This data can be either metrics or logs, and can be sent to an Azure storage account or Event Hubs for archiving and streaming into third-party applications. We will be using the latter option for streaming data into Logz.io.
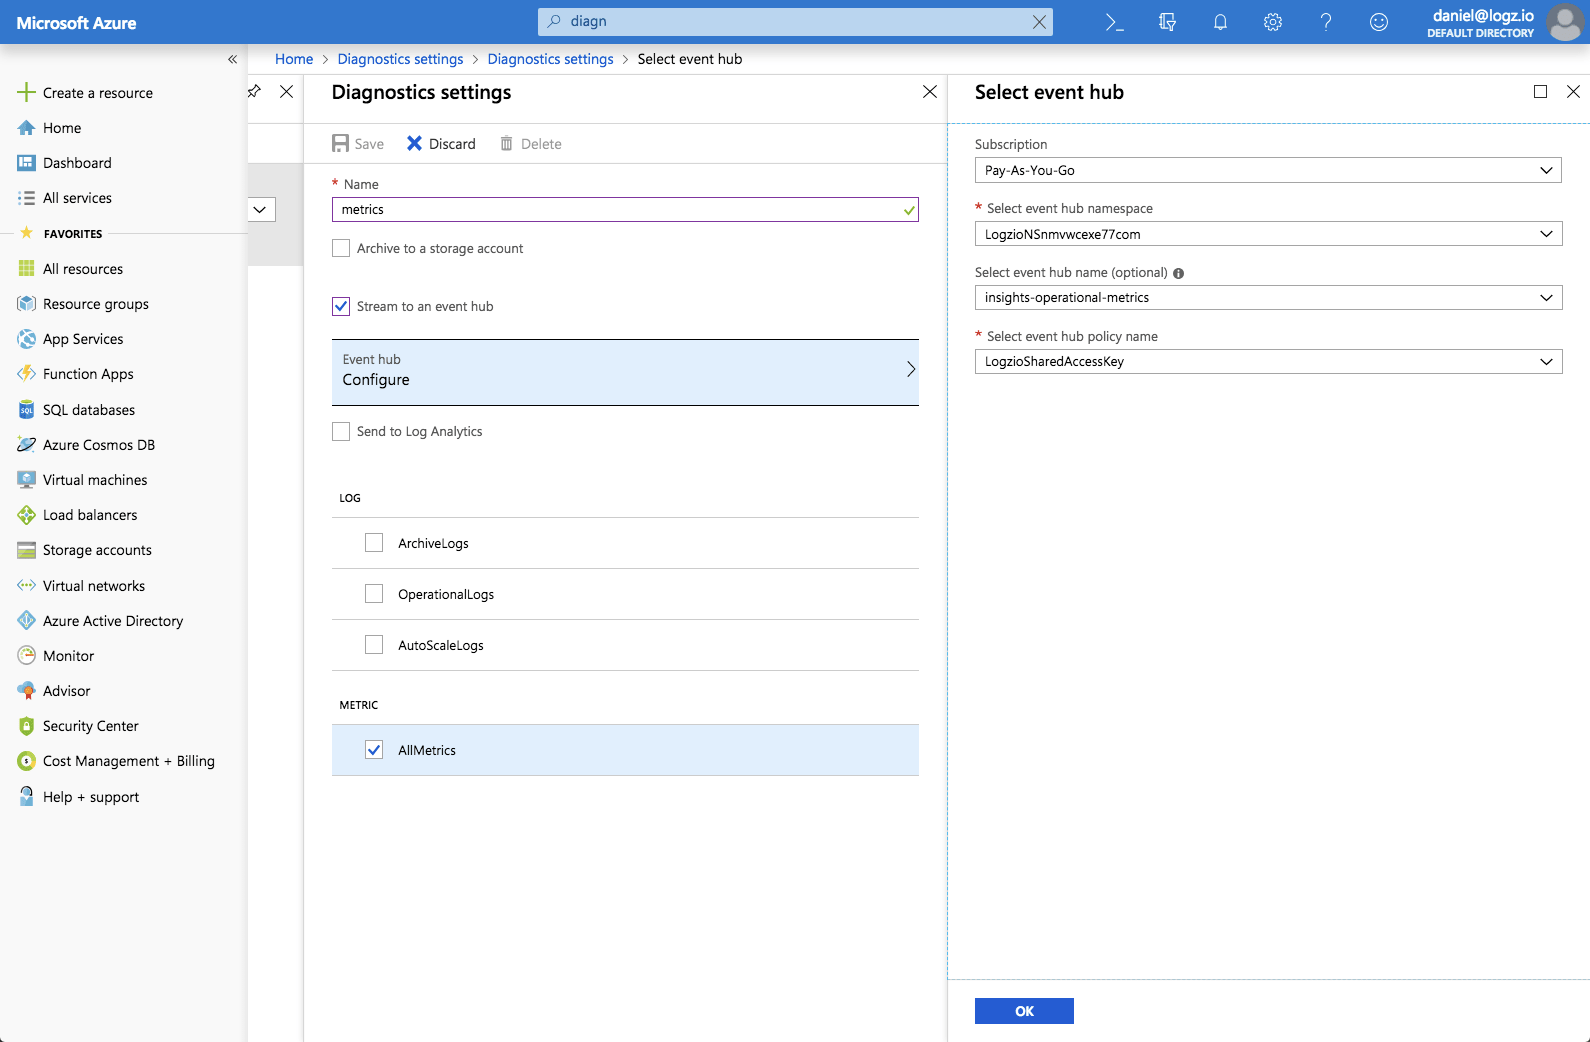
In this case, I’m going to send diagnostic logs from a network security group.
To do this, select the Network security group you wish to ship diagnostic logs from, and click Diagnostic Settings.
Enter a name for the settings, select Stream to an event hub and then click Configure to configure the event hub settings.
Select the event hub namespace, event hub (insights-operational-logs), and the event hub policy name that the deployment template created.
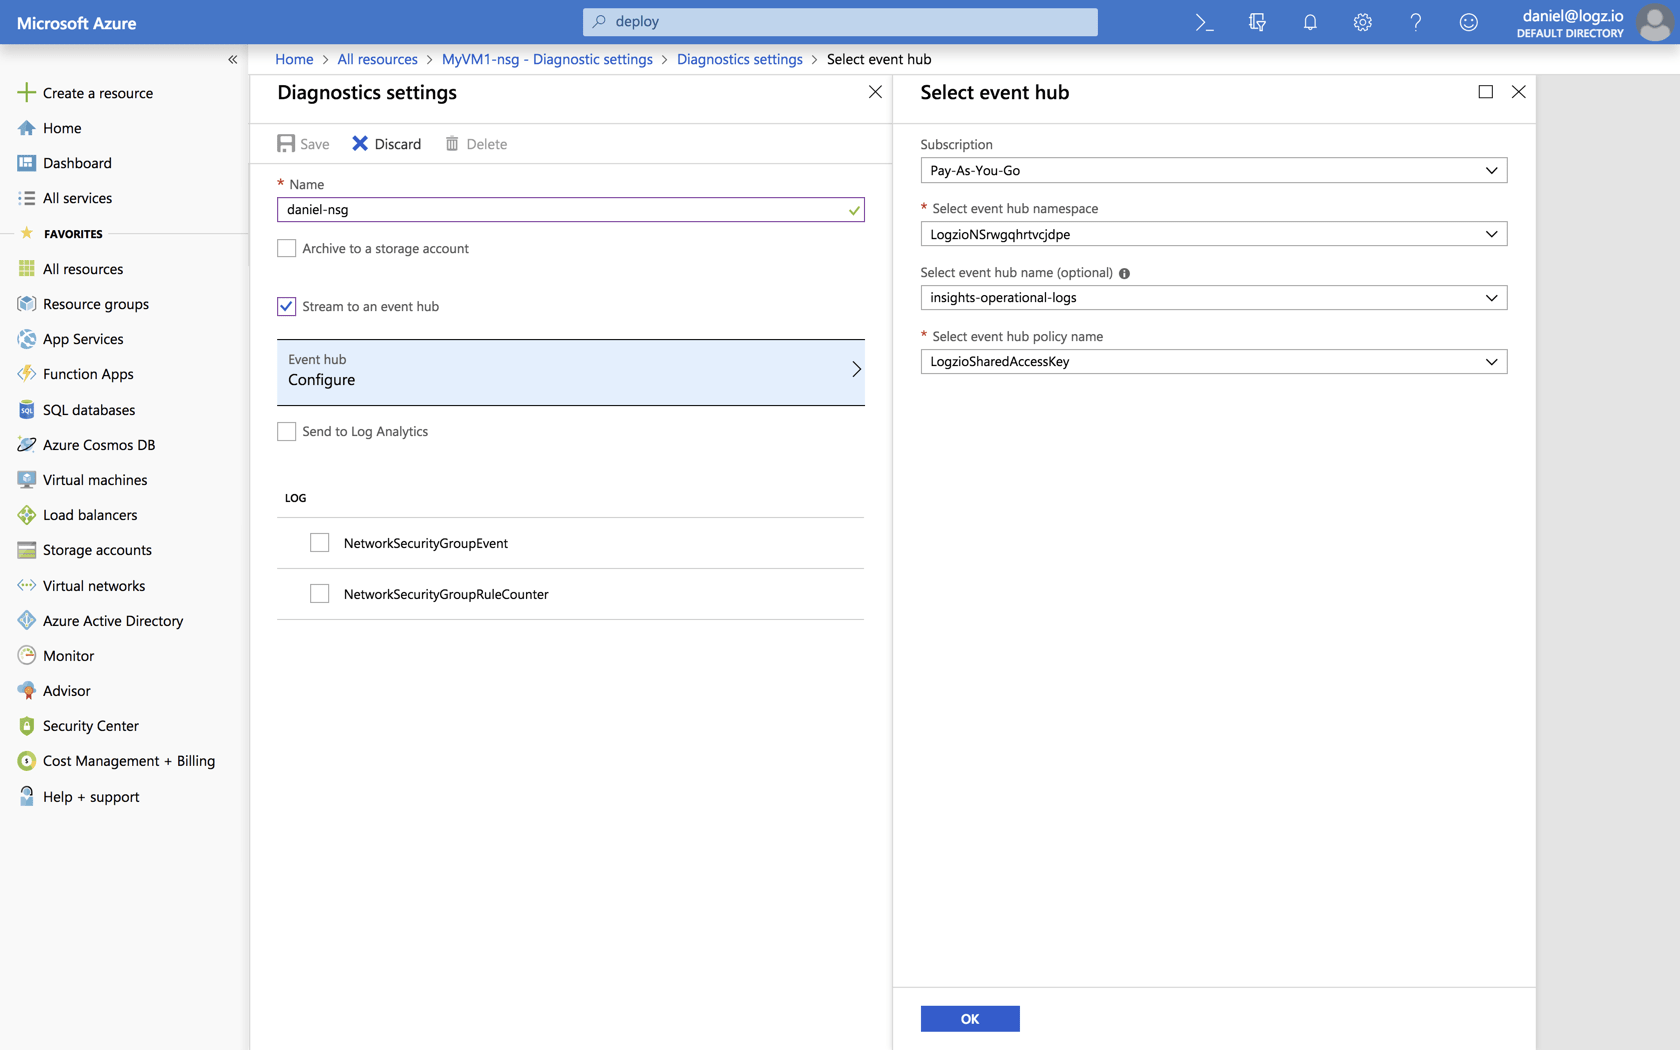
Click OK, and under the log section, select the log data you want to ship.
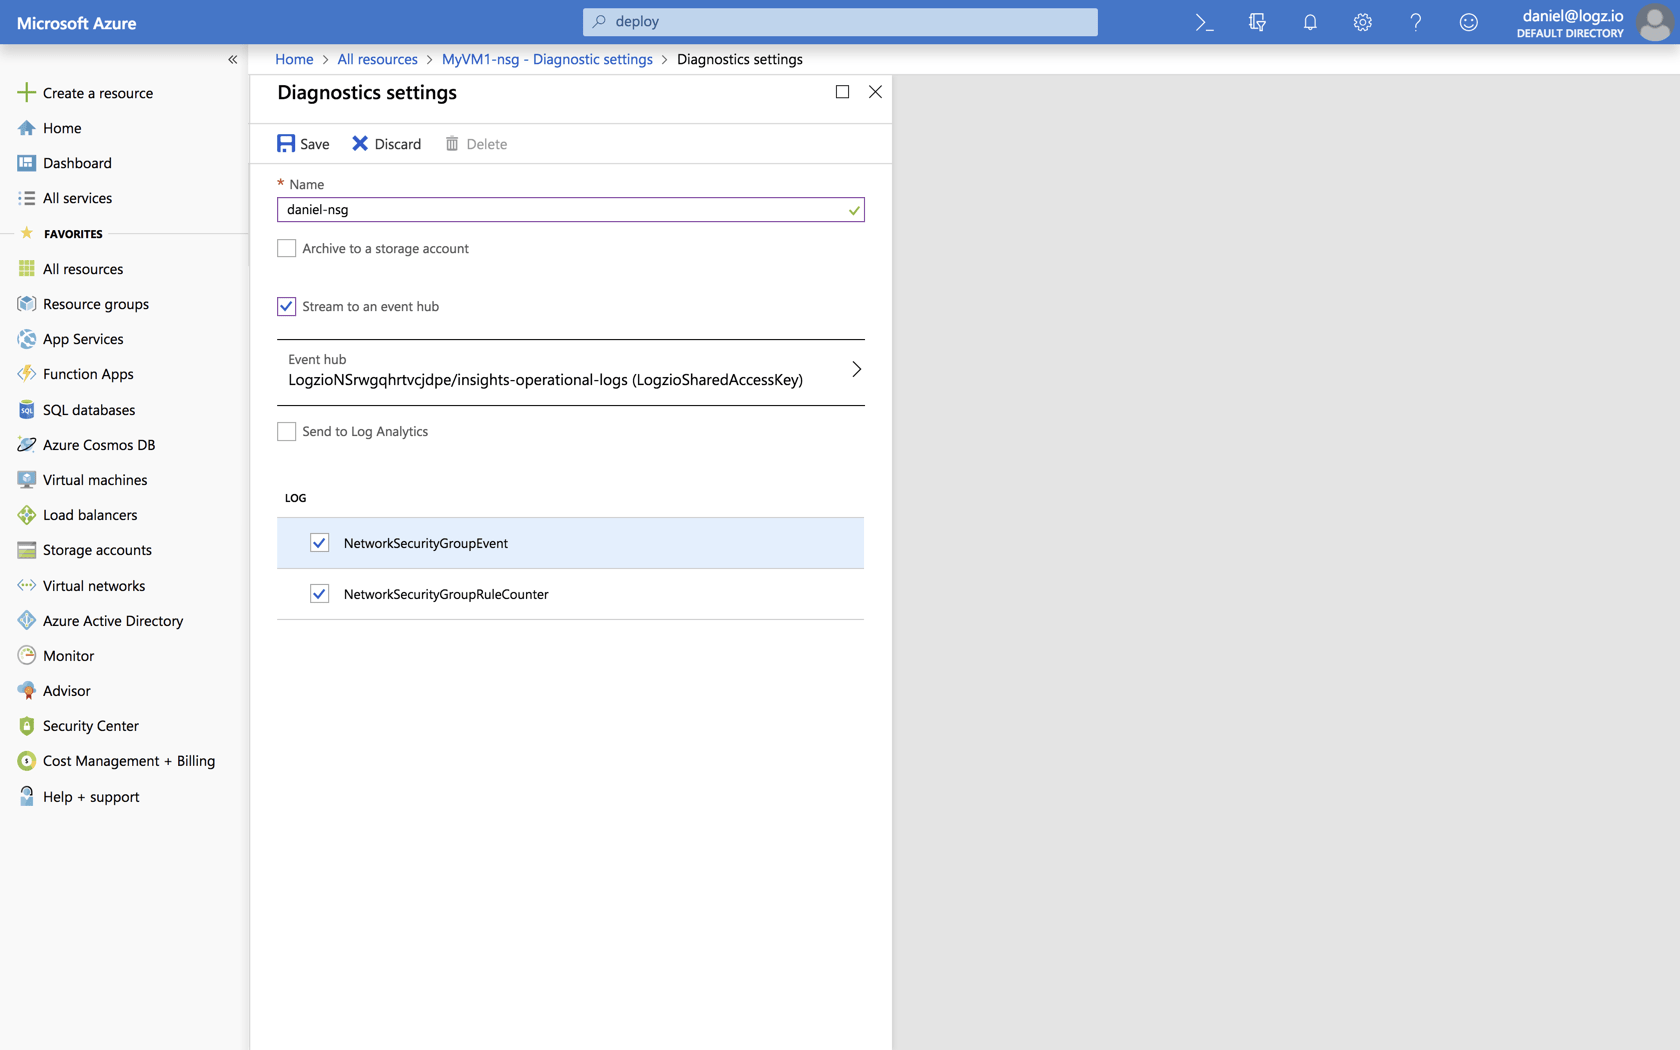
Save the settings.
That’s it! Azure will apply the diagnostics settings and within a minute or two you will be able to see logs from your network security group in Logz.io.
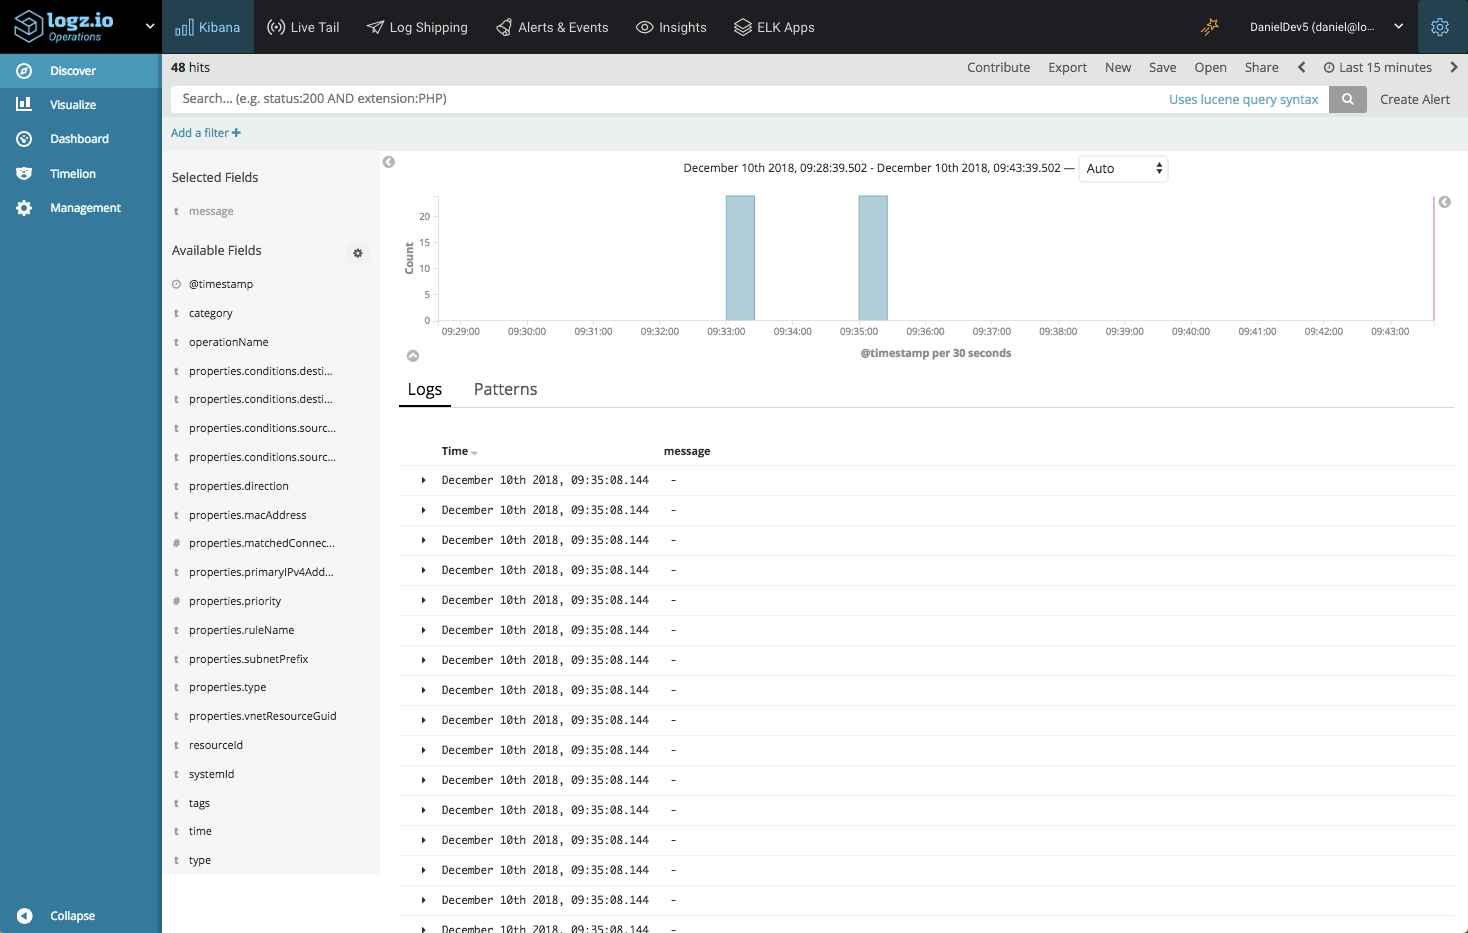
Here’s an example of a Network security group log that was sent via Event Hub to Logz.io:
{
  "_index": "logzioCustomerIndex181209_v2",
  "_type": "eventHub",
  "_id": "AWeTclps0WPxxRnwRzbW.account-12986",
  "_version": 1,
  "_score": null,
  "_source": {
    "systemId": "ce08c286-34c2-4cf0-bc58-15dba8050d8b",
    "resourceId": "/SUBSCRIPTIONS/94C308F7-EBDA-49F9-AF60-AF0AC344CA4D/RESOURCEGROUPS/DANIEL-DEMO/PROVIDERS/MICROSOFT.NETWORK/NETWORKSECURITYGROUPS/DANIEL-DEMO-VM-NSG",
    "operationName": "NetworkSecurityGroupCounters",
    "type": "eventHub",
    "tags": [
      "_logz_http_bulk_json_8070"
    ],
    "@timestamp": "2018-12-09T14:50:03.987Z",
    "time": "2018-12-09T14:35:45.74Z",
    "category": "NetworkSecurityGroupRuleCounter",
    "properties": {
      "vnetResourceGuid": "{085251DC-33E5-4814-A806-2C29FBF09B0A}",
      "subnetPrefix": "10.0.0.0/24",
      "macAddress": "00-0D-3A-3B-B4-D4",
      "primaryIPv4Address": "10.0.0.4",
      "ruleName": "DefaultRule_DenyAllOutBound",
      "direction": "Out",
      "type": "block",
      "matchedConnections": 0
    }
  },
  "fields": {
    "@timestamp": [
      1544367003987
    ]
  },
  "sort": [
    1544367003987
  ]
To ship Azure metrics to Logz.io, simply repeat the same process. This time, however, be sure to select the metrics Events Hub created as part of the deployment template (insights-operational-metrics).
This ensures the metrics are parsed correctly by the correct Azure function and streamed to the Logz.io account you defined for storing metrics when you deployed the template.
Analyzing and Visualizing the Data
Logz.io provides various tools for using the collected data for monitoring and troubleshooting.
To search for specific events, you can use the search box at the top of the Discover page to enter different types of queries.
For our Network Security Group example, we can use the following query to search for blocked traffic:
type:eventHub AND properties.type:block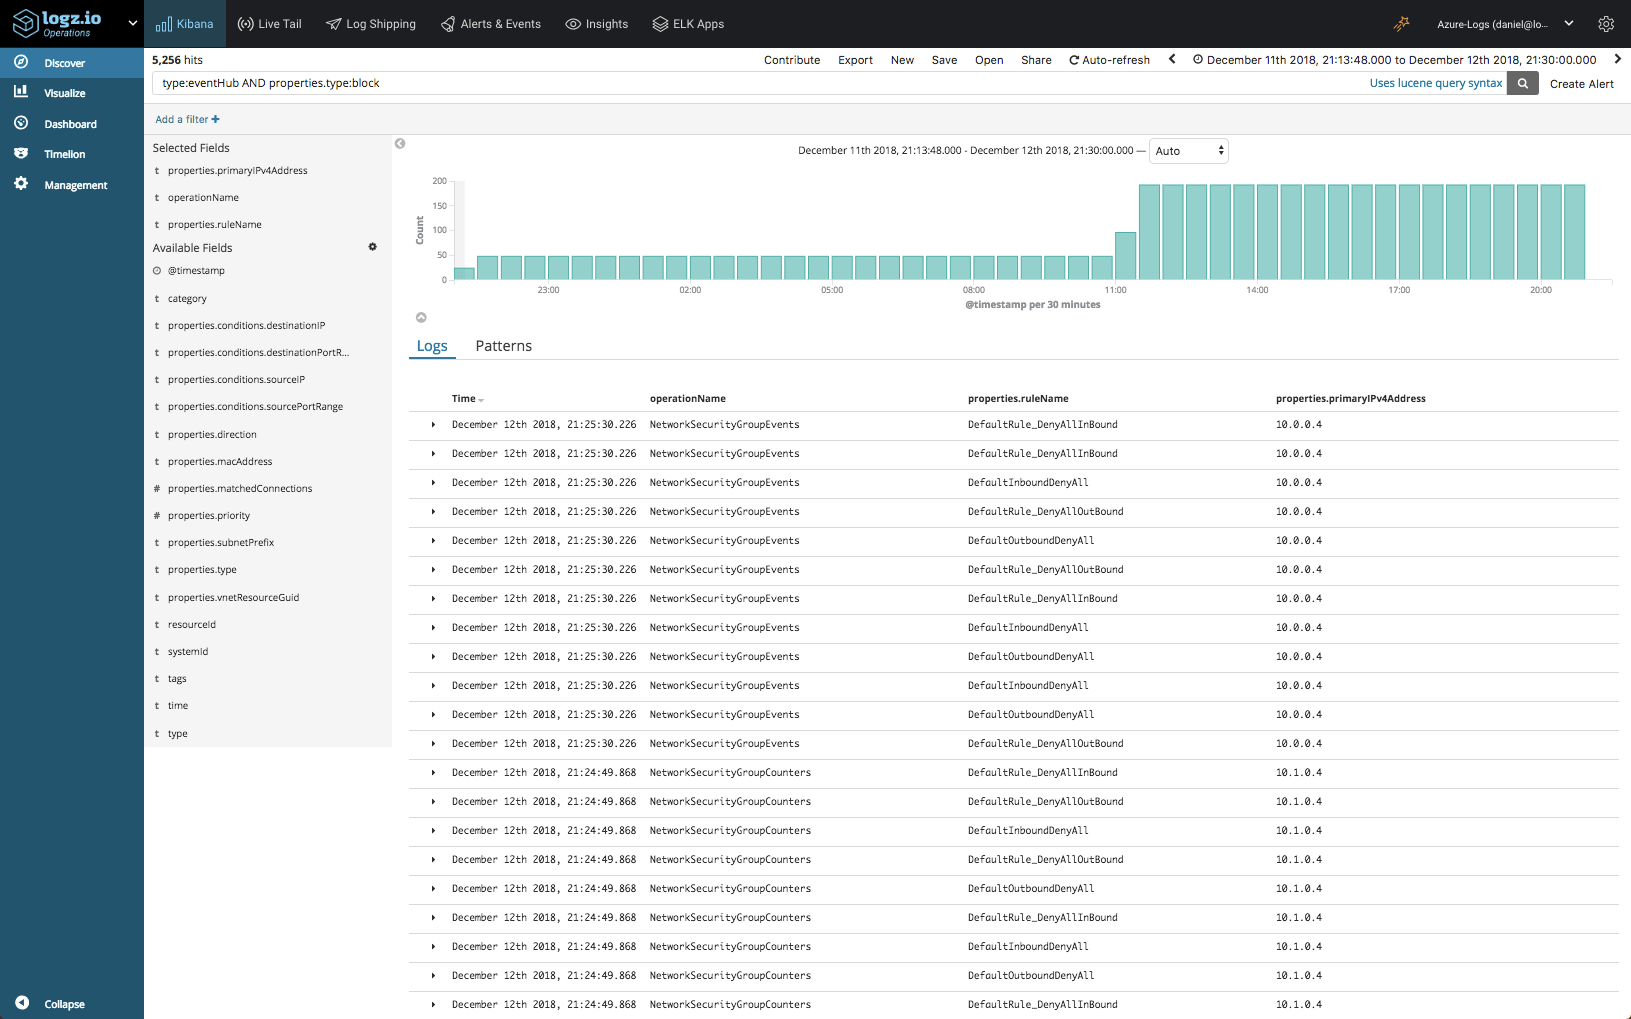
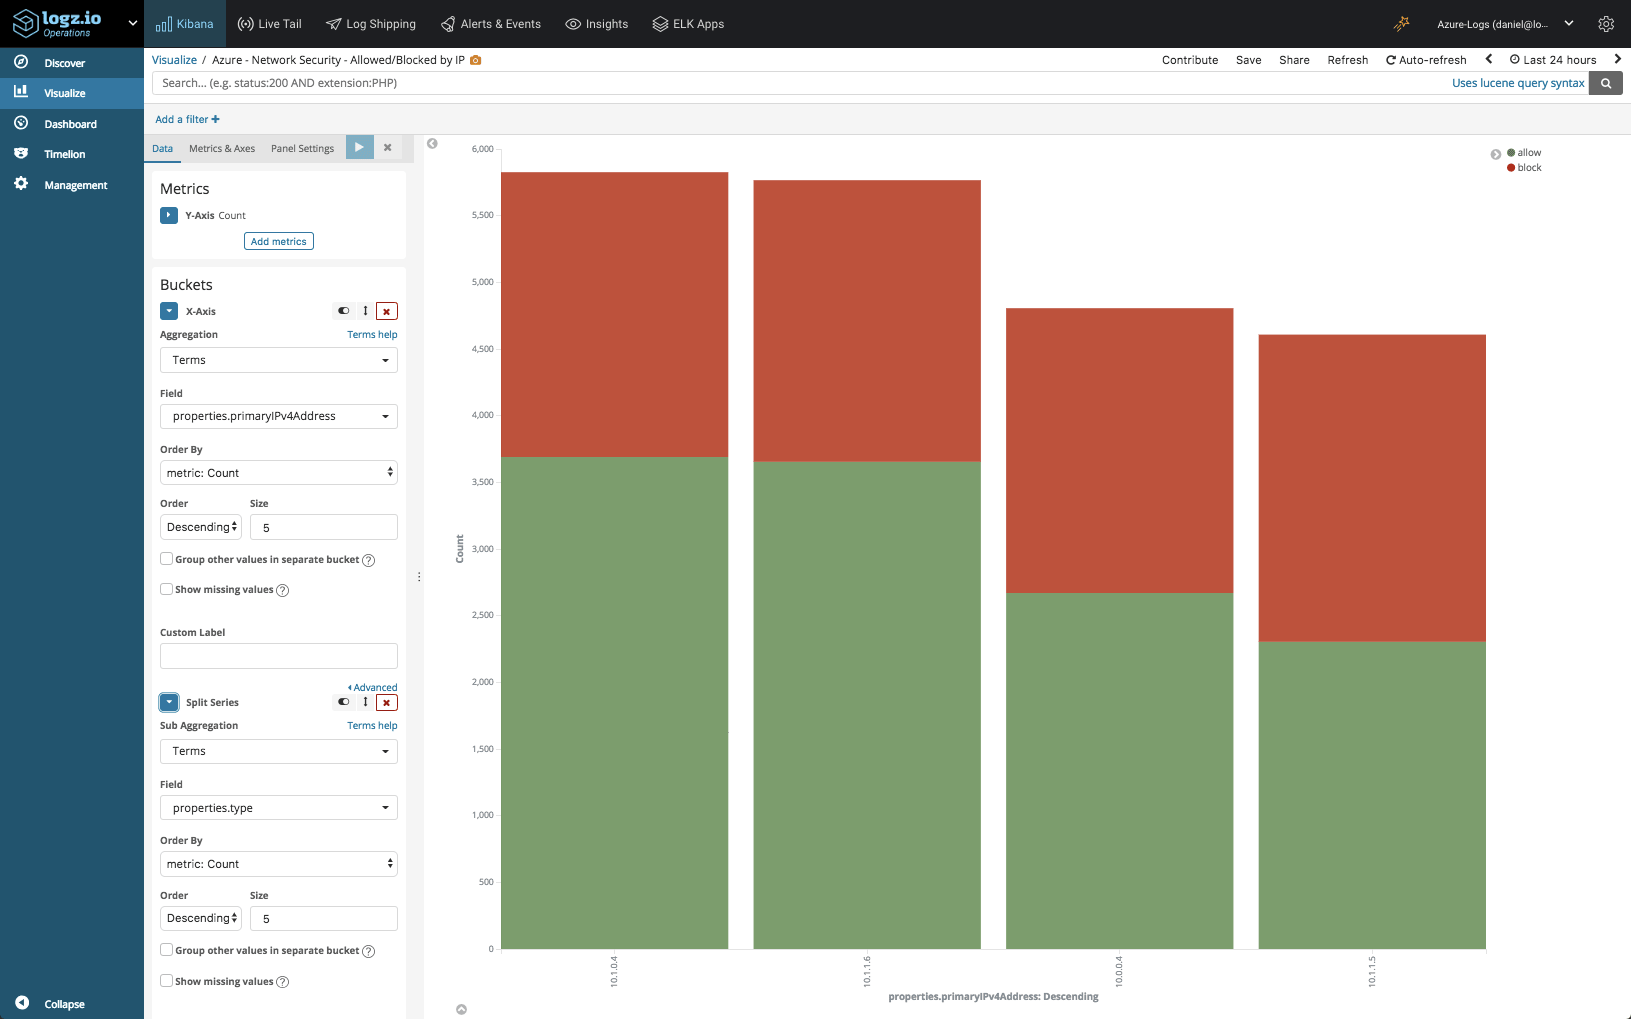
Or, you can build Kibana visualizations for monitoring different data points. In the case of Network Security Groups, we could, for example, build a visualization that provides a breakdown of allowed versus blocked traffic, per IP:
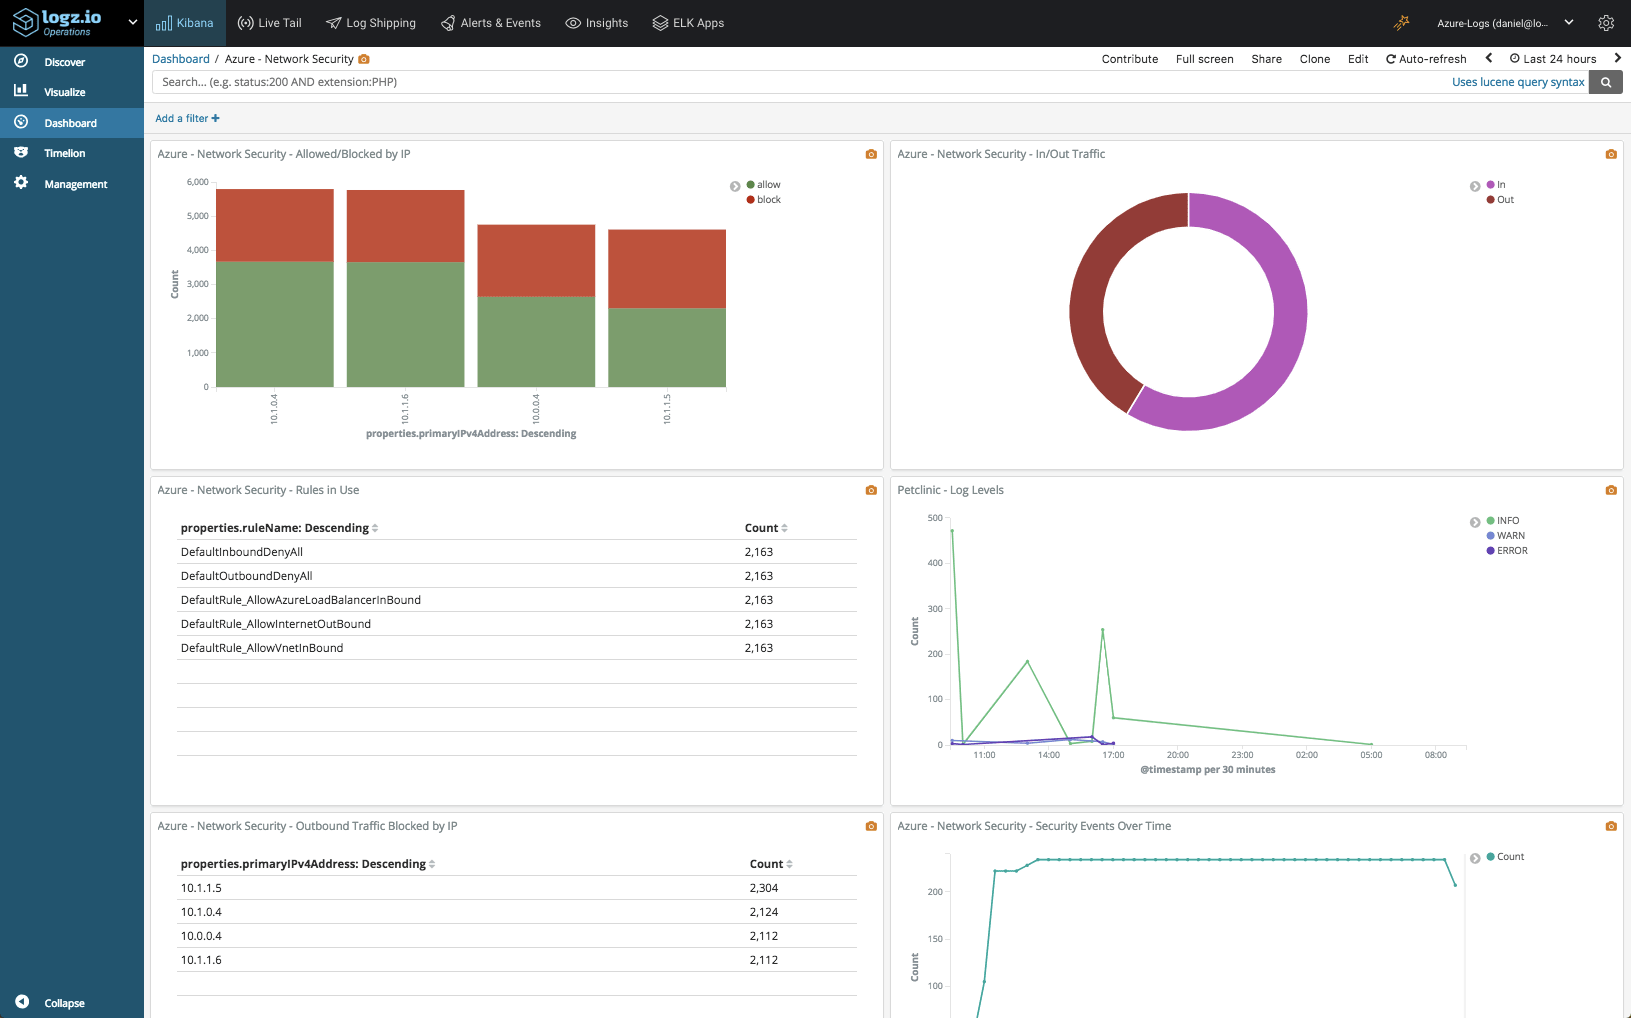
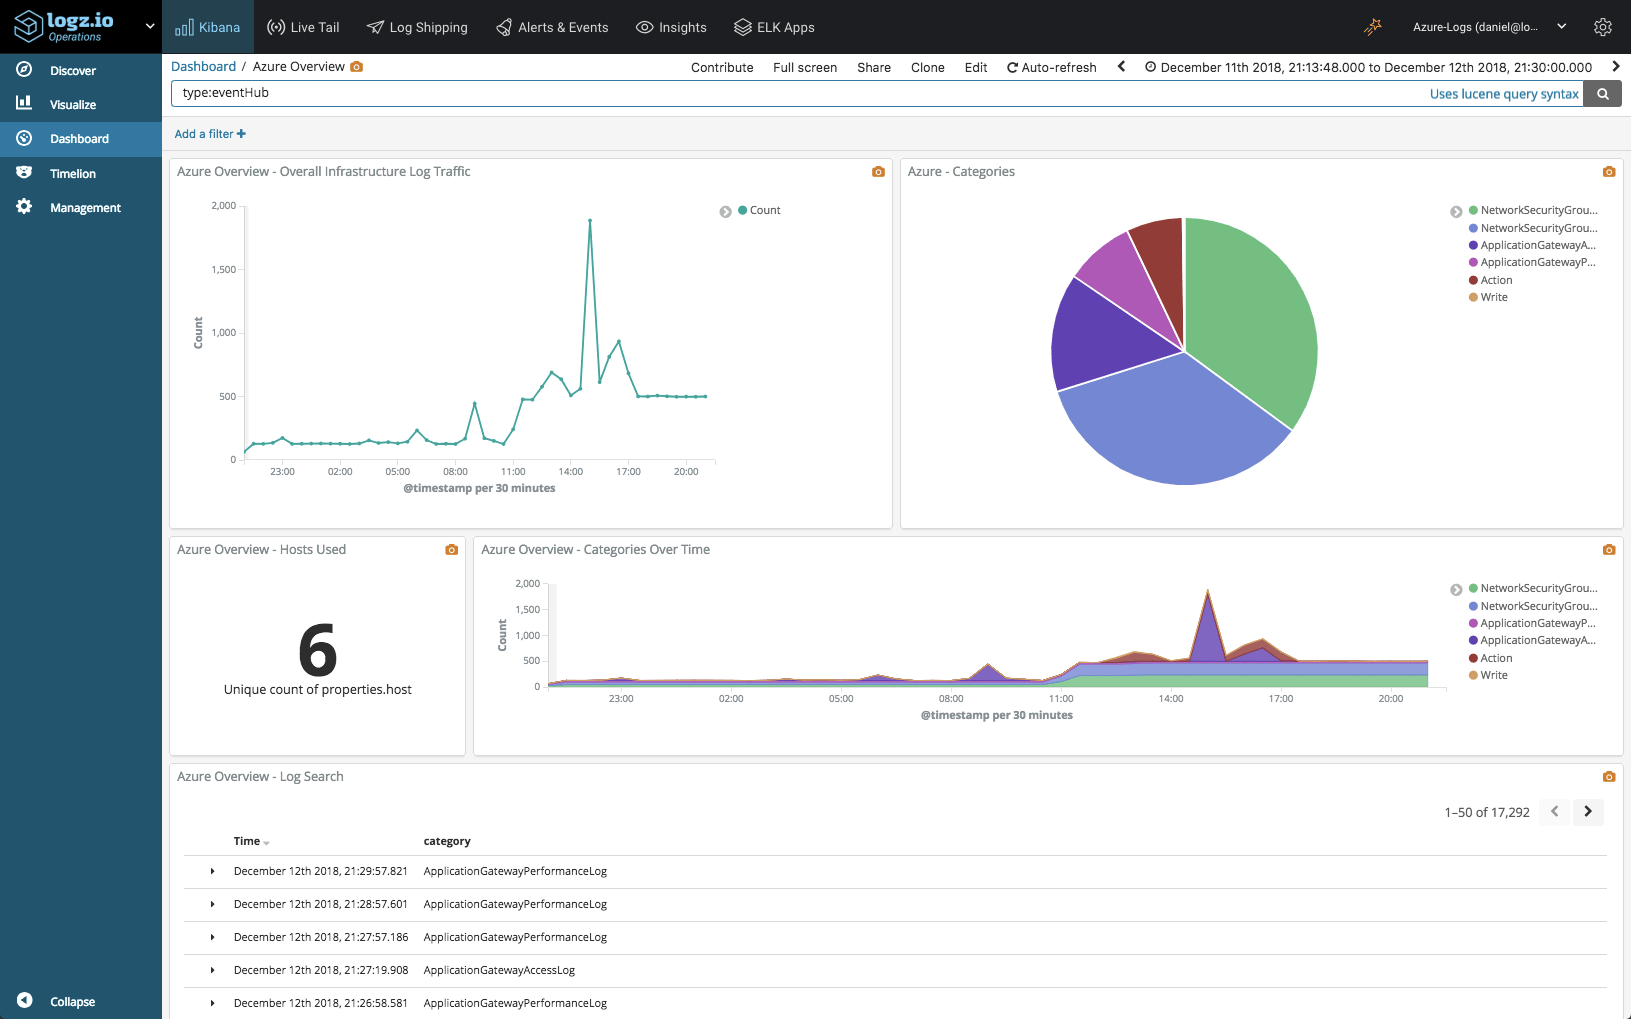
Kibana allows you to slice and dice your data in any way you want, and once you’ve lined up all your visualizations you can build a dashboard to gain a more comprehensive view:
Proactive Monitoring With Alerts
Logz.io provides a powerful alerting mechanism that allows users to be more proactive when monitoring their Azure environment. Based on a query, you can define what event to be alerted on and how.
Based on the query provided above for blocked traffic, clicking the Create alert button on the top-right corner of the Discover page opens up the Create a New Alert page:
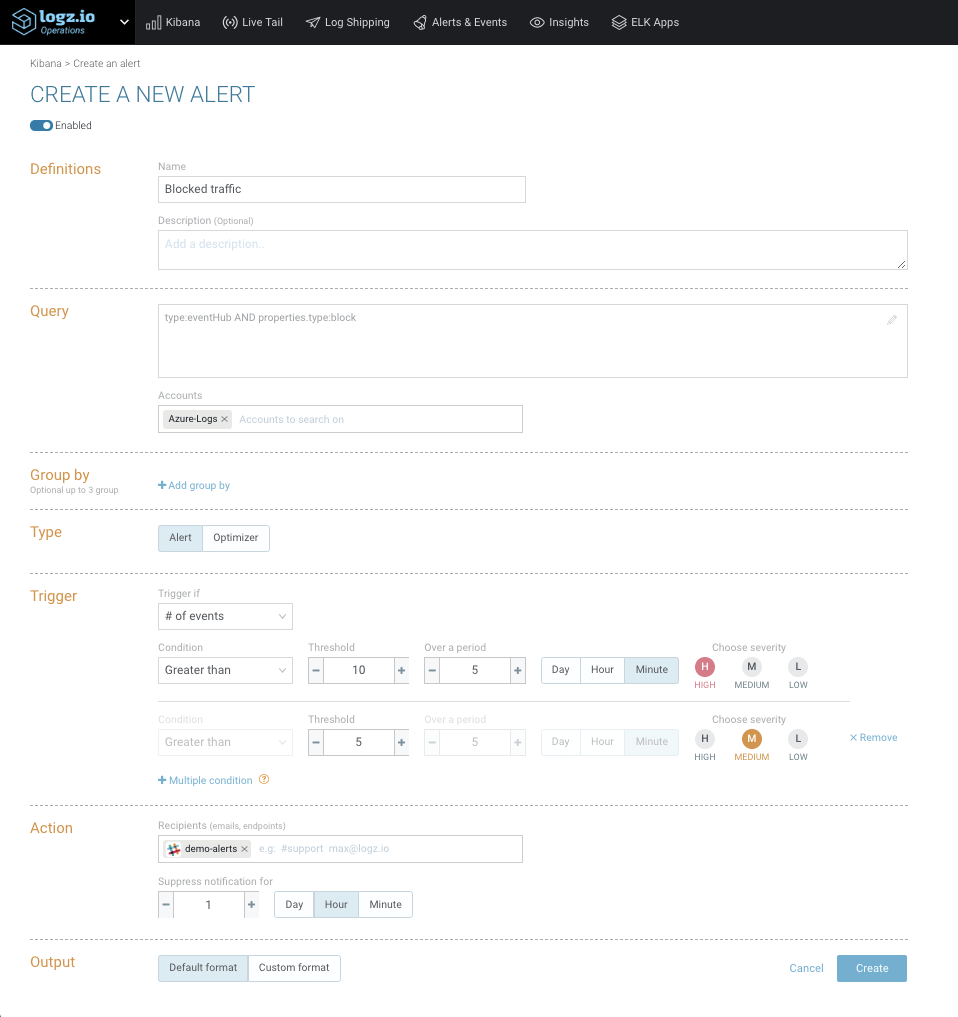
Here I can define the alert conditions – the exact threshold for triggering the alert, severity levels, who to notify and in what format. You can notify teammates via email, Slack, PagerDuty, and more.
Gaining a Comprehensive View of Azure
Azure generates diagnostic logs and metrics for a variety of resources, providing users with extremely useful data for monitoring and troubleshooting an Azure environment.
We described collecting and analyzing Network Security Group diagnostic logs. For other Azure resources, simply repeat the process above for each resource you have deployed, whether it’s an SQL server, an application gateway, a network security group, and so forth (a list of the resources diagnostics data is available for can be found here). You can use the same Azure function and Event Hub for streaming the data into Logz.io.
Azure also generates what are called Activity Logs — for monitoring who did what and when for any resources in a specific Azure subscription. Using the integration described here, this data can also be shipped into Logz.io for analysis (we’ll cover this use case in the next article on Azure monitoring).
Grabbing both these types of Azure logs, you’ll be able to gain a complete view of your Azure deployment.
Endnotes
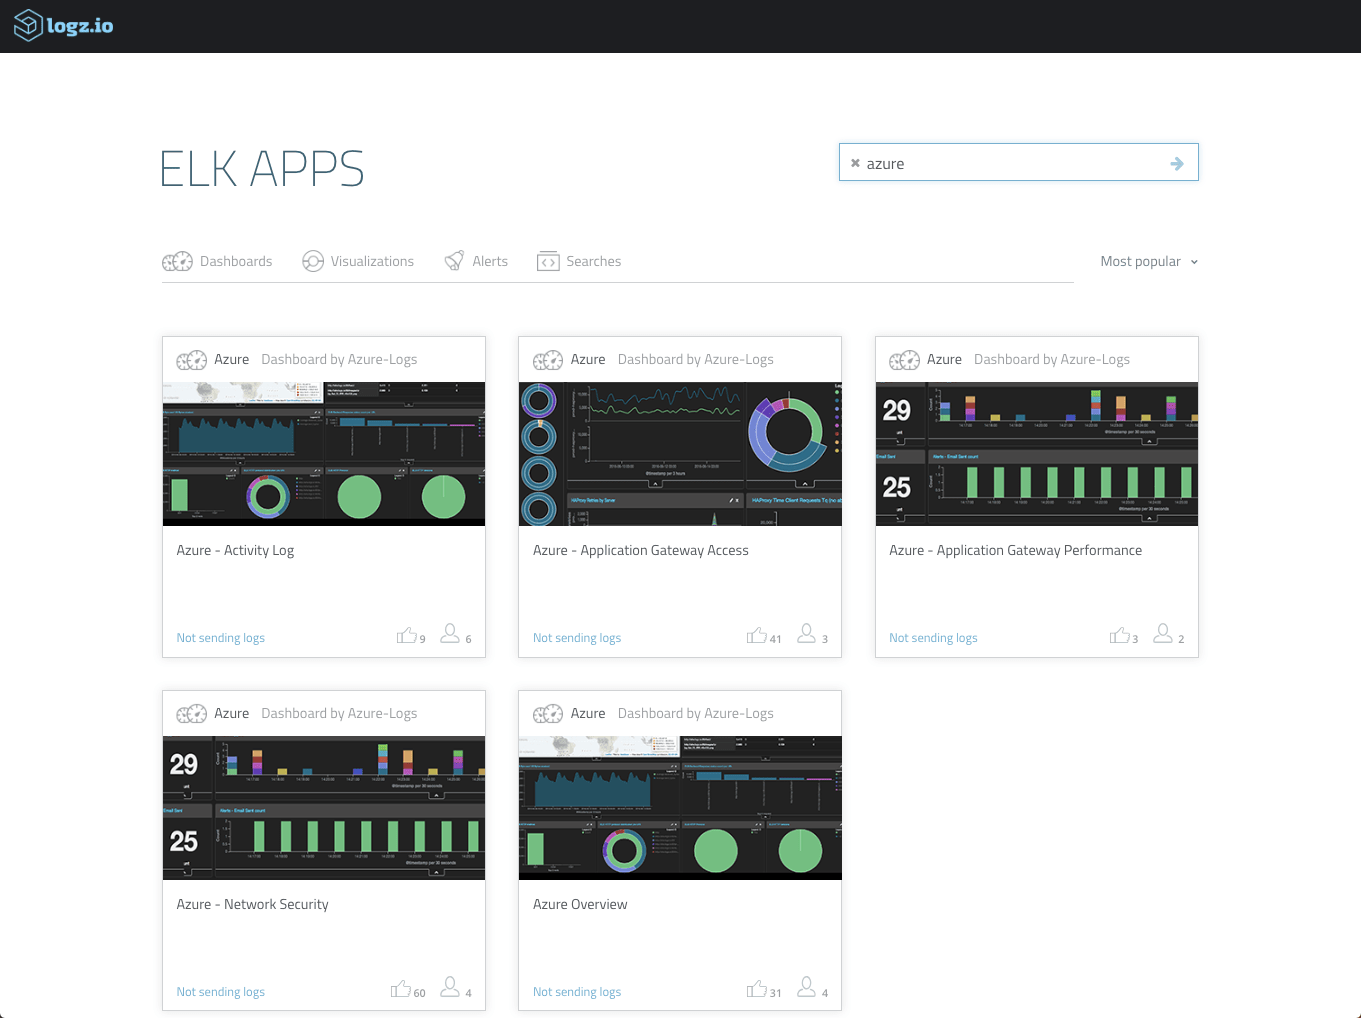
The dashboards shown above are available in ELK Apps — our library of premade dashboards and visualizations for various platforms and environments, including now Azure as well. These dashboards can be easily deployed with one click to save you the bother of starting from scratch.
We’re working on some new integrations with Azure that will make it even easier to collect, stream and analyze data in Logz.io, so stay tuned.
The combination of Azure and Logz.io gives users the opportunity to enjoy the best of both worlds — scalable and reliable cloud computing resources together with advanced machine data analytics to be able to monitor them.
Published at DZone with permission of Daniel Berman. See the original article here.
Opinions expressed by DZone contributors are their own.
Comments