How to Move IBM App Connect Enterprise to Containers: Part 2(b)
Deploy a simple flow onto Red Hat OpenShift using the App Connect Dashboard.
Join the DZone community and get the full member experience.
Join For FreeScenario 2b: Deploy a Simple Flow Onto Red Hat OpenShift Using the App Connect Dashboard
In Scenario 2a we introduced the App Connect 'operator'. This works as a sort of digital assistant to help us look after App Connect containers. In that scenario, we used the operator to deploy a container via the Kubernetes command line. In this scenario, we're going to do exactly the same deployment but instead through a user interface known as the App Connect Dashboard.
What is the App Connect Dashboard?
The App Connect Dashboard is a user interface that provides a simplified way to deploy BAR files within App Connect containers and administer them once live. Some of the facilities it provides are:
- A guided step-by-step user interface through which to deploy a BAR file in a container.
- An internal content server on which to host your BAR files ready for deployment.
- A simplified way to create and view the YAML file required by the App Connect operator, including the creation and referencing of any 'configurations' required.
- A view of the integration servers deployed in containers, which enables you to drill down to the individual message flows within them.
- The ability to not just create integration servers as we will in this scenario, but also to update them (change number of replicas, change to a different fixpack or BAR file, update configuration objects, etc.) and delete them too. These are not of course unique to the dashboard, as they could be done from the command line too.
Note that we described both 'operators' and 'configurations' in Scenario 2a should you need to go back and refresh your understanding of them.
Clearly, the dashboard provides some powerful convenience features, but it does require some additional installation steps, configuration, and slightly increases the footprint on your installation. This is why we have made it optional, since some will prefer to use just the command line option.
Creating the App Connect Dashboard Instance
The Dashboard code is actually part of the operator that we installed in Scenario 2a, so if you have not done that yet, install the App Connect Operator.
To keep the footprint light, the operator does not automatically install an instance of the App Connect Dashboard, so you'll need to do that next.
Before you create the App Connect Dashboard instance, you must decide what type of storage to use for uploaded or imported BAR files.
The following storage types can be used to allocate storage for the ACE Dashboard content server.
- Ephemeral storage — the files are stored on the dashboard's internal file system. Simple configuration, but any loaded BAR files will be deleted if the dashboard instance is restarted.
- Long-term storage — the dashboard can be configured to use a persistent volume provisioned for the container or a Simple Storage Service (S3) storage system. This ensures the files remain on dashboard restart but requires more configuration.
For our simple scenario, an ephemeral storage type will work just fine and will be the quickest/simplest to install. However, note that if you want to change to a different storage type later, you will need to re-install the dashboard.
You can create an App Connect Dashboard instance from the IBM Cloud Pak for Integration Platform Navigator, the Red Hat OpenShift web console or CLI, or the CLI for a Kubernetes environment. The steps to create an instance of the dashboard and information on each of the storage types are here.
Launching the App Connect Dashboard
You can launch the dashboard user interface from the OpenShift console, or from the IBM Automation Hub (previously known as Platform Navigator) if you have installed IBM Cloud Pak for Integration.
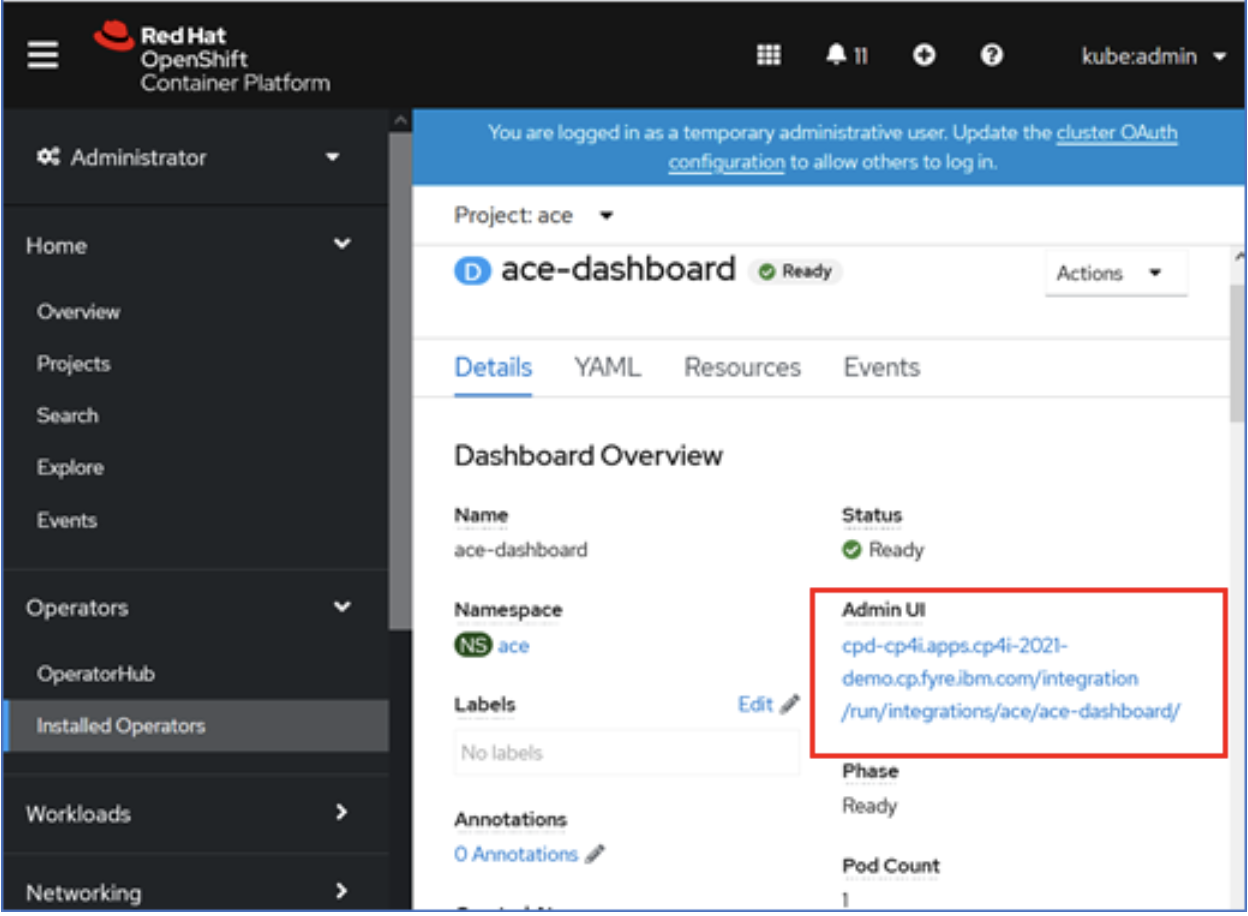
- Launching from the OpenShift Console. You can find the URL for the App Connect Dashboard user interface from the OpenShift console as highlighted in the image below.
![Launching App Connect Dashboard From OpenShift Console]()
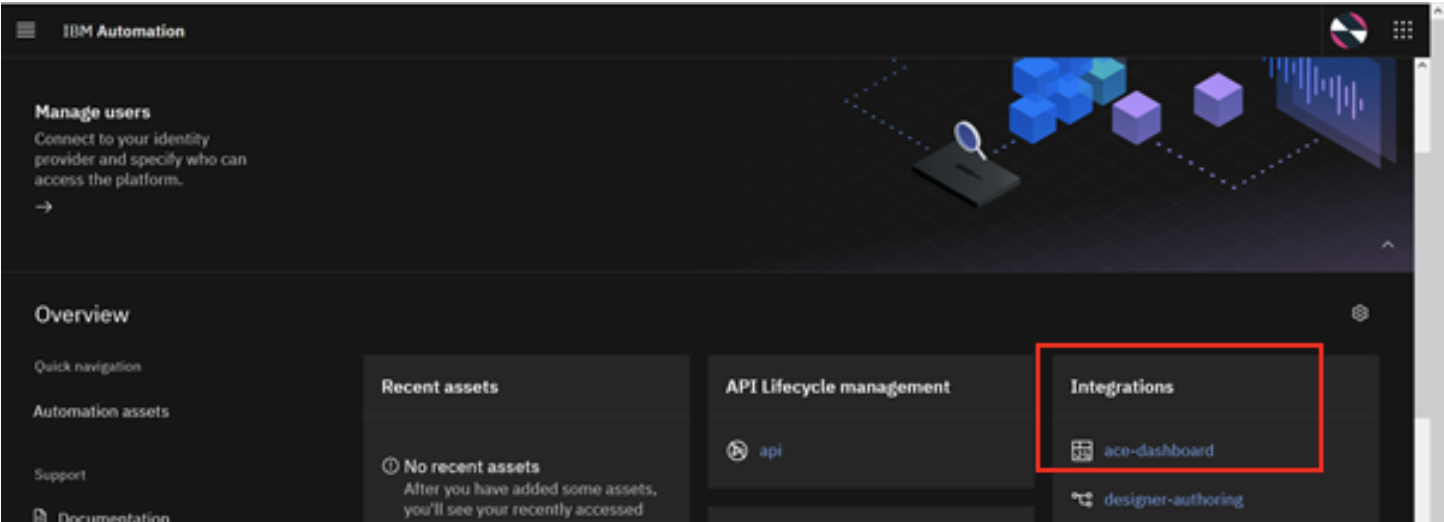
- Launching the dashboard from the IBM Automation Hub. The ACE Dashboard instance is listed under the Integrations panel in the IBM Automation Hub as highlighted below. Click on the dashboard instance name to launch the user interface.
![Launching App Connect Dashboard From IBM Automation Hub]()
Exploring the App Connect Dashboard
The dashboard home page (shown below) has different tiles that tell you how many integration applications are currently deployed, how many integration servers are running, as well as a tile to create a new integration server.
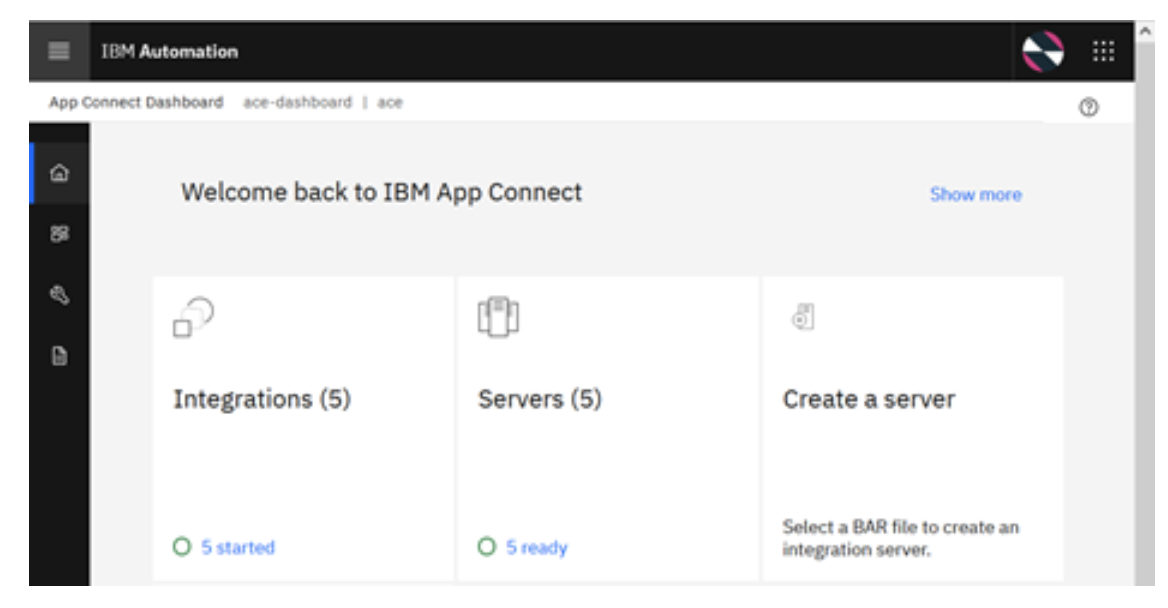
Note that if you did Scenario 2a, then you should be able to see the integration server you deployed previously using the CLI. This is because we set createDashboardUsers: true in the integration server definition file.
Deploying a BAR File Using the App Connect Dashboard
Finally, we are ready to begin our deployment of the simple flow.
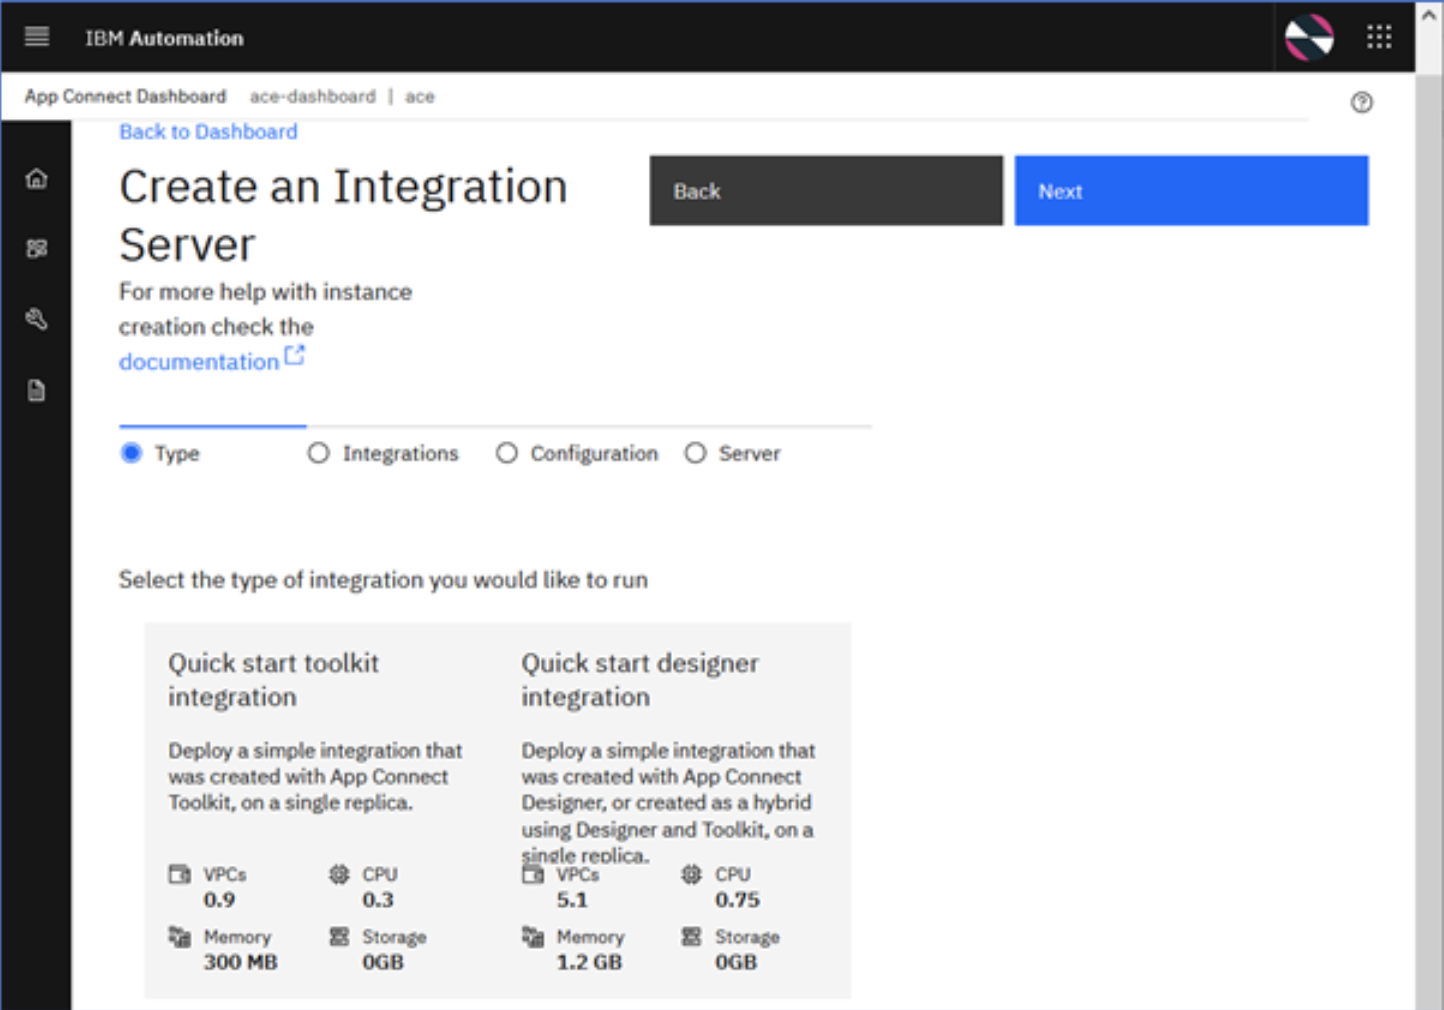
- From the App Connect Dashboard, start the integration server deployment by clicking create a server from the Home page, or from the Servers or Integrations page (accessed by clicking Dashboard in the navigation pane).
- Select the Quick Start toolkit integration option as we will be deploying a BAR file that contains a message flow developed using the App Connect Toolkit.
![Selecting Quick Start Toolkit Integration]() Click 'Next' which takes you to the next screen where you can input the BAR file.
Click 'Next' which takes you to the next screen where you can input the BAR file. - In the Integrations panel, upload the exported BAR file to the dashboard's internal content server.
![Uploading Exported BAR File to Dashboard's Internal Content Server]()
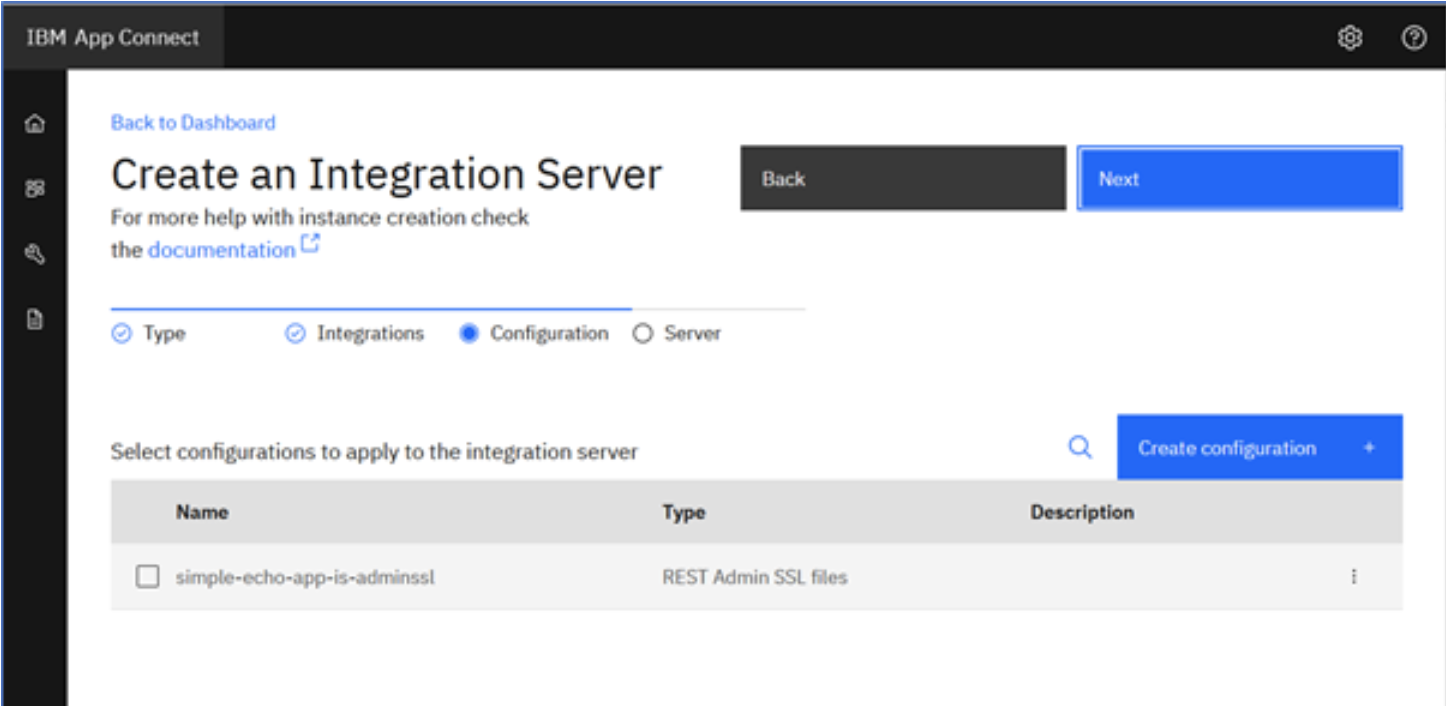
- After uploading the BAR file, click 'Next' which takes you to the next page where you can define dynamic configurations that you would like to apply to your integration server.
![Dynamic Configurations For Integration Server]()
In Scenario 2a, we required a configuration object because the App Connect container required the credentials to connect to an external Git Hub repository. In this scenario, the container will be drawing from the dashboard's internal content repository, so no configuration for that is required. Furthermore, our current simple demo does not require configuration objects to connect to any resources at runtime either. Therefore, we can skip this stage and go to the next and final step of deploying the integration server. - Click 'Next' and it will take you to the Integration Server resource definition page where you can provide metadata for your Integration Server.
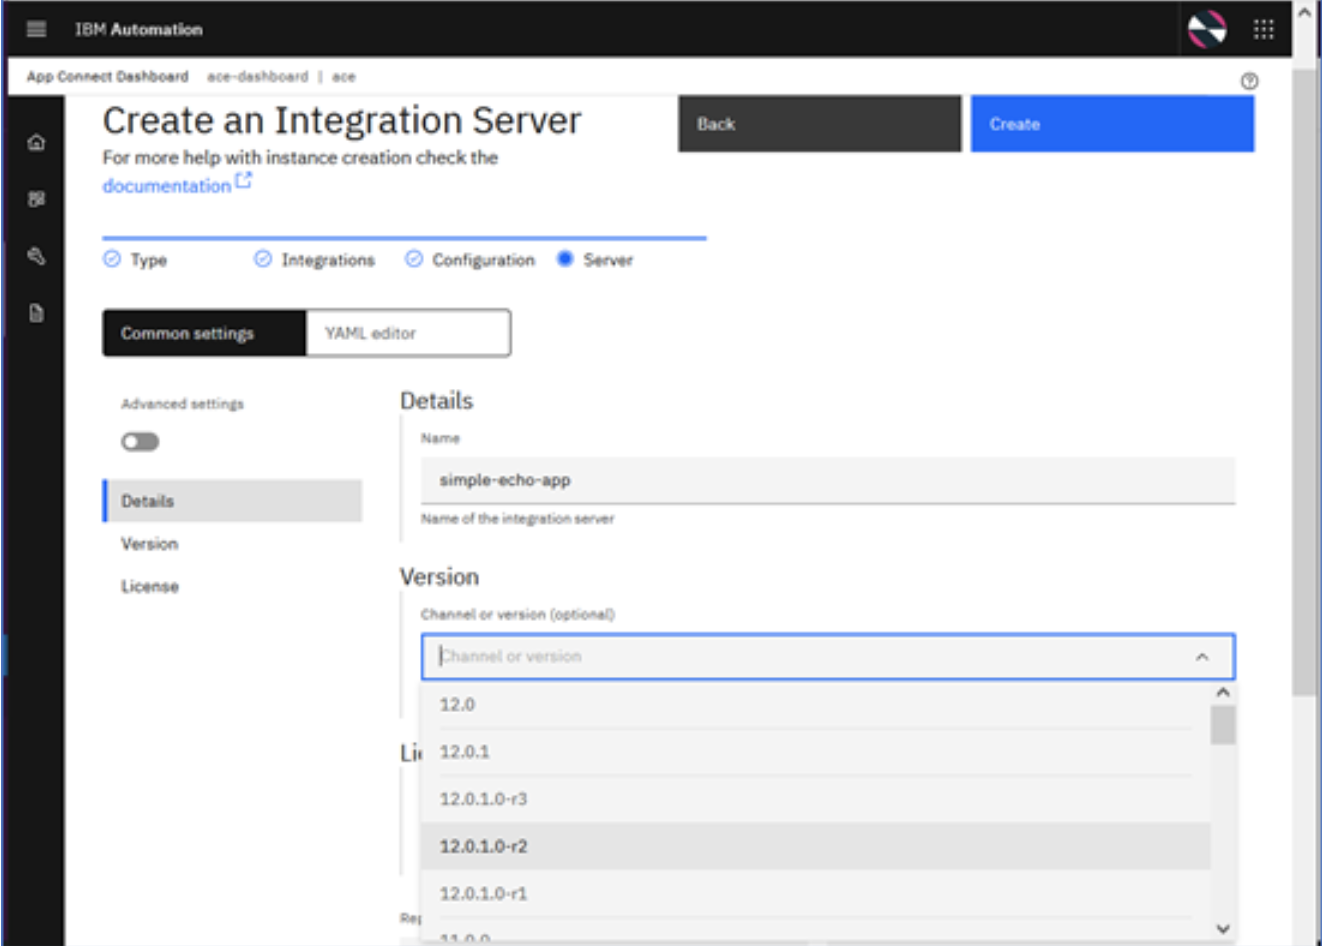
![Integration Server Resource Definition Page]()
- For our simple demonstration purpose, we define the following values and leave the rest of the fields to their default values.
- Name of Integration Server: simple-echo-app.
- Version of ACE fixpack:12. 0.1.0-r3 (note that you can choose a specific version, or choose a 'channel' like 12.0.1, which will ensure the latest fixpack of 12.0.1 is used for the deployment).
- Accept the License with the appropriate value from the drop-down list.
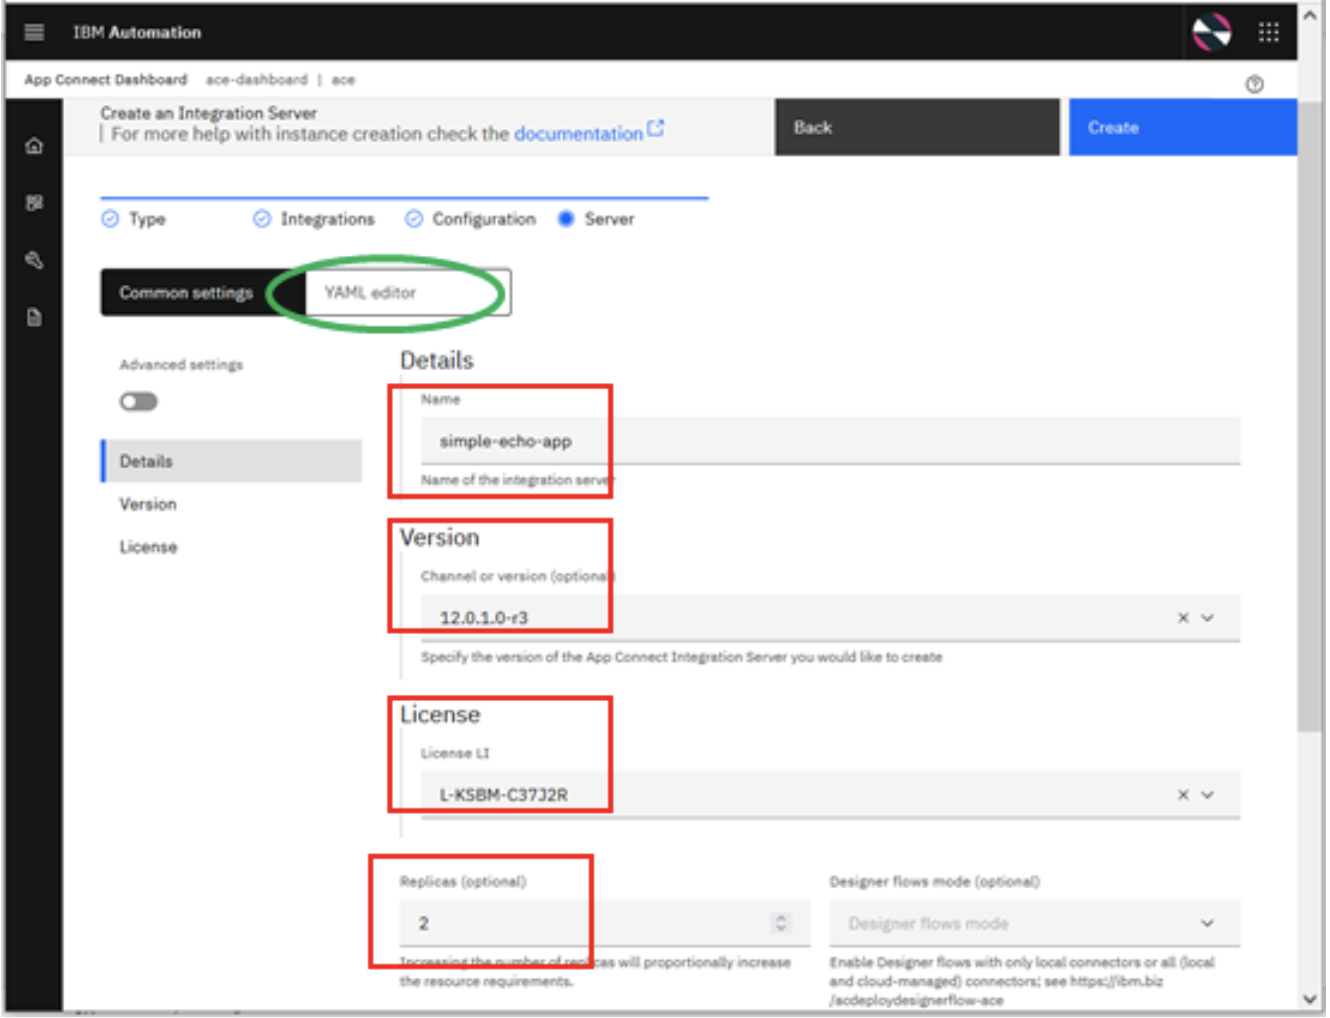
- Number of Replicas: 2 (default value is 1. Set it to >1 for High Availability).
![Defining Resource Values For Integration Server]()
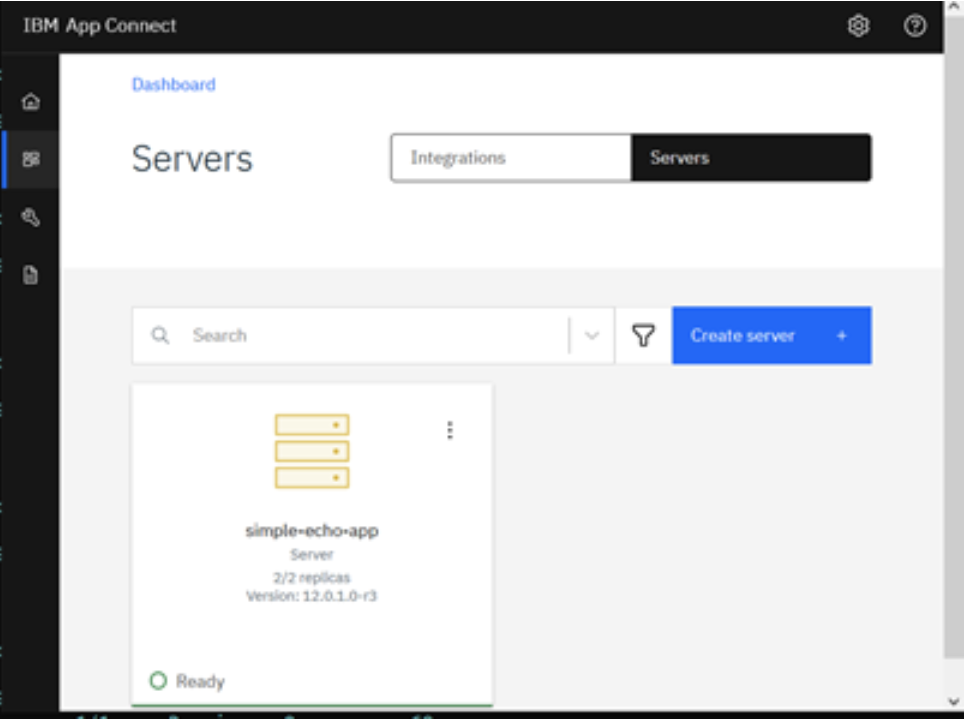
- These values are used to create the YAML definition file just like the one we created by hand in Scenario 2a. Indeed you can see and even edit the generated YAML file, by clicking on the YAML editor tab. This is the exact same YAML that can be used for deploying the integration server via the command line or use in scripts for deployments using the CI/CD pipeline, but a much easier way of creating it if you're not familiar with the core contents. When the deployment completes, the integration server is displayed as a tile on the Servers page, and the deployed integration can be viewed from the Integrations page or by clicking the integration server tile.
![Integration Server View]()
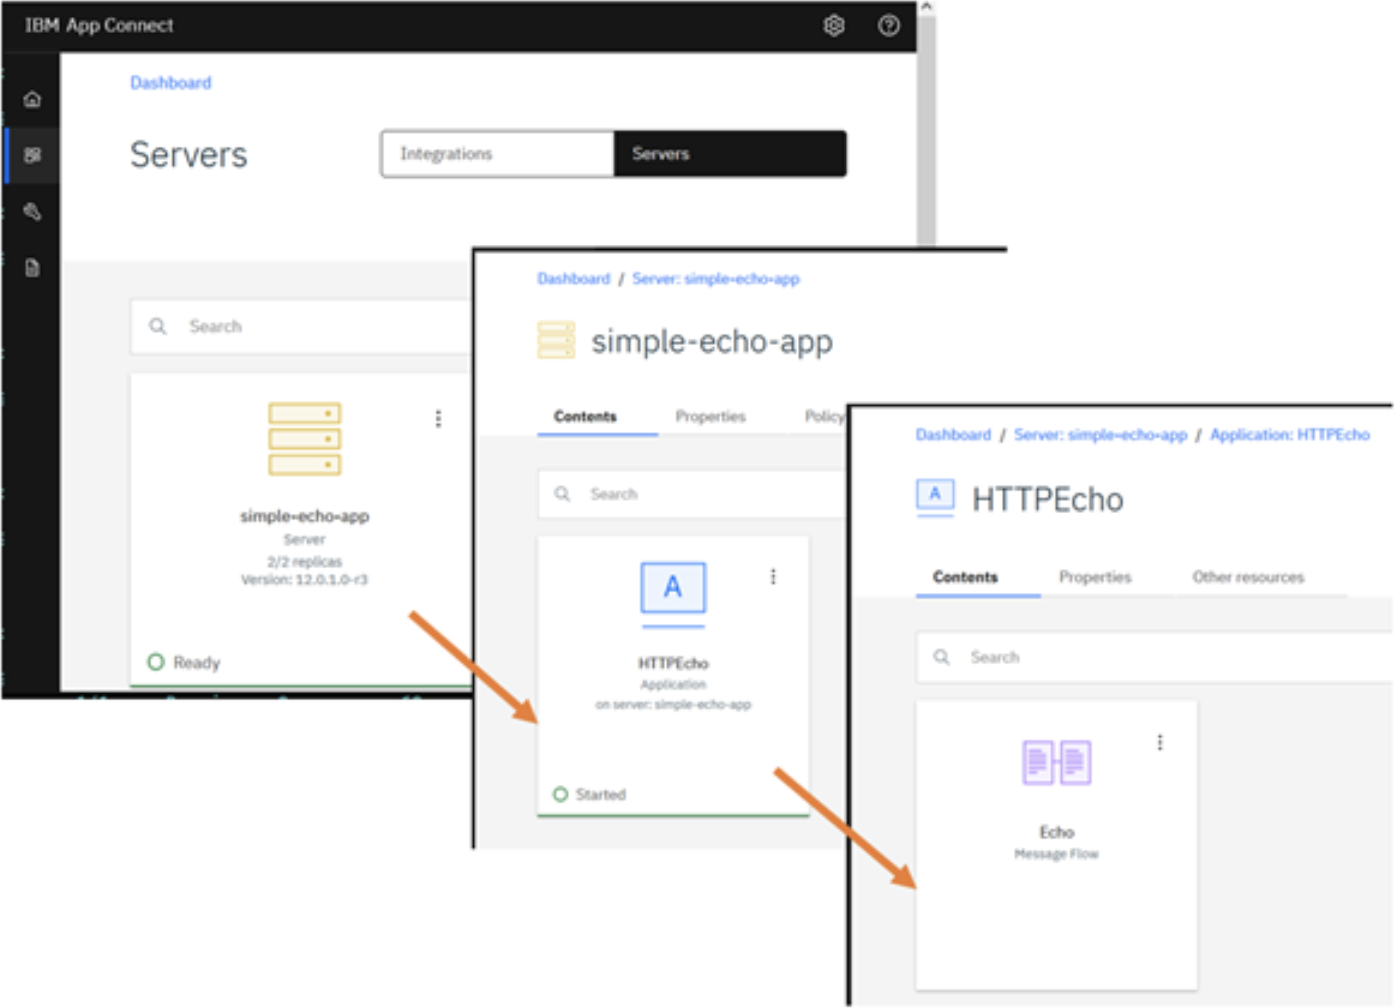
- You can drill down into the Integration Server and view the deployed applications and the message flows under each application.
![Viewing Deployed Applications in Integration Server]()
 Click 'Next' which takes you to the next screen where you can input the BAR file.
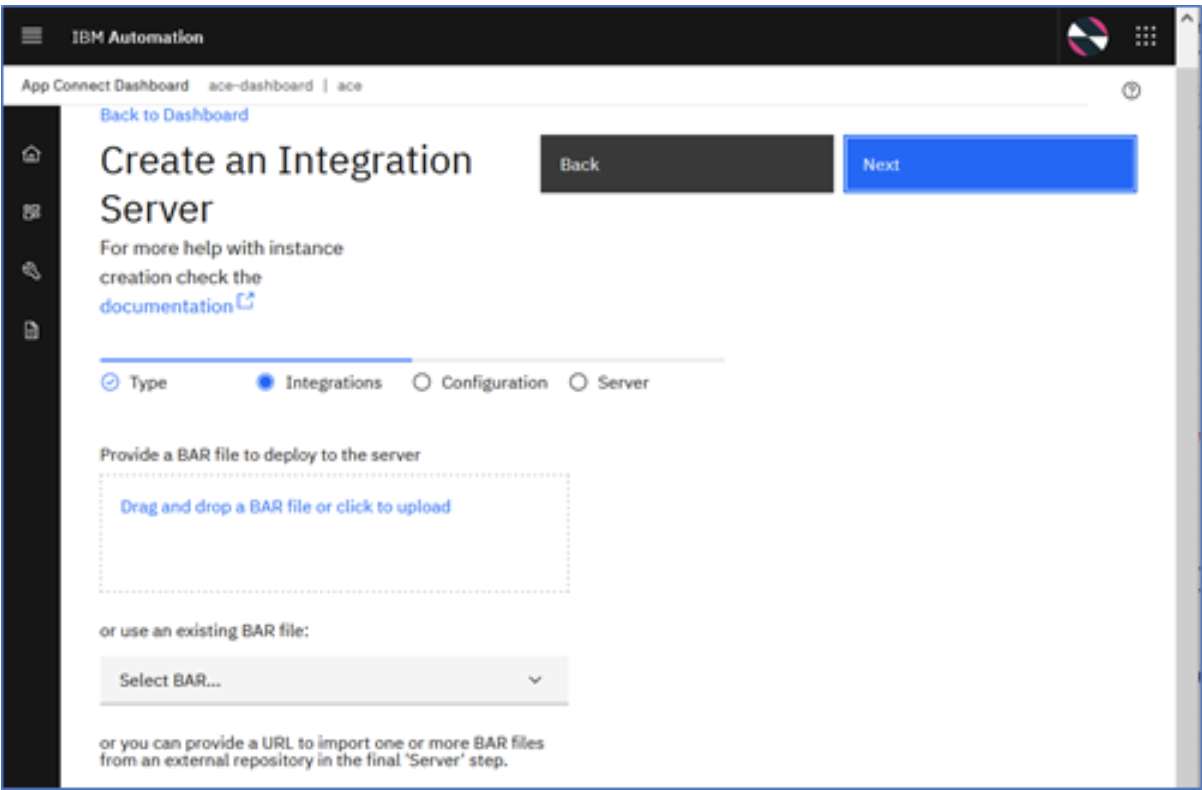
Testing the Message Flow
First, verify the status of your application by looking at the pod log:
$ oc logs <pod name>2021-10-26 10:16:06.172262: BIP2155I: About to 'Start' the deployed resource 'HTTPEcho' of type 'Application'.An http endpoint was registered on port '7800', path '/Echo'.2021-10-26 10:16:06.218826: BIP3132I: The HTTP Listener has started listening on port '7800' for'http' connections.2021-10-26 10:16:06.218973: BIP1996I: Listening on HTTP URL '/Echo'.
As you would have noticed, we deployed two replicas of the Integration Server for high availability purposes. The Integration Server tile on the ACE dashboard displays the number of replicas currently configured and running. You can verify it via the command line too by running the following command:
$ oc get podsNAME READY STATUS RESTARTS AGEsimple-echo-app-is-7bcbc4bbf-l8mls 1/1 Running 0 3d20hsimple-echo-app-is-7bcbc4bbf-zcdzq 1/1 Running 0 3d20h
Identify the public endpoint (routes) for the HTTP service.
$ oc get routesNAME HOST/PORTsimple-echo-app-http simple-echo-app-http-ace-demo.apps.cp4i-2021-demo.cp.fyre.ibm.comsimple-echo-app-https simple-echo-app-https-ace-demo.apps.cp4i-2021-demo.cp.fyre.ibm.com
The HOST/PORT entry as highlighted above forms the external base URL for invoking the webservice.
From the pod logs, we saw that the deployed HTTPEcho service is listening on service endpoint '/Echo'. So the complete URL to invoke the service would be :
http://simple-echo-app-http-ace-demo.apps.cp4i-2021-demo.cp.fyre.ibm.com/Echo
Invoke the Service Using Routes
Now test the message flow by invoking the service URL using the browser as shown below.
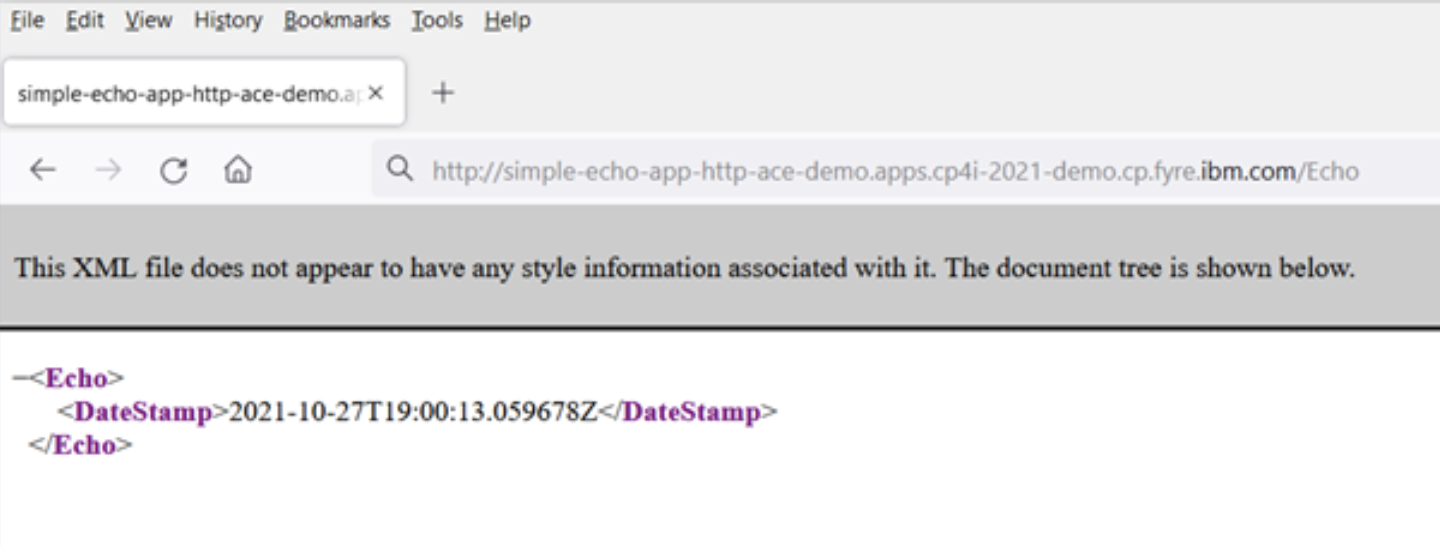
If you see the Echo response above, then you have managed to call your deployed flow.
Performing and administering deployments using the dashboard, performs exactly the same actions on the underlying Kubernetes platform as you would have done if using the command line. You can swap between the command line and user interface as you please, using whichever is the most effective for the job at hand.
Acknowledgment and thanks to Kim Clark for providing valuable inputs to this article.
Published at DZone with permission of Amar Shah. See the original article here.
Opinions expressed by DZone contributors are their own.
Comments