Native Memory Leak Diagnostics with Visual Studio 2015
Leak diagnostics is a nasty business in native applications. There have been many attempts at solving this problem automatically.
Join the DZone community and get the full member experience.
Join For Freeleak diagnostics is a nasty business in native applications. there have been many attempts at solving this problem automatically. to name a few:
- the crt debug heap (
which is no longer used by default in visual studio 2015!- see update below. ) can help identify memory leaks by associating each allocation with additional data on the allocating source file and line number. at program exit (or whenever a special crt function is called), all blocks that haven’t been freed are printed out. this has been around forever. the problem is that you need to compile with the crt debug heap enabled, so you can’t pick an arbitrary application and start analyzing it for memory leaks. it’s still a useful technique, and one used by boost test. if you’re interested, here’s a great walkthrough .
update : where would i be without you, dear readers! ofek shilon points out that it’s the windows debug heap that’s being phased out by default in visual studio 2015, and not the crt debug heap, which is still alive and kicking. here’s his post on the subject . - umdh (from the debugging tools for windows) can diagnose memory leaks by using built-in windows support for capturing allocation stack traces. when properly configured, the windows heap manager will keep track of all outstanding allocations and their stack traces, and umdh.exe can compare allocation snapshots as the program is executing and determine which blocks haven’t been freed. unlike the crt debug heap, you get a call stack for each leaking allocation, and you get aggregation so if you leaked 1,000 blocks from a single source location, you only see it once in the report. moreover, unlike the crt debug heap, you don’t need any ahead-of-time preparation. you can use umdh to diagnose any application without recompiling.
- the windows heap manager is instrumented with etw events (heapalloc/heaprealloc/heapfree), and wpa can aggregate them to show you blocks that were allocated but not freed during a particular trace you record. if you enable stack walking, you can get allocation call stacks as well. again, just like umdh, this doesn’t require ahead-of-time preparation and works with optimizations enabled.
i think the key problem with all the approaches above is the amount of configuration they require. most c++ developers want leak analysis to be available in their ide, and get the information at their fingertips without running an additional tool and subjecting themselves to complex trace analysis. (umdh reports are known for being user-unfriendly, and wpa has its quirks as well.)
native memory leak diagnostics in visual studio 2015
visual studio 2015 makes native leak analysis a lot easier for most developers. you will still need umdh or etw for production debugging and leak detection, but in the comfort of your development workstation, visual studio should be able to suit your needs. basically, you recompile with the visual c++ 2015 compiler, and then run your app with or without the debugger with the new diagnostic tools mode enabled (you can get there using the alt+f2 keyboard shortcut). to get this working while debugging, you will need to configure a special registry key. this requirement will hopefully go away at rtm, but for now you can find the instructions here .
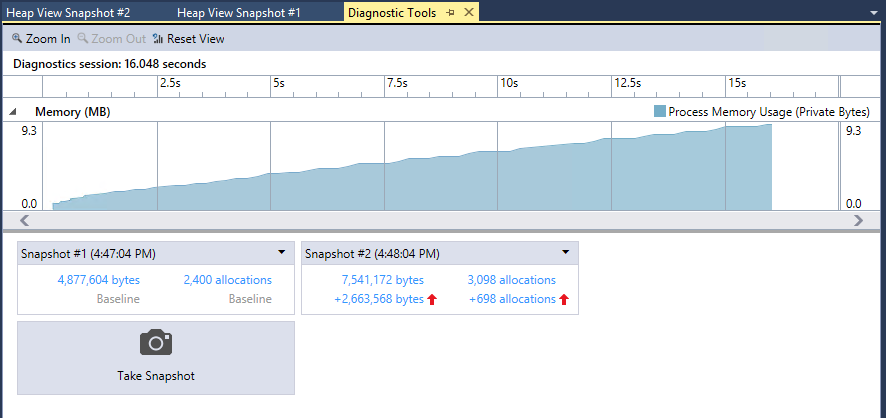
while the tools are running, you get a nice graph of memory utilization and can capture heap snapshots. you can see right away how many bytes you’re leaking and how many individual allocations they are coming from. in this case, over a span of just a few seconds we leaked over 2.5mb of memory.
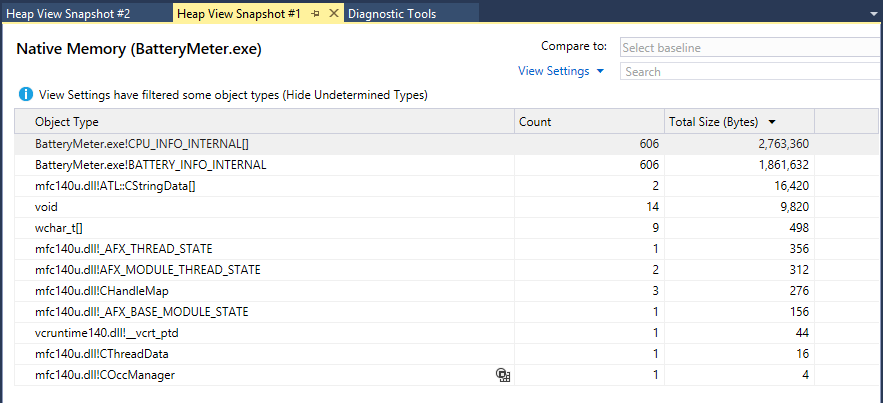
if you pick a specific snapshot, you can see details on what types are in that snapshot and how much memory is taken by objects of each type.
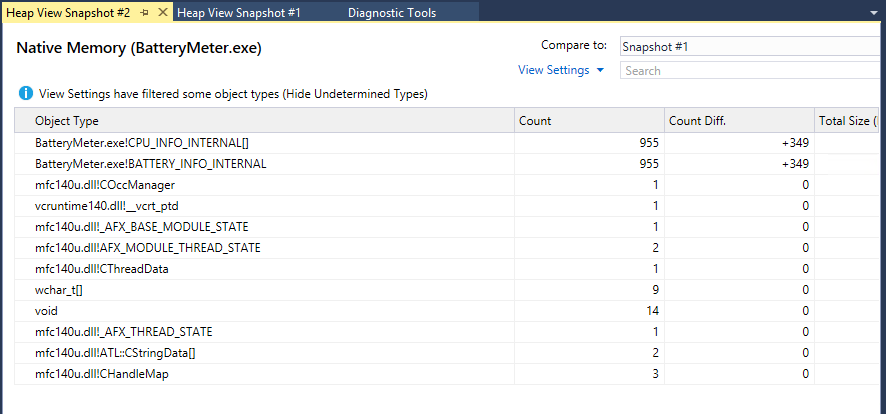
heap snapshots can be compared, producing easy to read information on which types of allocations are likely leaking. looks like we have arrays of cpu_info_internal and objects of battery_info_internal taking up lots of memory. all other types line up with no count delta.
and finally, you can dive in and see a list of all objects of a particular type, including their contents and where each individual object was allocated. this is probably the killer feature — you can look at the actual object contents if you like. that’s not something you get out of etw or umdh. you can also double click frames on the allocation call stack to jump to the source code.
it’s worth reiterating that this works with optimizations enabled. the screenshots above were produced using an optimized version. it does have an effect on call stack accuracy if frames are being inlined. in the preceding screenshot, the call stack appears as though temperatureandbatteryupdaterthread called operator new directly. in fact, it called a constructor for a type called batteryinformation , which isn’t visible in the call stack because it was inlined. (you might expect the /zo switch to make a difference, but presently it doesn’t. i’ll be sure to check future versions for better inline debugging support.)
wrap up
visual studio 2015 has really nice native memory debugging support. you can capture heap snapshots, compare them, and get to the bottom of memory leaks by looking at diffs and inspecting individual objects and their allocating call stacks. this experience is much more friendly than anything previously available (crt debug heap, umdh, etw) and will make leak analysis more streamlined for all native developers.
Opinions expressed by DZone contributors are their own.


Comments