Nice CPU Time – ‘ni’ Time in Top
The series continues with a look at nice time.
Join the DZone community and get the full member experience.
Join For FreeCPU consumption in Unix/Linux operating systems are studied using 8 different metrics: User CPU time, System CPU time, nice CPU time, Idle CPU time, Waiting CPU time, Hardware Interrupt CPU time, Software Interrupt CPU time, and Stolen CPU time. In this article, let's study ‘nice CPU time’.
What Is ‘nice’ CPU Time?
To understand ‘nice’ CPU time, one must first understand ‘nice’. When there is a CPU contention (i.e., multiple processes contend for CPU cycles), the process with higher priority are given more chances to run. In Unix/Linux operating systems, processes are launched with a priority 0 (default). However, using the ‘nice’ command, super users (like ‘root’) can set the priority for the processes as shown below:
nice -n nice_val [command]
Example:
xxxxxxxxxx
nice -n 15 java -jar buggApp.jar
Priority can range from -20 to 19. -20 is the highest priority with which a process can be launched. 19 is the lowest priority. For more options on how to launch process with nice priority or change the priority level using the renice command, refer to this article.
‘nice CPU time’ is the amount of time a CPU spends in running low priority processes (whose nice values are greater than 0).
How to Find ‘nice’ CPU Time
nice CPU time can be found from the following sources:
a. You can use web-based root cause analysis tools to report ‘nice’ CPU time. Use a tool capable of generating alerts if the ‘nice’ CPU time goes beyond a threshold. It should generate alerts if your application process is running with low priority.
b. ‘nice’ CPU time is also reported in the Unix/Linux command line tool ‘top’ in the field ‘ni’ as highlighted in the below image..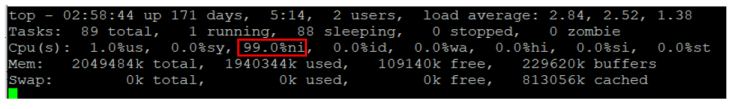
Fig: ni time in top
How to Simulate High ‘nice’ CPU Time
To simulate high ‘nice’ CPU reporting, let’s use BuggyApp. BuggyApp is an open source Java project that can simulate various sort of performance problems. When you launch BuggyApp with the following arguments, it will cause the CPU consumption to spike up on the host.
xxxxxxxxxx
java -jar buggyApp.jar PROBLEM_CPU
Now let’s launch BuggyApp with three different priorities and study the ‘nice’ CPU time reporting in the ‘top’.
1. Default Priority
Now let’s launch BuggyApp with default priority using the command:
xxxxxxxxxx
java -jar buggyApp.jar PROBLEM_CPU
Below is the screenshot of ‘top’ reporting on the host:
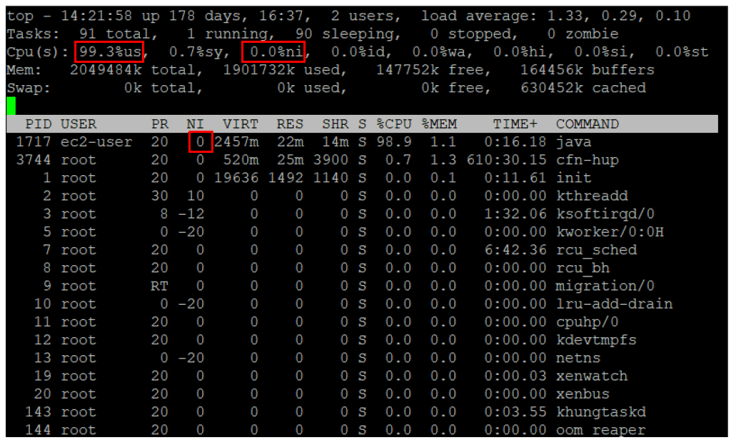
Fig: Normal priority process CPU consumption reported under ‘user’ in top
You can see that BuggyApp’s CPU utilization is reported under ‘user’ CPU utilization. You can see the ‘user’ CPU time is at 99.3%, whereas ‘nice’ CPU utilization is at 0.0%.
Note: ‘user’ CPU utilization is the amount of time your application spends executing application level code. To learn more about ‘user’ CPU time, refer to this article.
2. Low Priority
Now let’s launch the same BuggyApp with a low priority nice value ’10’. (Note: As values go higher than 0, priority becomes lower). You can launch the BuggyApp with low priority 10 using the ‘nice’ command:
xxxxxxxxxx
nice -n 10 java -jar buggyApp.jar PROBLEM_CPU
Below is the screenshot of ‘top’ reporting on the host:
Fig: Low priority process CPU consumption reported under ‘nice’ in top
You can see that BuggyApp’s CPU utilization is reported under ‘nice’ CPU utilization. You can see the ‘nice’ CPU time is at 99.3%, whereas ‘user’ CPU utilization is at 0.3%. The reporting is the total opposite of what we saw when the process was launched with default priority.
3. High Priority
Now let’s launch BuggyApp with a high priority nice value of ‘-10’. You can launch BuggyApp with high priority -10 using the ‘nice’ command:
xxxxxxxxxx
nice -n -10 java -jar buggyApp.jar PROBLEM_CPU
Below is the screenshot of the ‘top’ reporting on the host:
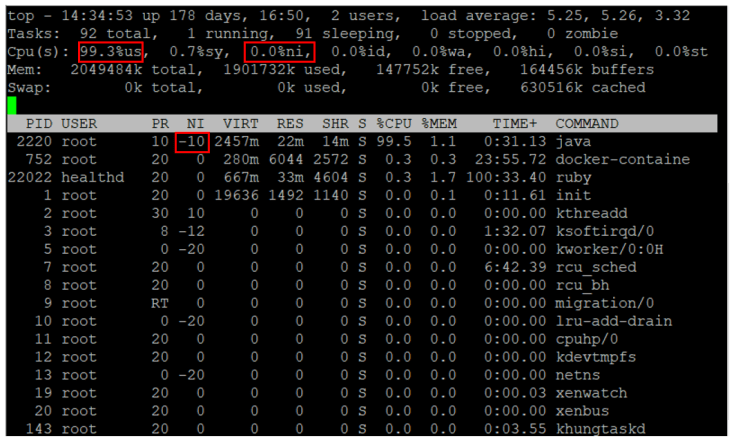
Fig: High priority process CPU consumption reported under ‘user’ in top
You can see that BuggyApp’s CPU utilization is reported under ‘user’ CPU utilization. You can see the ‘user’ CPU time is at 99.3%, whereas ‘user’ CPU utilization is at 0.0%. Note: Reporting is totally opposite of what we saw when the process was launched with lower priority.
What to Do if ‘nice’ CPU Time Is High
1. If your production application (and its dependent processes) are running with low priority and it is causing the nice CPU time to get too high, then increase the priority. Production applications should always run with default or high priority.
2. If ‘nice’ CPU consumption is intermittently high, then identify the process with high CPU time using a tool or the top command. Once identified, the tactical/short-term solution is to restart the offending process. The strategic/permanent solution is to optimize application performance.
3. If ‘nice’ CPU consumption is consistently high, then it could be indicative that you are running short on compute capacity. In such circumstances, you can do a couple of things:
- a. Upgrade the capacity of your device. Maybe move to a better EC2 instance (if you are in a cloud environment).
- b. Reduce the number of processes running on that device.
- c. Try adding more devices (i.e., EC2 instances) to your application pool so that your workload can be distributed.
Opinions expressed by DZone contributors are their own.
Comments