

Observability Architecture: Financial Calculations Example
Explore open-source cloud-based o11y financial calculations architecture with a schematic diagram that captures the elements of a successful solution.
 CORE
·
CORE
·
Join the DZone community and get the full member experience.
Join For FreeCloud-native technology has been changing the way payment services are architected. In 2020, I presented a series with insights from real implementations adopting open-source and cloud-native technology to modernize payment services.

The architectures presented were based on open-source cloud-native technologies, such as containers, microservices, and a Kubernetes-based container platform. The major omission in this series was to avoid discussing any aspect of cloud-native observability. This series will take a look at fixing that omission with an open-source standards-based cloud-native observability platform that helps DevOps teams control the speed, scale, and complexity of a cloud-native world for their financial payments architecture.
As linked in the conclusion of this article, the introduction in part one covered the baseline architecture, defined the payments project, and shared the planning for this series in adding observability to the logical and physical architectures. Part two explored the common architectural elements needed when adding cloud-native observability to your financial payments solutions. Part three discussed a physical architecture view of a financial payments example sharing insights into how to deploy your cloud-native observability at scale.
In this article, we'll walk through a financial calculations physical architecture, exploring how to add scalable cloud-native observability and laying out the various deployment options you have for your financial calculations observability solution.
Background of Generic Architectures
As a reminder, the architectural details covered here are based on real customer integration solutions using open-source technologies, and we are discussing here only the addition of cloud-native observability to this generic architecture.
The example scenario presented here is a generic common architecture that was uncovered researching customer solutions. It's our intent to provide an architecture with guidance and not too many in-depth technical details.
This section covers the visual representations as presented. There are many ways to represent each element in this architecture, but we've chosen icons, text, and colors that I hope are going to make it all easy to absorb. Feel free to post comments at the bottom of this post, or contact me directly with your feedback.
Now let's take a look at the details involved in adding cloud-native observability to this architecture and outline how it fits in this example.
Financial Calculations
The example architecture shown below entitled "Financial calculations example" outlines how its solution is applied to a physical architecture. Note that this diagram is focusing on the highest level of the financial calculations solution and the element groupings that apply to this process.
In a previous article, I covered this architecture in detail. Here, I want to focus only on the addition of cloud-native observability, shown here in the bottom right corner of the container platform.
You see below the Chronosphere Collector depicted without any incoming network details. This is done intentionally, representing the fact that the Collector is a standalone application designed to discover and scrape a Prometheus-based server that's exposed by your cloud-native applications. To show all these connections involves diagramming out every single component, service, and application, including the container platform itself, which would be overwhelming. This cleaner architectural representation assumes you understand this fact and leaves the details of ensuring there are Prometheus-based endpoints available to the Collector.
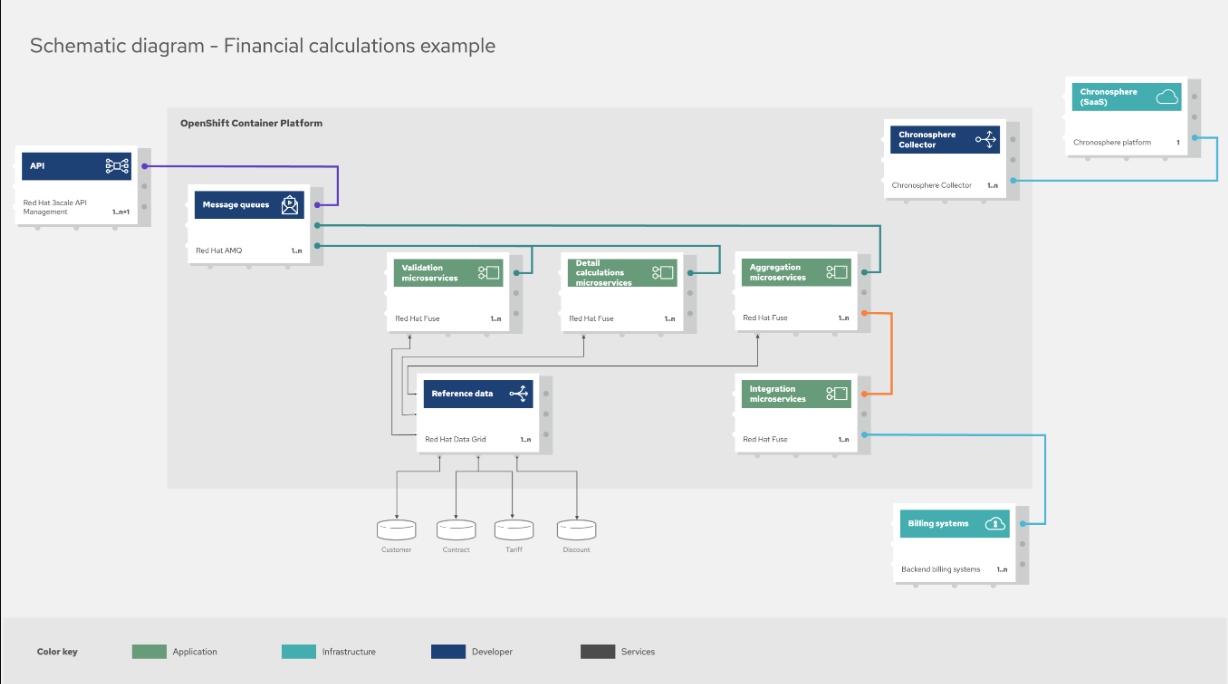
As depicted, the Collector sends any discovered data to the Chronosphere platform, managed as a single tenant instance, through a secured connection. If the Collector can't collect data from certain jobs or components, you can manually push to it. In addition to ingesting metrics, the Collector can:
- Filter, rename, and drop data that pass through it using standard relabeling rules.
- Add global labels to all data ingested.
- Receive traces from your services, such as OpenTelemetry (OTel) spans and other popular open-source formats like Jaeger and Zipkin.
Let's explore the options for deploying the Collector in your architecture to achieve the above-mentioned data ingestion based on your needs.
Collector Details
An early introduction to the details of the Collector was published in 2021, but as with all technologies the Collector has evolved since then. I'm going to review the details and then share a few deployment options to show the flexible coverage the Collector can have in your architecture.
The Collector makes use of Kubernetes and its services (Service Monitor and Pod Monitor) as sources of information on the latest within a cluster, its nodes, and its pods. This information is ingested into the Collector's processing layer where it determines which applications or pods to collect metrics data.
To receive telemetry or tracing data, the Collector can be set up as a Kubernetes Deployment, with a service in front to receive trace data. An application is then pushing its trace data to the service, which the Collector then receives the data from. By default, the Chronosphere platform and Collector default to the open standard format from OpenTelemetry (OTel) but you can configure it to use other supported formats such as Jaeger or Zipkin.
After collecting metrics and tracing data, a Collector will send them on to the Chronosphere platform where the Chronosphere metrics are ingested for analyzing, processing, and eventual storage.
Flexible O11y at Scale
The basics for using the Collector have been touched upon, but not in any sort of detail. In this section, I want to share the options you have to cover any of your potential architectural needs while being able to ensure effective cloud-native observability at scale.
To do this, you have three options as to how to set up your Collectors.
Default Use Case
A first use case is where you are looking for low latency (delays) for ingesting cloud-native application metrics data. This is also a case where you are looking to scale the observability horizontally as your Kubernetes clusters auto-scale when the load becomes higher. This case is the default recommendation of installing the Collector, which ensures that each node runs a copy of the Collector to pull all of the metrics from the pods and applications within that node as shown here: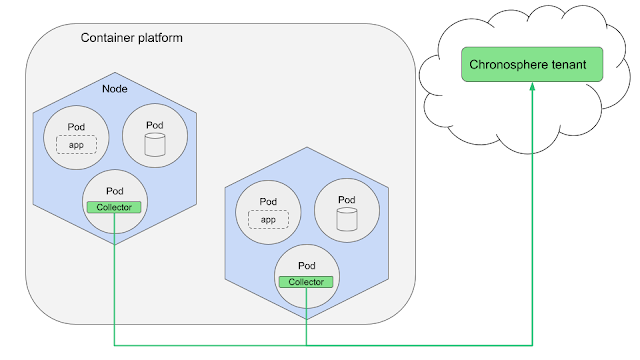
By having a single Collector per node, it's less likely to overload any single Collector and if you lose a node, you are only losing metrics data from that node instead of an entire cluster. Also note that some environments do not allow deploying as a DaemonSet, in which case you will need to explore one of the other options. Generally speaking, this deployment method is the easiest to manage.
High-Volume Use Case
For this use case is best handled by deploying as a sidecar, meaning you install a Collector in each Kubernetes Pod. This becomes a dedicated resource for each application and is ideal for high-volume metrics data-generating applications. You are also able to optimize resources for the Pod as the Collector and your application are running in containers within a single Pod.

If you want to customize metrics collection for a specific application within a node, this is the perfect way to achieve that on a per-application basis. There is more management overhead as you have administration for each Collector. Also note that if a Collector fails, for example, due to memory overruns, this could lead to disruptions to containers within that Pod.
The following architecture depicts both the default and high volume use cases covered so far, where the metrics data flow is depicted from the Collectors out to the Chronosphere platform:
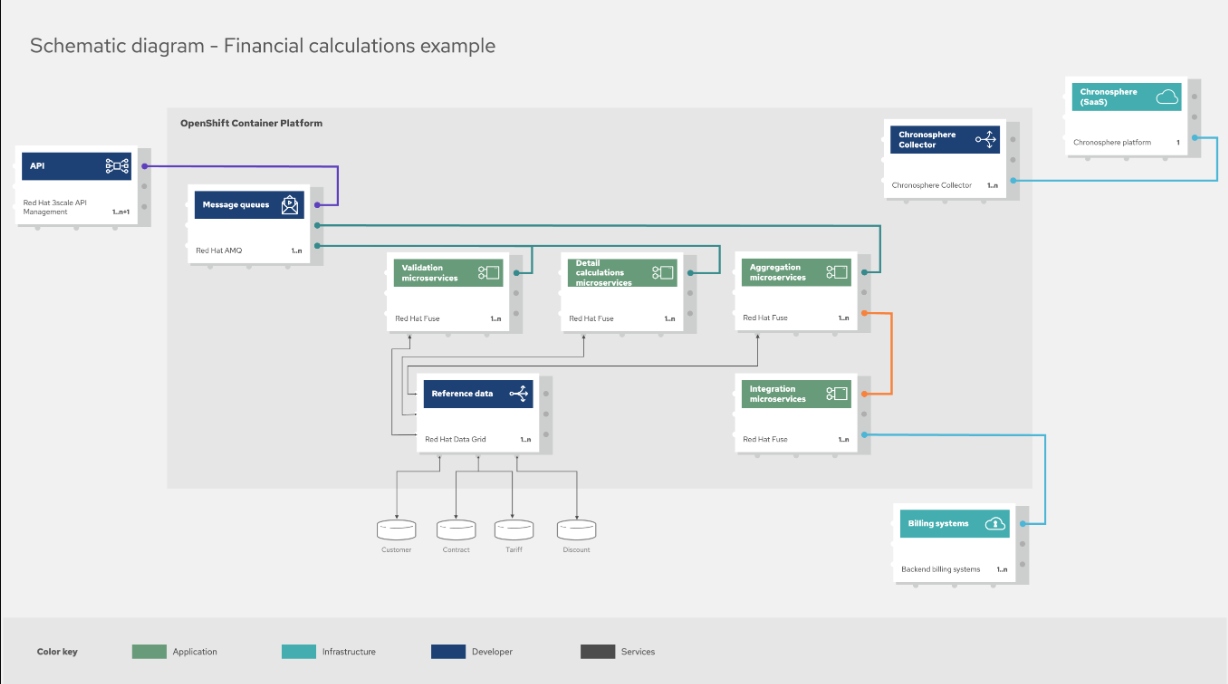
Note that this architecture depicts the focus of cloud-native observability with the Chronosphere Collector focused on the integration of microservices only. This is done to show how you can zoom in to specific areas of your architectural observability solution; in this case, the integration of microservices and how you are able to provide cloud-native observability at scale.
Now let's look at the final use case, which is used when you need push-based collection.
Push-Based Use Case
When you have telemetry and metrics data being pushed from your cloud-native applications, you can deploy the Collector as a Deployment. This approach provides you with the flexibility to pre-determine the number of Collectors and their allocated resources for greater control.
Below you can see that all the telemetry and metrics data is pushed to a Kubernetes Service, which then shares with the predetermined Collectors.
 This works well with distributed trace data and high cardinality metrics endpoints and is effective when configured using Prometheus Service Discovery.
This deployment type does require additional overhead to manage and control how the metrics load is split across the collectors within the Deployment. For example, if you undersize a Collector for your workloads, you could experience delays, scrap latency, or fail due to lack of memory. You also are not able to customize the push configuration of a Collector per application.
To give a better idea of what this might look like, refer to the architecture below where the observability telemetry and metrics data flow is depicted with green lines:

Hopefully, this overview gives you a good feel for how to apply this solution for cloud-native observability at scale in your organization's architecture.
Using the Payments Project
The architecture collection provided insights into all manner of use cases and industries researched between 2019 - 2022. The architectures each provide a collection of images for each diagram element as well as the entire project as a whole, for you to make use of as you see fit.
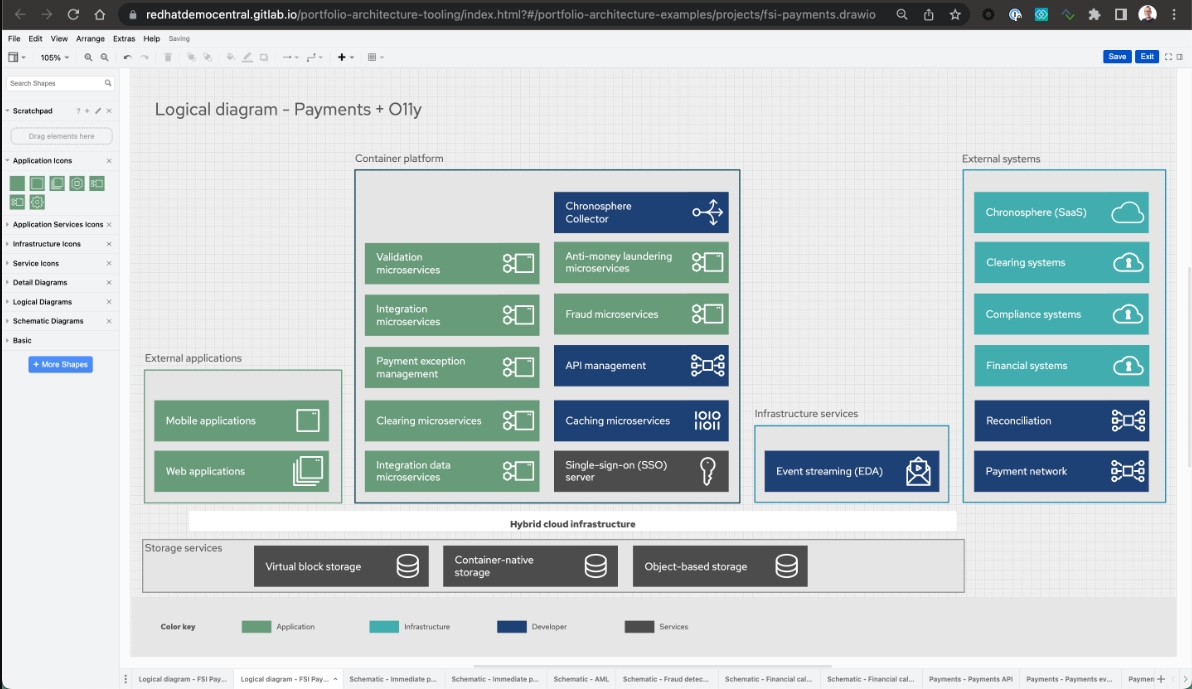
If we look at the financial payments project, you'll see a table of contents allowing you to jump directly to the topic or use case that interests you the most. You can also just scroll down through each section and explore at your leisure.
Download Diagrams
If you click on "Open Diagrams," it will open all the available logical, schematic, and detailed diagrams in the diagram tooling we used to create them. This makes them readily available for any modifications you might see fit to make for use in your own architectures, so feel free to use and modify!
Series Overview
The following overview of this o11y architecture series on adding cloud-native observability to your financial payments architecture can be found here:
- Observability Architecture: Financial Payments Introduction
- Observability Architecture: Financial Payments Common Observability Elements
- Observability Architecture: Financial Payments Example
- Observability Architecture: Financial Calculations Example (this article)
Catch up on any articles you missed by following one of the links above. I hope you have enjoyed this expanded series on adding cloud-native observability at scale to our financial payments architectures.
Published at DZone with permission of Eric D. Schabell. See the original article here.
Opinions expressed by DZone contributors are their own.
Comments