One Challenge With 10 Solutions
Get a blast from the past with these data analysis tools.
Join the DZone community and get the full member experience.
Join For Free
Technologies we use for Data Analytics have evolved a lot, recently. Good old relational database systems become less popular every day. Now, we have to find our way through several new technologies, which can handle big (and streaming) data, preferably on distributed environments.
Python is all the rage now, but of course there are lots of alternatives as well. SQL will always shine, and some other oldies-but-goldies, which we can never under-estimate, are still out there.
So, there are really a wide range of alternatives. Let's ramble through some of them, shall we?
I'll define a simple challenge in this post, and provide ten solutions written in ten different technologies :
| Awk | MapReduce |
| Perl | Pig |
| Bash | Hive |
| SQL | Scala |
| Python | MongoDB |
Together they represent the last 30+ years !
Using these technologies, we'll list the 10 most popular movies, using the two CSV datasets provided by Grouplens website.
The Dataset
We'll use MovieLens 100K Dataset. Actually, only the following two files from the archive:
u.data is tab delimited file, which keeps the ratings, and contains four columns:
user_id (int), movie_id (int), rating (int), time (int)
u.item is a pipe (|) delimited file. We only need to fetch movie titles from here, but there are several columns:
movieId int, movieTitle varchar(200), releaseDate date, videoReleaseDate date, imdbUrl varchar(300), flagGenreUnknown int, flagGenreAction int, flagGenreAdventure int, flagGenreAnimation int, flagGenreChildrens int, flagGenreComedy int, flagGenreCrime int, flagGenreDocumentary int, flagGenreDrama int, flagGenreFantasy int, flagGenreFilmNoir int, flagGenreHorror int, flagGenreMusical int, flagGenreMystery int, flagGenreRomance int, flagGenreSciFi int, flagGenreThriller int, flagGenreWar int, flagGenreWestern int
Our Goal
We'll aggregate the ratings data (u.data) to calculate an average rating per movie_id and find the ten movies with the highest average rating.
We'll ignore the movies, which have less than a hundred ratings. Otherwise, we'll find lots of 5-star movies, which are rated by only one or two users. So, we'll filter them out.
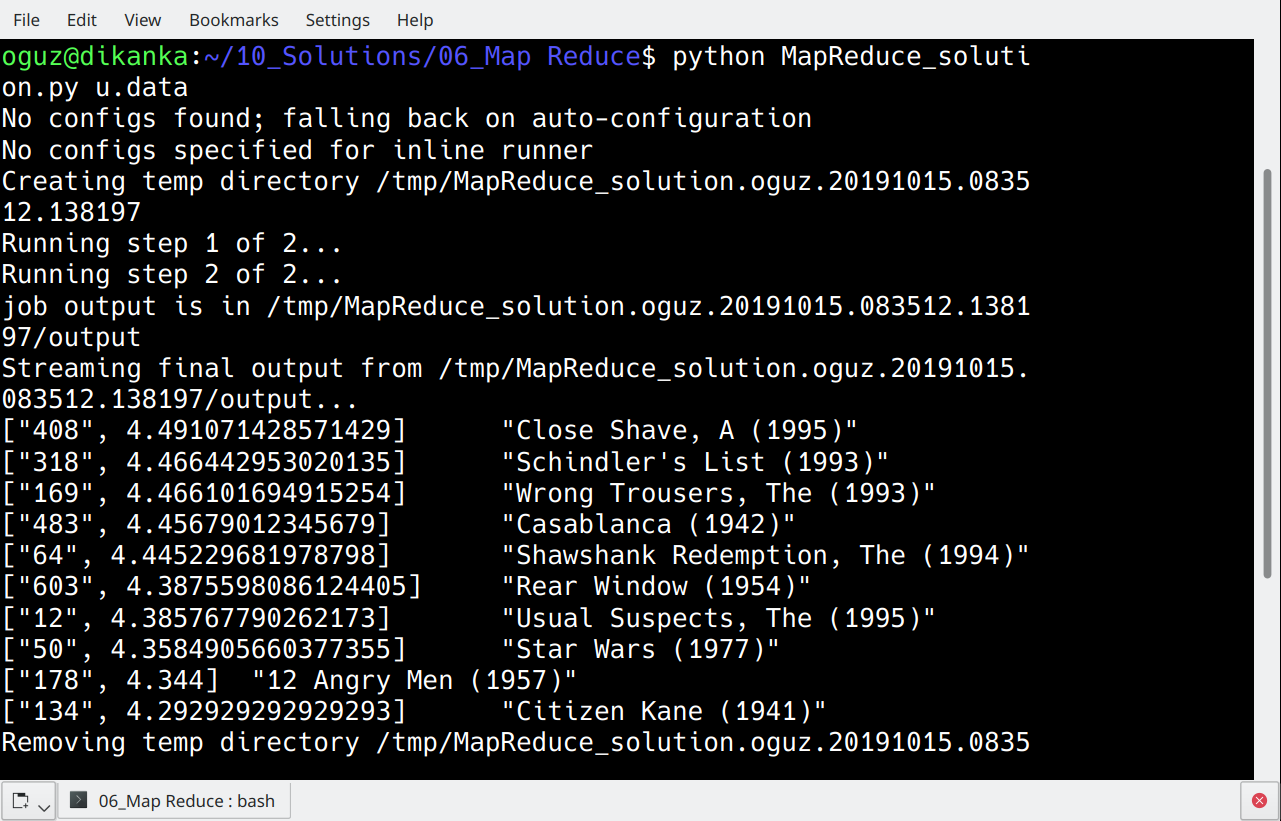
Then, we'll use a join with to the movie data (u.item) to fetch the movie title. The result will contain the movie_id, movieTitle, and averageRating, as seen below.
| 1 | 408 |
Close Shave, A (1995) |
4.4910714285714286 |
| 2 | 318 |
Schindler's List (1993) |
4.4664429530201342 |
| 3 | 169 |
Wrong Trousers, The (1993) |
4.4661016949152542 |
| 4 | 483 |
Casablanca (1942) |
4.4567901234567901 |
| 5 | 64 |
Shawshank Redemption, The (1994) |
4.4452296819787986 |
| 6 | 603 |
Rear Window (1954) |
4.3875598086124402 |
| 7 | 12 |
Usual Suspects, The (1995) |
4.3857677902621723 |
| 8 | 50 |
Star Wars (1977) |
4.3584905660377358 |
| 9 | 178 |
12 Angry Men (1957) |
4.3440000000000000 |
| 10 | 134 |
Citizen Kane (1941) |
4.2929292929292929 |
Now, we are ready to go.
1. AWK

AWK is almost as old as me, but it's still the most powerful tool around for text processing under *nix. You shall not necessarily think of it as a replacement for your favorite programming language, but it's definitely worth giving it a try, especially when you deal with huge text processing tasks.
A lot of people use AWK in combination with other technologies to make use of its great capabilities in text-processing.
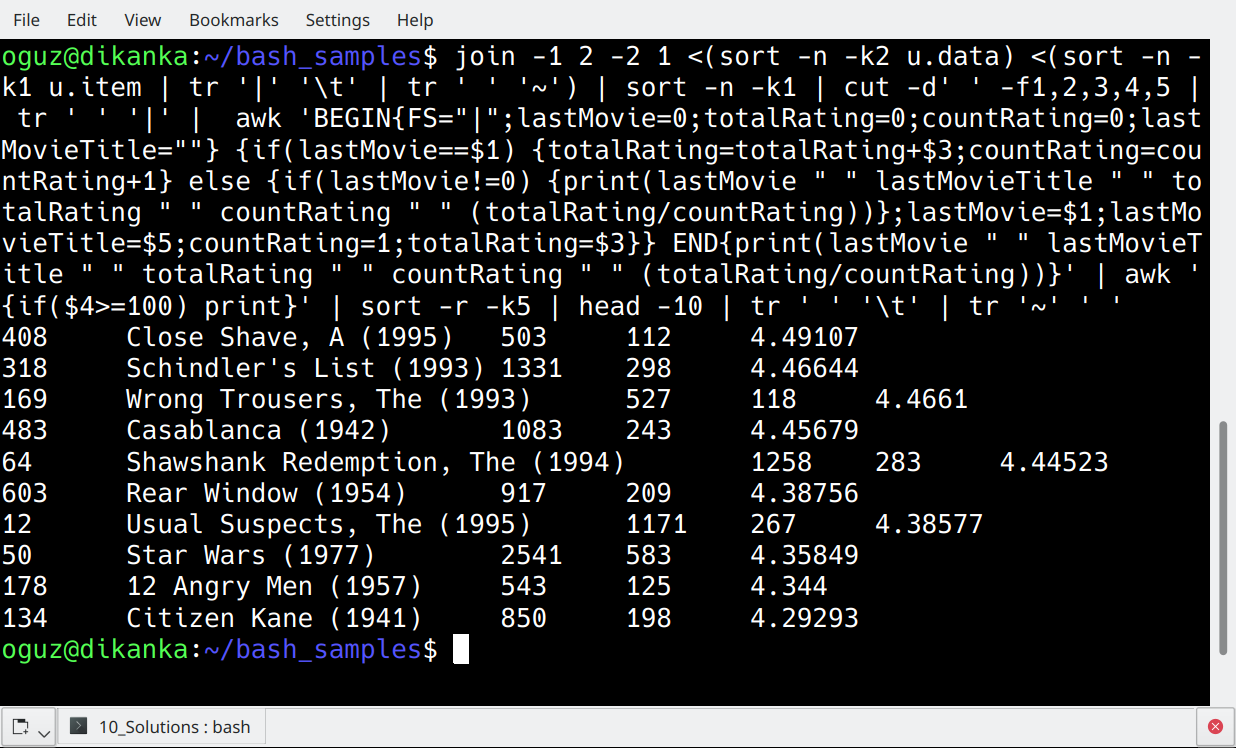
Here's the AWK solution for our challenge. And that's a one-liner --- No uploads, no temporary files, we don't even need a script file for that!
join -1 2 -2 1 <(sort -n -k2 u.data) <(sort -n -k1 u.item | tr '|' '\t' | tr ' ' '~') | sort -n -k1 | cut -d' ' -f1,2,3,4,5 | tr ' ' '|' | awk 'BEGIN{FS="|";lastMovie=0;totalRating=0;countRating=0;lastMovieTitle=""} {if(lastMovie==$1) {totalRating=totalRating+$3;countRating=countRating+1} else {if(lastMovie!=0) {print(lastMovie " " lastMovieTitle " " totalRating " " countRating " " (totalRating/countRating))};lastMovie=$1;lastMovieTitle=$5;countRating=1;totalRating=$3}} END{print(lastMovie " " lastMovieTitle " " totalRating " " countRating " " (totalRating/countRating))}' | awk '{if($4>=100) print}' | sort -r -k5 | head -10 | tr ' ' '\t' | tr '~' ' 'This might look like line noise to those who are not familiar with Linux. So, let's give some explanation here.
Step 1: Join the Datasets
Join receives the two datasets, u.data and u.item, and joins them to produce one single dataset. It uses the second column from the first dataset (-1 2) to match the first column in the second dataset (-2 1) as a join condition.
u.data is sorted on second column (-k2) before the join operation. u.item is pipe-delimited, but we'd better change it to a tab-delimited format before the join. I do it with tr.
I use a second tr to replace spaces (in movie titles) with tilde (~) characters. It's because join command output is space delimited by default, and it's buggy when you customize the separator. That's why we get rid of the spaces here. We'll change them back to spaces later.
Step 2: Sort, Cut and TR
The joined dataset is sorted on movie id. That's a numeric sort on the first column. (-n -k1). Then, I use cut to fetch the first five columns. I don't need all those columns from the u.item file. Finally, tr converts the space delimited file to a pipe-delimited file.
Step 3: AWK
AWK loops through the joined dataset, which is sorted by movieid. I have two variables to keep movieID and movieTitle, and if they are different that what I read from the current row, awk prints an output line.
The output of this first awk command has one row per movie, with average ratings.
Step 4: Again AWK
The second awk is used to filter out movies with less than a hundred ratings.
Step 5: Sort, Head and TR
Then we sort the movies by their ratings, and use head to fetch the top 10 movies. Finally, we use tr to convert the output to a tab-delimited format, and to convert tilde's back to spaces.
2. PERL

Why so many people hate Perl is beyond my understanding. It's a cute programming language in which you don't need to encrypt your code. That's because, as Keith Bostic already stated, Perl is "the only language that looks the same before and after RSA encryption."
Recently, Perl's decreased popularity triggered discussions on Perl slowly fading away. No doubt, it's far less popular than it used to be in the 90's.
But still.. It's much faster than Bash... It's pre-installed in most of the linux distributions... Also, Perl's focus was on report processing from the very beginning. So why not? Let's see how we process our this top-10 movies report using Perl.
#!/usr/bin/perl use strict;
use warnings;

open (fle_ratings, '<', 'u.data') or die "Could not open u.data: $!";

my %hash1 = ();
while ()
{
    chomp $_;
    my ($user_id, $movie_id, $rating) = split(/\t/, $_);
    if(exists($hash1{$movie_id})){
       $hash1{$movie_id}[0]+=$rating;
       $hash1{$movie_id}[1]+=1;
    } else {
       $hash1{$movie_id}[0]=$rating;
       $hash1{$movie_id}[1]=1;
    }
    #print "$hash1{$movie_id}[0] *** $hash1{$movie_id}[1] \n"
   }
my %hash2 = ();
foreach my $key (keys %hash1)
{
    if ($hash1{$key}[1] >= 100) {
       $hash2{$key}=$hash1{$key}[0] / $hash1{$key}[1];
    }
}
close fle_ratings;

my $counter=0;
foreach my $movid (sort { $hash2{$b} <=> $hash2{$a} or $a cmp $b } keys %hash2) {
    my $movie='';
    open(fle_movies, '<', 'u.item') or die "Could not open u.item: $!";
    while ()
    {
       chomp $_;
       my ($movie_id, $movie_title) = split(/\|/, $_);
       if($movid==$movie_id){
          $movie=$movie_title;
          last;
       }
    }
    print "$movid $movie $hash2{$movid}\n";
    last if ++$counter == 10;
}
Ok, this was a Perl script, and I don't see a good reason to hate that. Maybe that weird parameter for sort, but I can live with it.
I'll put it in a text file, make it executable, and directly execute it. You might think all these loops are performance-killers, but it's not the case: Perl returns the results in no time.
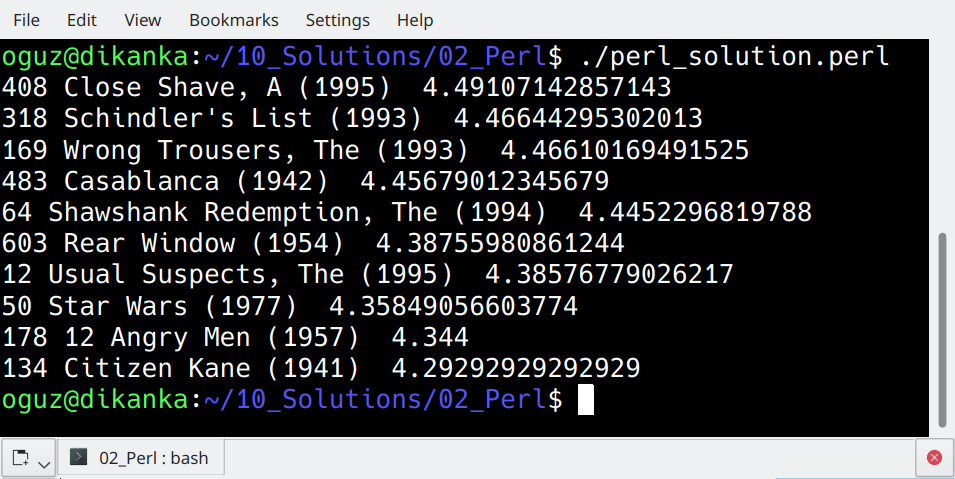
After the one-liner in AWK, this script looks over-sized, doesn't it ?
Let's dive into this code a little bit.
While Loop
We loop through ratings dataset, and populate a hash named hash1. Hash1 will keep the sum and count of ratings.
The First Foreach Loop
Now we process each member of hash1, and populate a new hash named hash2 with the average values.
The Second Foreach Loop
We process each member of hash2, but after applying a descending sort on values. Then, we iterate through this loop only until our counter hits 10. So these are the top 10 rated movies.
For each of these movies, we search for the movie title in movies dataset. This is a while loop inside our foreach loop. The moment we find our movie, we break the loop.
3. BASH

The most popular Linux shell does not need any introduction. I'll directly jump into the BASH script solution.
fle="u.data"
declare -a ratings
for movid in $(cut -f2 $fle | sort | uniq)
do
    countLines=$(grep "^[0-9]*\s$movid\s" $fle | cut -f3 | wc -l)
    sumRatings=$(grep "^[0-9]*\s$movid\s" $fle | cut -f3 | paste -sd+ | bc)
    avgRating=$(eval "echo 'scale=6; $sumRatings/$countLines' | bc")
    if [ $countLines -gt 100 ]
    then
        ratings[$movid]=$avgRating
    fi
done
for k in "${!ratings[@]}"
do
  echo $k'|'${ratings["$k"]}'|'$(grep ""^$k\|"" u.item | cut -d"|" -f2)
done | sort -r -t'|' -k2 | head -10
This time it's a different approach.
cut -f2 $fle | sort | uniq
It will give me the sorted distinct list of movie ids. I loop through each movie id and calculate the count of lines, which is, the count of ratings given for that movie.
The regular expression ^[0-9]*\s$movid\s gives me the lines that contain a specific movie id in the second column. ^ stands for line beginning, [0-9]* will match any number of integers, and \s is for the tab characters.
I also calculate the sum of ratings here. cut -f3 after grep will return all the rating values for a specific movie. paste will help me produce a single text combining these rating values, with the delimiter "+", and bc will calculate the result of this summation.
Then I'll loop through my ratings array, find movie titles for each, and print the 10 values with the highest rating.
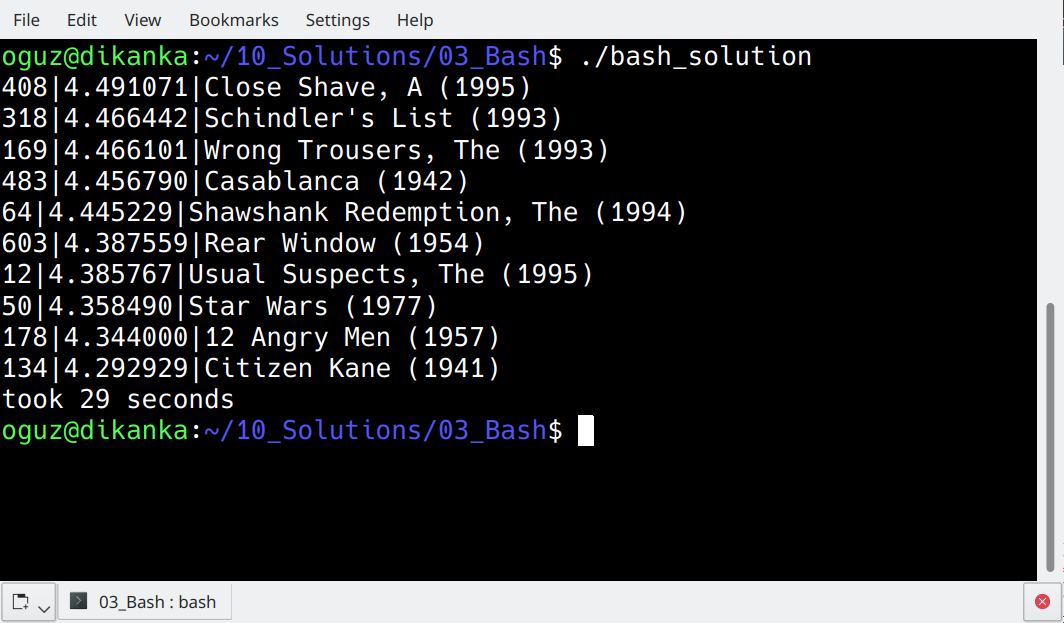
Although it looks like a simpler solution, it takes up to 30 seconds to finish. The ugly Perl easily outperformed Bash!
4. SQL (PostgreSQL)

The easiest for most of us, would be loading the data into our favorite RDBMS and writing a SQL query to generate the results. I'll use PostgreSQL.
First, I'll change the encoding of u.item file (you may need this if you encounter encoding issues with movie titles):
iconv -f ISO-8859-1 -t UTF-8 u.item > movie_def.txtThen, let's create tables and load data into them:
postgres=# \c olric

You are now connected to database "olric" as user "postgres".

olric=# create table ratings (userId int, movieId int, rating int, timestamp int);

CREATE TABLE
olric=# create table movies (movieId int, movieTitle varchar(200), releaseDate date, videoReleaseDate date, imdbUrl varchar(300), flagGenreUnknown int, flagGenreAction int, flagGenreAdventure int, flagGenreAnimation int, flagGenreChildrens int, flagGenreComedy int, flagGenreCrime int, flagGenreDocumentary int, flagGenreDrama int, flagGenreFantasy int, flagGenreFilmNoir int, flagGenreHorror int, flagGenreMusical int,  flagGenreMystery int, flagGenreRomance int, flagGenreSciFi int, flagGenreThriller int, flagGenreWar int, flagGenreWestern int);

CREATE TABLE
olric=# COPY ratings FROM '/home/oguz/10_Solutions/u.data';
COPY 100000
olric=# COPY movies FROM '/home/oguz/10_Solutions/movie_def.txt' with (format csv, DELIMITER '|', force_null(videoReleaseDate));
COPY 1682
And here's the SQL to give the results :
olric=# WITH avgRatings AS (SELECT movieId, AVG(rating) AS avgRating FROM ratings GROUP BY movieId HAVING COUNT(*) >= 100) SELECT m.movieId, m.movieTitle, a.avgRating FROM movies m JOIN avgRatings a ON m.movieId=a.movieId ORDER BY a.avgRating DESC LIMIT 10; 408 | Close Shave, A (1995) | 4.4910714285714286
318 | Schindler's List (1993) | 4.4664429530201342
169 | Wrong Trousers, The (1993) | 4.4661016949152542
483 | Casablanca (1942) | 4.4567901234567901
64 | Shawshank Redemption, The (1994) | 4.4452296819787986
603 | Rear Window (1954) | 4.3875598086124402
12 | Usual Suspects, The (1995) | 4.3857677902621723
50 | Star Wars (1977) | 4.3584905660377358
178 | 12 Angry Men (1957) | 4.3440000000000000
134 | Citizen Kane (1941) | 4.29292929292929295. Python with Pandas

Python is already extremely popular as a choice for Data Science. If it keeps the pace, Python can probably become the most popular programmig language of the world, in couple of years. Currently Python holds the third place, after Java and C.
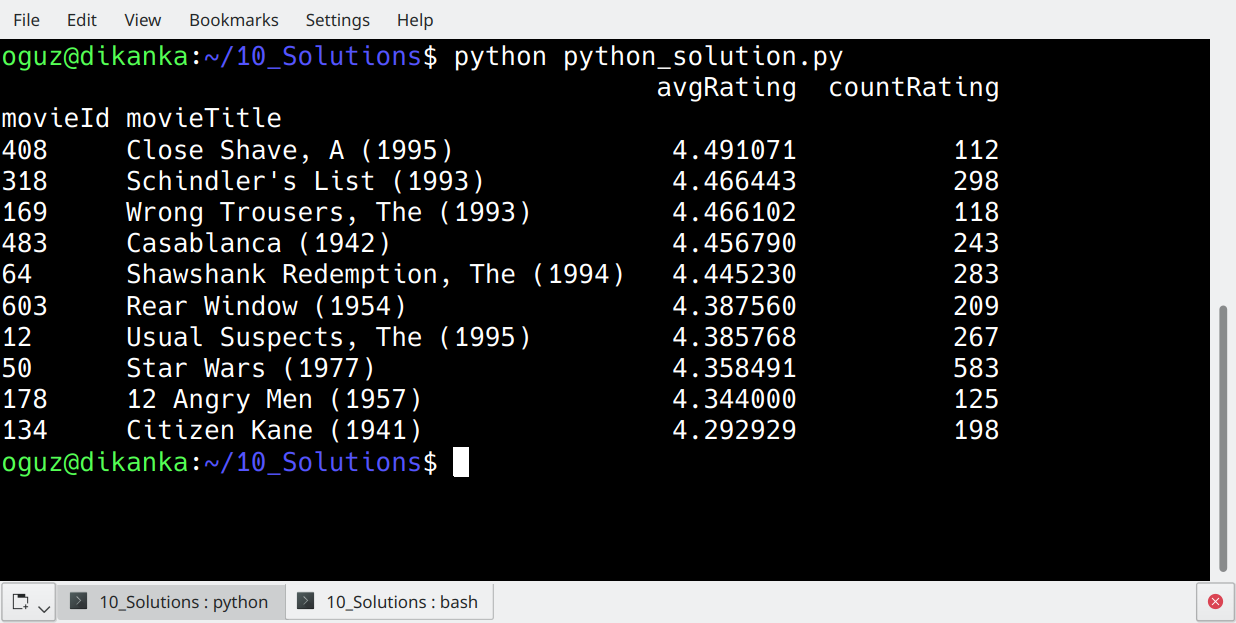
The following Python solution uses pandas library, which makes data analytics tasks so easy.
import pandas as pd
ratings = pd.read_csv('u.data', delimiter='\t', names = ['userId', 'movieId', 'rating', 'ratingTime'])
movies = pd.read_csv('u.item', delimiter='|', usecols=[0,1], names = ['movieId', 'movieTitle'])
joined=pd.merge(ratings, movies, how='inner', on='movieId')
averages=joined.groupby(['movieId','movieTitle']).agg({'rating':'mean', 'userId':'count'})
averages.columns=['avgRating', 'countRating']
print(averages[averages.countRating>=100].sort_values(by=['avgRating'], ascending=False).head(10))
So this is even more readable code than a SQL query, isn't it?
6. MapReduce With MRJob in Python

You'd probably better use less complex tools like Pig, Hive, or Spark, but MapReduce is the quintessential way of processing data under Apache Hadoop.
Let's take a look at how we deal with our challenge, using MapReduce. For this purpose, I'll again use Python, but this time, with the MRJob library.
from mrjob.job import MRJob
from mrjob.step import MRStep
import csv
class RatingsBreakdown(MRJob):

    def movie_title(self, movid):
    with open("/home/oguz/10_Solutions/u.item", "r") as infile:
        reader = csv.reader(infile, delimiter='|')
        next(reader)
        for line in reader:
            if int(movid) == int(line[0]):
                return line[1]
    def steps(self):
        return [
            MRStep(mapper=self.mapper1, reducer=self.reducer1),
        MRStep(mapper=self.mapper2, reducer=self.reducer2)
        ]

    def mapper1(self, _, line):
        (userID, movieID, rating, timestamp) = line.split('\t')
        yield movieID, rating

    def reducer1(self, key, values):
    i,totalRating,cnt=0,0,0
    for i in values:
        totalRating += int(i)
        cnt += 1
    if cnt>=100:
        yield key, totalRating/float(cnt)
    def mapper2(self, key, values):
    yield None, (values, key)
    def reducer2(self, _, values):
    i=0
    for rating, key in sorted(values, reverse=True):
        i+=1
        if i<=10:
            yield (key,rating), self.movie_title(int(key))


if __name__ == '__main__':
    RatingsBreakdown.run()
I think here we need some explanations.
steps(self) gives an overline of our mapreduce job. There are two steps defined in our case.
Each step can consist of a mapper, a combiner, and a reducer. Though they are all optional, a step will consist of at least one of them. Both of our steps consist of one mapper and one reducer.
Mapper of our first step (mapper1) splits all lines of the u.data file using tab as the delimiter. We now have all four columns in hand, but we are interested only in movie id's and ratings, so the mapper returns these two values.
Mappers don't aggregate data. So, if there are n rows coming in, mapper output is also n rows.
Reducer of our first step (reducer1) is used to calculate average rating per movie id. The reducer receives movie id as key and rating as values.
Aggregation is by default on key value. We'll just need to calculate the aggregated value and return it using yield.
All mappers and reducers return key and value pairs. The return value of reducer1 gives movie id's as keys, and average ratings as values.
Now the data is aggregated, output of reducer1 has one (and only one) row per movie id.
Mapper of our second step (mapper2) moves the movie id out of the key. key becomes a null value (None) and value is now a list of movie id and average ratings.
That's because we want to find the highest rated movies. The next reducer shall scan the entire data set and find the top rated movies. To make sure all the data is scanned, we have to empty the key - otherwise reducer will operate for all keys separately.
reducer1 sorts the data on values. Values is a list, and its first member is the average rating, so our reverse ordered loop will begin with the highest rated movie, and stops at the tenth row.
7. Pig Latin

Pig Latin gives us the chance to use a much simpler notation than MapReduce itself. So, it's a high-level tool that can execute jobs in MapReduce (or Tez or Spark)
The Pig Latin solution to our challenge is here :
ratings = LOAD '/user/hdpuser/movies/u.data' AS (userid:int, movieid:int, rating:int, time:int);

grp_ratings = GROUP ratings BY movieid;

avg_rat = FOREACH grp_ratings GENERATE group as movid, AVG(ratings.rating) as avgRating , COUNT(ratings.movieid) as cnt_rat;

avg_ratings = FILTER avg_rat BY cnt_rat >= 100;

movies = LOAD '/user/hdpuser/movies/u.item' USING PigStorage('|') AS (movieid:int, moviename:chararray);

joined = JOIN avg_ratings BY movid, movies BY movieid;

dataset = FOREACH joined GENERATE movies::moviename as movnam, avg_ratings::avgRating as avgRating;

ordered = ORDER dataset BY avgRating desc;

top10 = LIMIT ordered 10;

DUMP top10;
The code itself is pretty self-explanatory, so I'll skip the explanations here.
8. Hive

Just like Pig, Hive provides an easier platform to deal with data on Apache Hadoop. Unlike Pig, Hive is Data warehouse Infrastructure. So we'll create tables under Hive console, and physically store our data under Hive.
create database olric;

CREATE EXTERNAL TABLE IF NOT EXISTS olric.ratings_temp
(userId INT, movieId INT, rating INT, ratingTime INT)

ROW FORMAT DELIMITED
FIELDS TERMINATED BY '\t'
STORED AS TEXTFILE
LOCATION 'hdfs://dikanka:8020/user/oguz/MovieData/ratings';

select * from olric.ratings_temp limit 10;

CREATE EXTERNAL TABLE IF NOT EXISTS olric.movies_temp
(movieId int, movieTitle varchar(200), releaseDate date, videoReleaseDate date, imdbUrl varchar(300), flagGenreUnknown int, flagGenreAction int, flagGenreAdventure int, flagGenreAnimation int, flagGenreChildrens int, flagGenreComedy int, flagGenreCrime int, flagGenreDocumentary int, flagGenreDrama int, flagGenreFantasy int, flagGenreFilmNoir int, flagGenreHorror int, flagGenreMusical int,  flagGenreMystery int, flagGenreRomance int, flagGenreSciFi int, flagGenreThriller int, flagGenreWar int, flagGenreWestern int)
ROW FORMAT DELIMITED
FIELDS TERMINATED BY '|'
STORED AS TEXTFILE
LOCATION 'hdfs://dikanka:8020/user/oguz/MovieData/movies';

select movieId, movieTitle from movies_temp limit 10;
I created a database named olric in Hive console. I created two external tables, which point to my u.data and u.item files on Hadoop.
We still didn't store the data physically under Hive. We'll do that now:
CREATE TABLE IF NOT EXISTS olric.ratings
(userId INT, movieId INT, rating INT)
STORED AS ORC;

INSERT OVERWRITE TABLE olric.ratings SELECT userId, movieId, rating FROM olric.ratings_temp;

select count(*) from olric.ratings;

CREATE TABLE IF NOT EXISTS olric.movies
(movieId int, movieTitle varchar(200))
STORED AS ORC;

INSERT OVERWRITE TABLE olric.movies SELECT movieId, movieTitle FROM olric.movies_temp;

select count(*) from olric.movies;
Now that we have our Hive tables, we can use good-old SQL skills, to write the following HiveQL:
with rat as (select movieId, avg(rating) as avgRating, count(*) as cnt from olric.ratings GROUP BY movieId) select rat.movieId, mov.movieTitle, rat.avgRating from rat join olric.movies mov on rat.movieId=mov.movieId where cnt >= 100 order by avgRating desc limit 10;INFO : OK
+--------------+-----------------------------------+---------------------+
| rat.movieid | mov.movietitle | rat.avgrating |
+--------------+-----------------------------------+---------------------+
| 408 | Close Shave, A (1995) | 4.491071428571429 |
| 318 | Schindler's List (1993) | 4.466442953020135 |
| 169 | Wrong Trousers, The (1993) | 4.466101694915254 |
| 483 | Casablanca (1942) | 4.45679012345679 |
| 64 | Shawshank Redemption, The (1994) | 4.445229681978798 |
| 603 | Rear Window (1954) | 4.3875598086124405 |
| 12 | Usual Suspects, The (1995) | 4.385767790262173 |
| 50 | Star Wars (1977) | 4.3584905660377355 |
| 178 | 12 Angry Men (1957) | 4.344 |
| 134 | Citizen Kane (1941) | 4.292929292929293 |
+--------------+-----------------------------------+---------------------+9. Spark with Scala

According to Tiobe index listings, Scala is still not as popular as Cobol :) — But you can easily see that the hype continues on Scala.
It's a functional programming language, and is the other language which runs on JVM (Java virtual machine). Spark, itself, is written in Scala. If you want to learn Spark, this is the popular reason to prefer Scala over Python.
Spark introduces RDDs, (resilient distributed dataset). See our solution below, to get an idea.
package com.olric.samplePackage01

import org.apache.spark._
import org.apache.spark.rdd.RDD


object top10Movies extends App {

  val sc = new SparkContext("local[*]", "WordCount")


  val moviesFile = sc.textFile("hdfs://dikanka:8020/user/oguz/MovieData/u.item")
  val movies: RDD[(Int, String)] = moviesFile.map {
    line =>
      val col = line.split('|')
      (col(0).toInt, col(1))
  }.sortByKey()


  val ratingsFile = sc.textFile("hdfs://dikanka:8020/user/oguz/MovieData/u.data")
  val ratings: RDD[(Int, Int)] = ratingsFile.map {
    line =>
      val col = line.split("\t")
      (col(1).toInt, col(2).toInt)
  }

  val ratingsPerMovieId = ratings.mapValues(x => (x,1)).reduceByKey((x,y) => (x._1 + y._1, x._2 + y._2)).filter(x => x._2._2 >= 100)
  val avgRatings=ratingsPerMovieId.map(x => (x._1, (x._2._1 / x._2._2.toFloat)))
  val joinedDataset=avgRatings.join(movies)
  joinedDataset.sortBy(_._2, false).take(10).foreach(println)
}
So, we read the movies file from Hadoop, and populate an RDD named movies. We do the same for ratings. Movies RDD contains movie id and movie title, whereas ratings RDD has movie id and rating. Up to now it's simple.
The line where ratingsPerMovieId is populated might be bit complex for those who are not familiar. We begin with ratings RDD. Each row here is a list of two values :
(movieId, rating)
The expression:
x => (x,1)
is a shortcut to write a function. It is actually a function which takes x as a parameter, and returns (x, 1) value list as a return value. X, here, represents the line read from input, ratings RDD.
Therefore, output of mapvalue is as follows:
(movieID, (rating, 1))
Then we use reduceByKey, which needs to know how to reduce multiple rows with the same key value. X and y represents two rows with same key value, and we give the following function to reduceByKey, so that it knows how to reduce these rows:
(x,y) => (x._1 + y._1, x._2 + y._2)
x._1 stands for the first value of input row x, which is the rating. Similarly, x._2 points to the second value, which is always one.
So, the first values and second values are summed up here, to find the total rating and count of ratings, per movie id.
Then we use another function,
x => x._2._2 >= 100
to filter our data set.
x._2 is an (Int, Int) list which holds our Rating Total and Rating Counts.
x._2._2 is an Int value for the rating count. So this function will get rid of the moves with less than 100 ratings.
The rest of the code is easier. We join two RDD's, sort the result based on ratings, take first 10 rows and list them.
10. MongoDB

This post could be incomplete without a NoSQL database. So here is mongodb, a document-oriented NoSQL database from 2009.
MongoDB stores data as JSON documents. So I'll upload my CSV files now as collection of documents. First, let's create our database, using mongodb command-line interface.
> use olric

switched to db olric
The use command creates the database if it doesn't already exist. So now, we have a database.
Now let's get back to BASH, and use mongoimport utility to upload our CSV files.
oguz@dikanka:~/moviedata$ cat /home/oguz/moviedata/u.data | mongoimport --db olric --collection "ratings" --drop --type tsv --fields userId,movieId,rating,ratingTime --host "127.0.0.1:27017"

2019-10-09T16:24:24.477+0200    connected to: 127.0.0.1:27017
2019-10-09T16:24:24.478+0200    dropping: olric.ratings
2019-10-09T16:24:25.294+0200    imported 100000 documents

oguz@dikanka:~/moviedata$ cut -d"|" -f 1,2 /home/oguz/moviedata/u.item | tr "|" "\t" | mongoimport --db olric --collection "movies" --drop --type tsv --fields movieId,movieTitle --host "127.0.0.1:27017"

2019-10-09T16:26:00.812+0200    connected to: 127.0.0.1:27017
2019-10-09T16:26:00.812+0200    dropping: olric.movies
2019-10-09T16:26:01.118+0200    imported 1682 documents
TSV stands for tab-delimited CSV files. Since u.item was pipe delimited, I use tr to convert it to a tab delimited format, and cut to fetch only the first two columns.
Back inside mongodb console, to confrm the uploads.
> use olric

switched to db olric

> db.ratings.find()

{ "_id" : ObjectId("5d9ded98c233e200b842a850"), "userId" : 253, "movieId" : 465, "rating" : 5, "ratingTime" : 891628467 }
{ "_id" : ObjectId("5d9ded98c233e200b842a851"), "userId" : 305, "movieId" : 451, "rating" : 3, "ratingTime" : 886324817 }
...

> db.movies.find()

{ "_id" : ObjectId("5d9dedf8c233e200b8442f66"), "movieId" : 7, "movieTitle" : "Twelve Monkeys (1995)" }
{ "_id" : ObjectId("5d9dedf8c233e200b8442f67"), "movieId" : 8, "movieTitle" : "Babe (1995)" }
{ "_id" : ObjectId("5d9dedf8c233e200b8442f68"), "movieId" : 9, "movieTitle" : "Dead Man Walking (1995)" }

...
And here is the mongodb solution to our challenge:
> db.ratings.aggregate([{$group: {_id: "$movieId", avgRating: {$avg : "$rating"}, count: {$sum : 1} }}, {$match : {count : {$gte : 100}}}, {$sort : {avgRating : -1}}, {$limit : 10}, {$lookup : {from: "movies", localField: "_id", foreignField: "movieId", as: "movieDef"}}, {$unwind : "$movieDef"}]).forEach(function(output) {print(output._id + "\t" + output.avgRating + "\t" + output.movieDef.movieTitle) })You may get lost with all the brackets used here.
We use the method aggregate on our collection named ratings. Aggregate is a collection method of mongodb; it accepts several pipeline stages, as a list, such as $group, $match, $sort, $limit, $lookup and $unwind.
You can see these are the ones I used. Stage $group grouped the collection of documents by movieID and adds a couple of computed fields into these documents. These are named avgRating and count.
Stage $match filters the documents out, which have count less than 100.
Guess what stage $sort and $limit do? Ok, I'll skip these ones.
$lookup does a lookup to another collection matching our _id with the field movieId from the lookup data. It brings us the entire matched row into an array named movieDef.
$unwind gets rid of this array, and each field from the lookup field becomes a separate field in our collection of documents.
forEach loops through the documents, now only 10, and sorted by rating. We use function(output) to print the results.
It was a long post, I know, but we covered ten different technologies, to prepare an aggregated report from two datasets.
I hope it helped to take a quick glance over these technologies.
Further Reading
Published at DZone with permission of Oguz Eren. See the original article here.
Opinions expressed by DZone contributors are their own.

Comments