A Hands-On Guide to OpenTelemetry: Linking Metrics to Traces With Exemplars, Part 2
This article concludes the two part series exploring how to link metrics to traces and make the most of telemetry data on your observability journey.
Join the DZone community and get the full member experience.
Join For FreeAre you ready to start your journey on the road to collecting telemetry data from your applications? Great observability begins with great instrumentation!
In this series, you'll explore how to adopt OpenTelemetry (OTel) and how to instrument an application to collect tracing telemetry. You'll learn how to leverage out-of-the-box automatic instrumentation tools and understand when it's necessary to explore more advanced manual instrumentation for your applications. By the end of this series, you'll have an understanding of how telemetry travels from your applications to the OpenTelemetry Collector, and be ready to bring OpenTelemetry to your future projects. Everything discussed here is supported by a hands-on, self-paced workshop authored by Paige Cruz.
The previous article explored the first part of how to link metrics to trace data using exemplars, where we configured our application to expose metrics and a Prometheus instance to collect those metrics. In this article, we'll look at the second part focused on implementing the exemplars and tying together metrics with our trace data.
It is assumed that you followed the previous articles in setting up both OpenTelemetry and the example Python application project, but if not, go back and see the previous articles as it's not covered here.
Prometheus Exemplar Configuration
Let's start by adding exemplars to our Prometheus metrics which is tying in our traces from OpenTelemetry. Open up the metrics/prometheus/prometheus.yml file, add or verify there is a scrape job defined for the hello-otel application as shown, and save the file:
global:
  scrape_interval: 5s

scrape_configs:

  - job_name: "prometheus"
    static_configs:
      - targets: ["localhost:9090"]

  - job_name: "hello-otel"
    static_configs:
      - targets: ["localhost:5000"]
Open up the metrics/prometheus/Buildfile-prom and ensure the CMD is using the exemplar storage feature by adding the flag as shown here in bold:
FROM prom/prometheus:v2.54.1

ADD prometheus.yml /etc/prometheus

ENTRYPOINT [ "prometheus" ]

CMD [ "--config.file=/etc/prometheus/prometheus.yml", "--enable-feature=exemplar-storage" ]
Using this configuration we can now rebuild our Prometheus instance with:
$ podman build -t workshop-prometheus:v2.54.1 -f ./metrics/prometheus/Build file-prom
Now let's explore how to add metrics to our example application.
Application Metrics
Open the metrics/app.py file and ensure the import for the Counter metric from Prometheus Client has been added as shown in bold:
import random
import re
import urllib3

import requests
from flask import Flask, render_template, request
from breeds import breeds

from opentelemetry.trace import set_tracer_provider
from opentelemetry.sdk.trace import TracerProvider
from opentelemetry.sdk.trace.export import SimpleSpanProcessor
from opentelemetry.exporter.otlp.proto.http.trace_exporter import OTLPSpanExporter

from opentelemetry.instrumentation.flask import FlaskInstrumentor
from opentelemetry.instrumentation.jinja2 import Jinja2Instrumentor
from opentelemetry.instrumentation.requests import RequestsInstrumentor
from prometheus_flask_exporter import PrometheusMetrics
from prometheus_client import Counter
...
In this same application file, further down, ensure that a hits counter for the number of homepage loads is added as shown in bold:
...
provider = TracerProvider()
processor = SimpleSpanProcessor(OTLPSpanExporter(endpoint="http://localhost:4318/v1/traces"))
provider.add_span_processor(processor)

set_tracer_provider(provider)

app = Flask("hello-otel")
FlaskInstrumentor().instrument_app(app)
Jinja2Instrumentor().instrument()
RequestsInstrumentor().instrument()
metrics = PrometheusMetrics(app)

HITS_COUNTER = Counter('hits_counter', 'count of homepage loads')
...
Lastly in the application file, ensure code is added to the index() to increment (increase) the hits_counter and configure exemplars to attach to the metric as shown in bold. Save the file when done:
...
@app.route('/')
def index():
  global HITS
  span = trace.get_current_span()
  trace_id = '{:032x}'.format(span.get_span_context().trace_id)
  HITS = HITS + 1
  span.set_attribute("hits", HITS)
  HITS_COUNTER.inc(1, exemplar={"trace_id": trace_id, "trace_url": f"http://localhost:16686/trace/{trace_id}"})
  msg = f'This webpage has been viewed {HITS} times'
  return msg
...
Now we need to update our application container image by adding the command to install prometheus_flask_exporter to the file metrics/Buildfile-metrics as shown in bold:
FROM python:3.12-bullseye

WORKDIR /app

COPY requirements.txt requirements.txt

RUN pip install -r requirements.txt

RUN pip install opentelemetry-api \
    opentelemetry-sdk \
    opentelemetry-exporter-otlp \
    opentelemetry-instrumentation-flask \
    opentelemetry-instrumentation-jinja2 \
    opentelemetry-instrumentation-requests \
    prometheus-flask-exporter

COPY . .

CMD [ "flask", "run", "--host=0.0.0.0"]
Rebuild the application image as follows:
$ podman build -t hello-otel:metrics -f metrics/Buildfile-metrics

...
Successfully tagged localhost/hello-otel:metrics
81039de9e73baf0c2ee04d75f7c4ed0361cd97cf927f46020e295a30ec34af8f
Now we need to verify that this all works.
Verifying Exemplars
Now to verify our exemplars, we run a pod configuration with our example application, a Prometheus instance, and the Jaeger tooling to visualize our telemetry data as follows:
$ podman play kube metrics/app_pod.yaml
Once this has started, we can open a browser and make several requests (over time, refresh the browser to generate more in the resulting graph on the next slide) to the homepage to generate metrics and traces at http://localhost:8001.
Open the Prometheus console in your browser http://localhost:9090 and query hits_counter_total in Graph view. Select by clicking on the Show Exemplars button in the middle to see them as little blue diamonds (note you need to reduce the time window down to 5 minutes or so to see a graph plot):
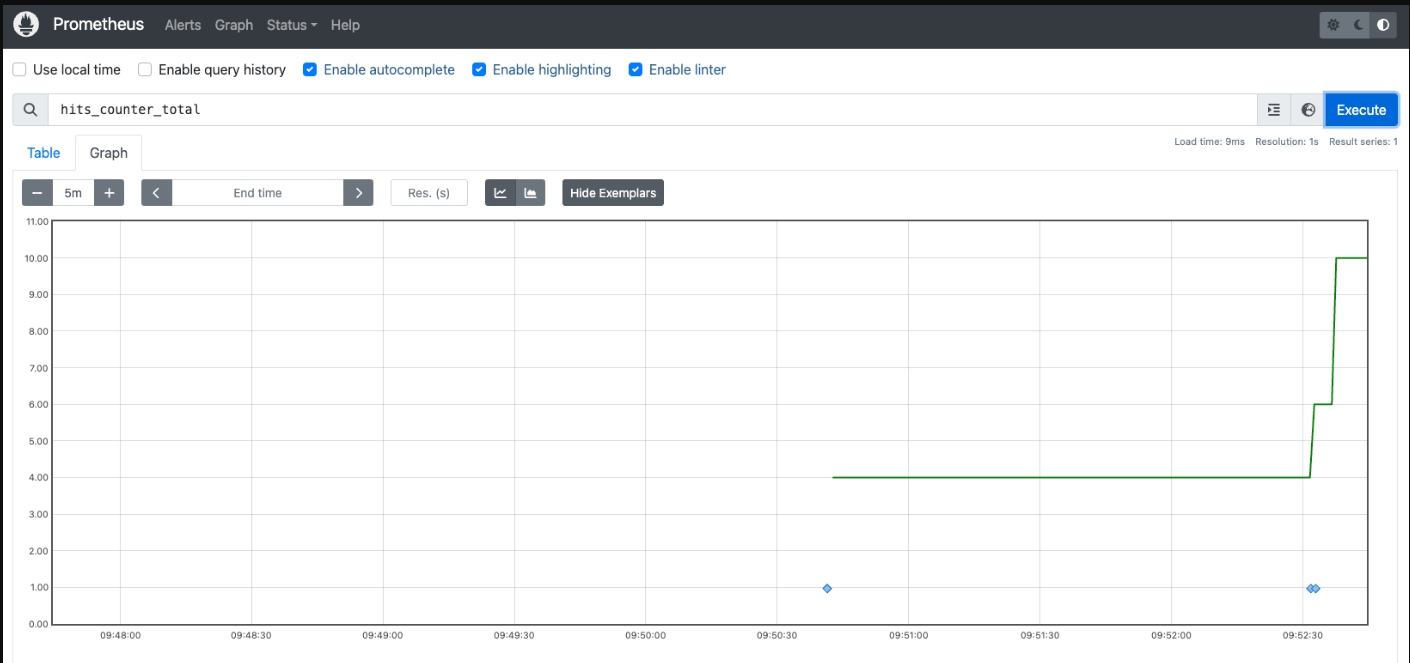
Click on one of the exemplars (any of the blue dots) on the chart and copy the trace_url into a new browser tab as shown:
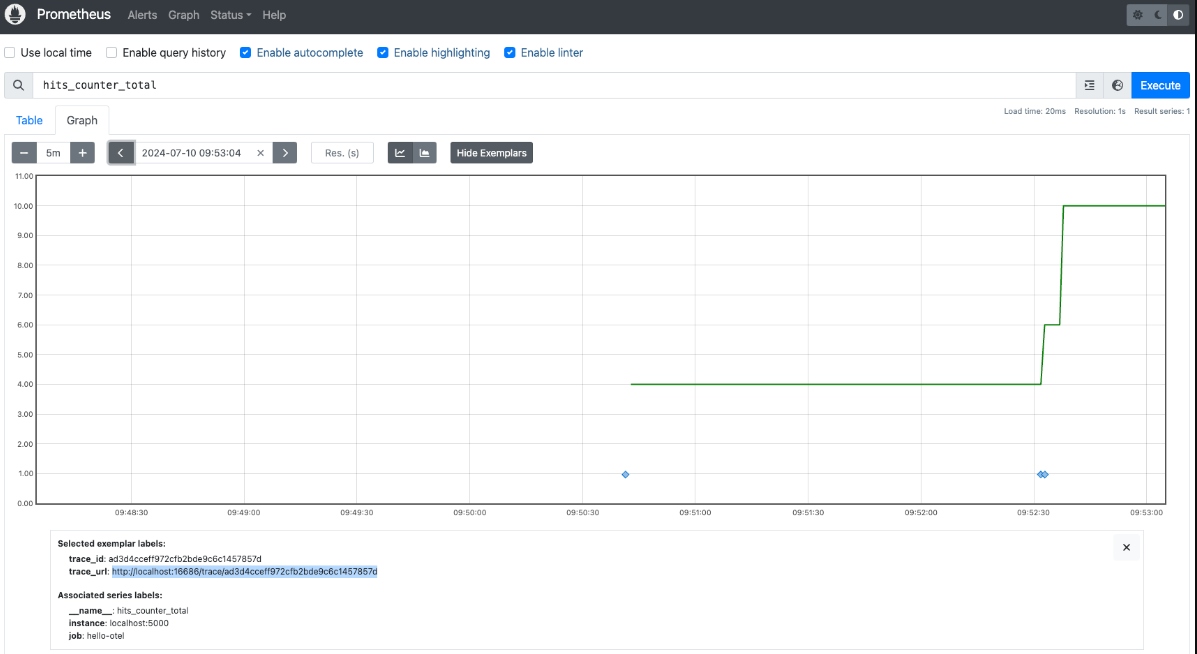
If all is working as we expect it to, then we should see the trace waterfall for one of the requests made something like this:

This verifies that we are linking our application metrics to our application traces with exemplars. To be neat about things, we should shut down our pod and running containers as follows:
$ podman play kube metrics/app_pod.yaml --down
These examples use code from a Python application that you can explore in the provided hands-on workshop.
What's Next?
This article, part two, concludes the journey to linking metrics to our trace data with exemplars using Prometheus and OpenTelemetry with our example application.
Stay tuned for more hands-on material to help you with your cloud-native observability journey.
Published at DZone with permission of Eric D. Schabell. See the original article here.
Opinions expressed by DZone contributors are their own.
Comments