A Hands-On Guide to OpenTelemetry: Linking Metrics to Traces With Exemplars, Part 1
This article continues the series by exploring how to link metrics to traces and make the most of telemetry data on your observability journey.
Join the DZone community and get the full member experience.
Join For FreeAre you ready to start your journey on the road to collecting telemetry data from your applications? Great observability begins with great instrumentation!
In this series, you'll explore how to adopt OpenTelemetry (OTel) and how to instrument an application to collect tracing telemetry. You'll learn how to leverage out-of-the-box automatic instrumentation tools and understand when it's necessary to explore more advanced manual instrumentation for your applications. By the end of this series, you'll have an understanding of how telemetry travels from your applications to the OpenTelemetry Collector, and be ready to bring OpenTelemetry to your future projects. Everything discussed here is supported by a hands-on, self-paced workshop authored by Paige Cruz.
The previous article explored how developers are able to manually instrument their applications to generate specific metadata for our business to derive better insights faster. In this article, we'll look at the first part of how to link metrics to trace data using exemplars.
It is assumed that you followed the previous articles in setting up both OpenTelemetry and the example Python application project, but if not, go back and see the previous articles as it's not covered here.
Before we dive into linking our metrics to traces with exemplars, let's look at what exactly an exemplar is.
Exemplar Basics
As defined by Google Cloud Observability:
"Exemplars are a way to associate arbitrary data with metric data. You can use them to attach non-metric data to measurements. One use of exemplars is to associate trace data with metric data."
Remember, we use trace data to give a detailed view of a single request through our systems and metrics are used to provide an aggregated systems view. Exemplars are a way to combine the two, such that once you narrow your troubleshooting efforts to a single trace, you can then explore the associated metrics that the exemplar provides. This also works from metrics to traces, for example, allowing you to jump from, "Hey, what's that weird spike?" on a metric chart directly to a trace associated with that context in a single click.
Our goal is tying metrics to traces via exemplars, so using the CNCF open-source projects, we'll instrument metrics with Prometheus, which has stable APIs and an extensive ecosystem of instrumented libraries. While OpenTelemetry also provides a metrics SDK, it's marked as mixed and under active development. The Python SDK does not yet support exemplars, so let's keep our traces instrumented with OpenTelemetry.
The plan we will follow in Part One is to first configure a Prometheus instance to gather metrics from our example application, second to instrument our example application to collect metrics, and verifying that this is collecting metrics.
In Part Two, we'll then implement an exemplar connecting these metrics to existing trace data we've been collecting from our example application, and finally, verify all this work in Jaeger tooling.
Prometheus Configuration
Within the example Python application we've previously installed, we find a configuration file for Prometheus in metrics/prometheus/prometheus.yml that looks like this:
global:
  scrape_interval: 5s

scrape_configs:

  - job_name: "prometheus"
    static_configs:
      - targets: ["localhost:9090"]

  - job_name: "hello-otel"
    static_configs:
      - targets: ["localhost:5000"]
The default use of Prometheus is to monitor targets over HTTP and scrape their endpoints. Our initial configuration is scraping Prometheus itself as the target with the endpoint localhost:9090 and looking for hello-intel as a target on the endpoint localhost:5000.
Using this configuration we can now build and start our Prometheus instance with:
$ podman build -t workshop-prometheus:v2.54.1 -f ./metrics/prometheus/Buildfile-prom

$ podman run -p 9090:9090 workshop-prometheus:v2.54.1 --config.file=/etc/prometheus/prometheus.yml
We can verify our targets are configured correctly by opening the Prometheus console Targets page at http://localhost:9090/targets, noting that Prometheus is scraping itself and waiting for the hello-otel application to come online:
For now, stop the Prometheus instance by using CTRL-C as we'll later be running the application and Prometheus instance together in a single pod.
Collecting Metrics
The next step is to start collecting metrics from our Python example application. To do this we can explore the prometheus-flask-exporter that provides an easy getting started experience.
We start by opening the build file metrics/Buildfile-metrics and adding the command to install the prometheus_flask_exporter as shown here in bold:
FROM python:3.12-bullseye

WORKDIR /app

COPY requirements.txt requirements.txt

RUN pip install -r requirements.txt

RUN pip install opentelemetry-api \
    opentelemetry-sdk \
    opentelemetry-exporter-otlp \
    opentelemetry-instrumentation-flask \
    opentelemetry-instrumentation-jinja2 \
    opentelemetry-instrumentation-requests \
    prometheus-flask-exporter

COPY . .

CMD [ "flask", "run", "--host=0.0.0.0"]
Now to start using it in our example application we open the file metrics/app.py and add the prometheus-flask-exporter and specify import specifically PrometheusMetrics as shown in bold below:
...
from opentelemetry.trace import set_tracer_provider
from opentelemetry.sdk.trace import TracerProvider
from opentelemetry.sdk.trace.export import SimpleSpanProcessor
from opentelemetry.exporter.otlp.proto.http.trace_exporter import OTLPSpanExporter

from opentelemetry.instrumentation.flask import FlaskInstrumentor
from opentelemetry.instrumentation.jinja2 import Jinja2Instrumentor
from opentelemetry.instrumentation.requests import RequestsInstrumentor
from prometheus_flask_exporter import PrometheusMetrics
...
Search further down this same file, metrics/app.py, and verify that the programmatic Flask metric instrumentation has been added as shown in bold here:
...
provider = TracerProvider()
processor = SimpleSpanProcessor(OTLPSpanExporter(endpoint="http://localhost:4318/v1/traces"))
provider.add_span_processor(processor)

set_tracer_provider(provider)

app = Flask("hello-otel")
FlaskInstrumentor().instrument_app(app)
Jinja2Instrumentor().instrument()
RequestsInstrumentor().instrument()
metrics = PrometheusMetrics(app)
...
Now that we have it all configured, let's try it out.
Verifying Metrics to Traces
We need to start verification by (re)building the application image as follows:
$ podman build -t hello-otel:metrics -f metrics/Buildfile-metrics

...
Successfully tagged localhost/hello-otel:metrics
81039de9e73baf0c2ee04d75f7c4ed0361cd97cf927f46020e295a30ec34af8f
Now to run this, we are using a pod configuration with our example application, a Prometheus instance, and the Jaeger tooling to visualize our telemetry data as follows:
$ podman play kube metrics/app_pod.yaml --down
Once this has started, we can open a browser and make several requests to each of the pages listed here below to generate metrics and tracing data:
- http://localhost:8001
- http://localhost:8001/rolldice
- http://localhost:8001/doggo
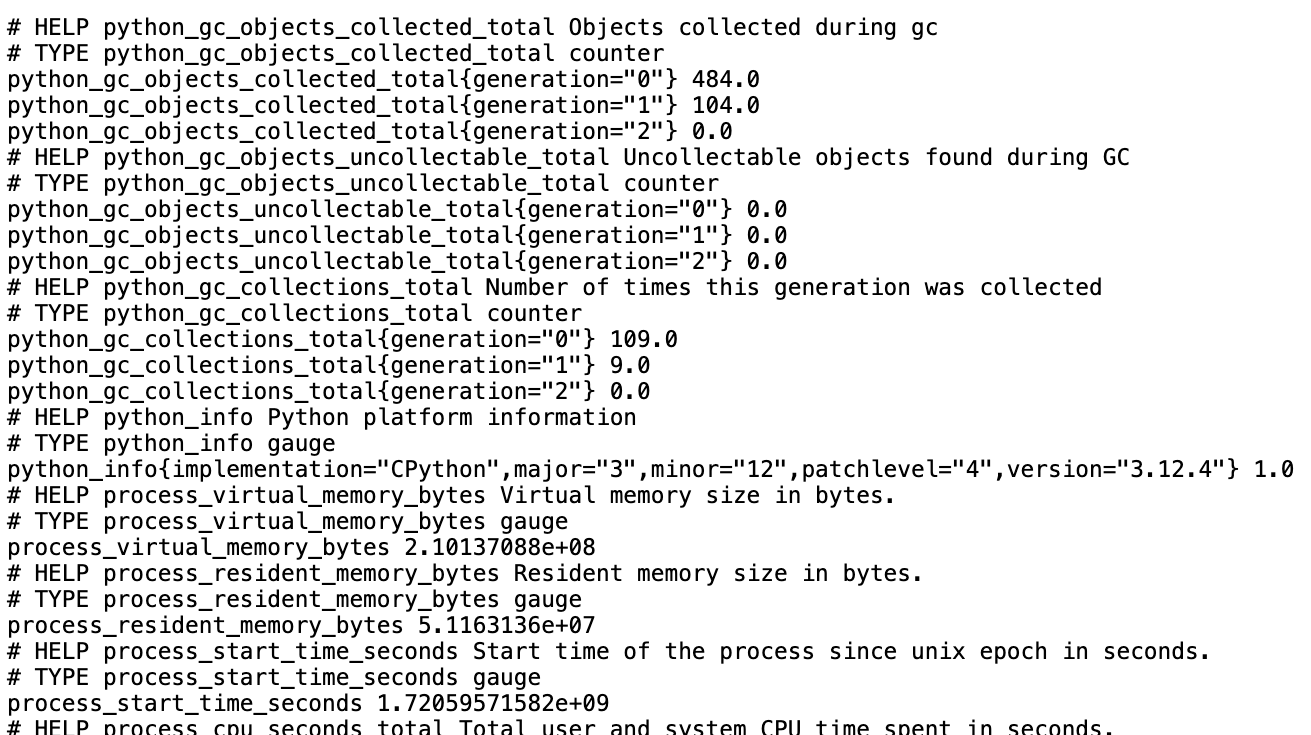
I mentioned previously that Prometheus uses a pull-model where a Prometheus server scrapes a /metric endpoint. Let's check our example application's metric endpoint to verify that the prometheus-flask-exporter is working by opening http://localhost:8001/metrics in a browser and confirming we're seeing metrics prefixed with flask_* and python_* as follows:
Now when we check if the hello-otel application is available to be scrapped by Prometheus by opening the targets page in Prometheus at http://localhost:9090/targets, we see that both Prometheus and the example application are in the state of UP (it was DOWN, previously):

This concludes Part One. These examples use code from a Python application that you can explore in the provided hands-on workshop.
What's Next?
This article, part one of two, started the journey to linking metrics to our trace data with exemplars using Prometheus and OpenTelemetry with our example application.
In our next article, part two, we'll finish our journey by implementing an exemplar to link these collected metrics to their relevant traces.
Published at DZone with permission of Eric D. Schabell. See the original article here.
Opinions expressed by DZone contributors are their own.
Comments