Apollo Router Performance Monitoring with OpenTelemetry and Splunk APM
The Apollo router is quickly becoming a popular choice among developers seeking a reliable and efficient routing solution.
Join the DZone community and get the full member experience.
Join For FreeThe Apollo router is a powerful routing solution designed to replace the GraphQL Gateway. Built using Rust, it offers a high degree of flexibility, loose coupling, and exceptional performance. This self-hosted graph routing solution is highly configurable, making it an ideal choice for developers who require a high-performance routing system. With its ability to handle large amounts of traffic and complex data, the Apollo router is quickly becoming a popular choice among developers seeking a reliable and efficient routing solution.
The binary implementation of the Apollo router comes equipped with a built-in telemetry plugin that functions as an OpenTelemetry collector agent. This plugin is responsible for sending traces and logs to the appropriate endpoints, making it an essential component of the performance monitoring process. By leveraging the capabilities of the telemetry plugin, developers can gain valuable insights into the performance of their applications, identify bottlenecks and optimize their system accordingly. With this integrated telemetry functionality, the Apollo router provides a streamlined and efficient performance monitoring solution.
OpenTelemetry Agent and Collector
OpenTelemetry offers an agent or router telemetry plugin that collects telemetry data from a host, including metrics and traces. This agent runs on a host machine and provides a centralized reporting system, which is particularly useful when running multiple instances of the router. The collector enables developers to process and send metrics to multiple locations beyond their APM tool, providing flexibility and versatility in performance monitoring. By leveraging the OpenTelemetry agent, developers can gain valuable insights into the performance of their applications, identify bottlenecks, and optimize their system for better performance.
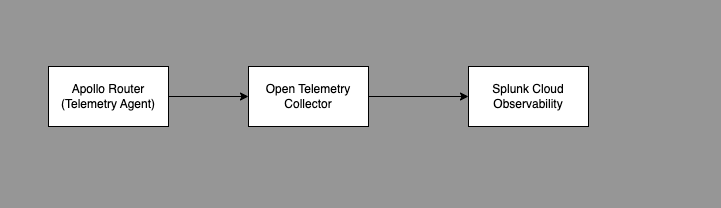
After the router telemetry agent collects telemetry data from the host, it then forwards that data to a collector. The collector is another program that receives and processes the telemetry data, making it easier to analyze and understand. By sending data to the collector, developers can gain a more comprehensive view of their application's performance, which can help them identify potential issues and optimize their system for better performance. The use of a collector also enables developers to store data in a centralized location, making it easier to access and analyze.
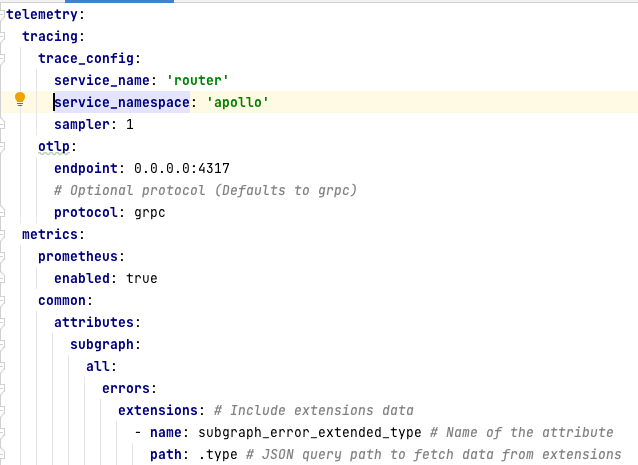
Telemetry plugin configuration for Apollo Router Agent:
Open Telemetry Collector Configuration:

Splunk APM (Application Performance Monitoring)
Splunk APM is a highly sophisticated tool designed for application performance monitoring and troubleshooting, especially for cloud-native and microservices-based applications. It is built on open source and OpenTelemetry instrumentation, which enables the collection of data from various programming languages and environments. With its advanced features, Splunk APM provides an efficient and reliable solution for monitoring application performance and identifying and resolving issues quickly.
The OpenTelemetry Collector is a tool used to export data to your Application Performance Monitoring (APM) tool. To set up a basic configuration for the OpenTelemetry Collector, you need to have both an OpenTelemetry Protocol (OTLP) receiver for the router and an exporter to forward the data to your APM tool. By using the OTLP receiver and exporter, you can easily configure the OpenTelemetry Collector to collect and transmit data from various sources to your APM tool, making it an essential component for effective application monitoring and troubleshooting.
In conclusion, telemetry plays a crucial role in performance monitoring and optimization. The Apollo router comes with a built-in telemetry plugin that functions as an OpenTelemetry collector agent, which allows developers to gain valuable insights into their application's performance. OpenTelemetry also offers an agent and collector for collecting telemetry data from a host and sending it to a centralized reporting system. Additionally, the OpenTelemetry Collector is an essential tool for exporting data to an APM tool, such as Splunk APM, which provides a sophisticated solution for monitoring application performance and identifying and resolving issues quickly. By leveraging these tools, developers can optimize their system's performance, enhance user experience, and ultimately achieve their business objectives.
Opinions expressed by DZone contributors are their own.
Comments