DZone
Thanks for visiting DZone today,
Edit Profile
  • Manage Email Subscriptions
  • How to Post to DZone
  • Article Submission Guidelines
Sign Out View Profile
  • Post an Article
  • Manage My Drafts
Over 2 million developers have joined DZone.
Log In / Join
Please enter at least three characters to search
Refcards Trend Reports
Events Video Library
Refcards
Trend Reports

Events

View Events Video Library

Zones

Culture and Methodologies Agile Career Development Methodologies Team Management
Data Engineering AI/ML Big Data Data Databases IoT
Software Design and Architecture Cloud Architecture Containers Integration Microservices Performance Security
Coding Frameworks Java JavaScript Languages Tools
Testing, Deployment, and Maintenance Deployment DevOps and CI/CD Maintenance Monitoring and Observability Testing, Tools, and Frameworks
Culture and Methodologies
Agile Career Development Methodologies Team Management
Data Engineering
AI/ML Big Data Data Databases IoT
Software Design and Architecture
Cloud Architecture Containers Integration Microservices Performance Security
Coding
Frameworks Java JavaScript Languages Tools
Testing, Deployment, and Maintenance
Deployment DevOps and CI/CD Maintenance Monitoring and Observability Testing, Tools, and Frameworks

Modernize your data layer. Learn how to design cloud-native database architectures to meet the evolving demands of AI and GenAI workkloads.

Secure your stack and shape the future! Help dev teams across the globe navigate their software supply chain security challenges.

Releasing software shouldn't be stressful or risky. Learn how to leverage progressive delivery techniques to ensure safer deployments.

Avoid machine learning mistakes and boost model performance! Discover key ML patterns, anti-patterns, data strategies, and more.

  1. DZone
  2. Refcards
  3. Getting Started With OpenTelemetry
refcard cover
Refcard #368

Getting Started With OpenTelemetry

Observability and Monitoring for Modern Applications

With the growing number of mass migrations to the cloud, OpenTelemetry solves new challenges by simplifying and reducing time spent on data collection through automation. OpenTelemetry is an open-source collection of tools, APIs, SDKs, and specifications with the purpose of standardizing how to model and collect telemetry data. OpenTelemetry has been proven to enable effective observability and it aims to become a standard of observability implementation.

In this Refcard, we introduce core OpenTelemetry architecture components, key concepts and features, and how to set up for tracing and exporting telemetry data.

Download Refcard
Free PDF for Easy Reference
refcard cover

Written By

author avatar Joana Carvalho
Observability and Monitoring Specialist, Sage
Table of Contents
► Introduction ► Overview of OpenTelemetry ► OpenTelemetry Architecture ► OpenTelemetry Key Concepts ► Getting Started With OpenTelemetry ► Conclusion
Section 1

Introduction

The mass migration to the cloud brings new architecture paradigms and challenges. The many components involved make monitoring and correlating signals from all elements difficult. OpenTelemetry comes to aid with a vendor-agnostic telemetry specification that allows developers in any stack to gather telemetry data. OpenTelemetry aims to be the standard for implementing and enabling effective observability.

This Refcard introduces its core architecture components, key concepts and features, and how to set them up for tracing and exporting telemetry data. 

Section 2

Overview of OpenTelemetry

Observability, or "o11y" for friends, empowers teams to ask questions about their system and business and receive clear answers driven by the signals collected. Telemetry signals — logs, metrics, traces, events, and metadata — work together to correlate individual systems' health with the business' overall health, giving developers and operations teams a greater understanding. A common misconception is that observability replaces monitoring; quite the contrary — observability amplifies its potential.

  • Monitoring is a process that collects and analyzes telemetry data for specific metrics and acts according to the objectives defined (e.g., alerts, notifies).
  • Observability is the ability to ask questions about the holistic state of a system through the signals it generates. 

Monitoring takes you a long way, but if the telemetry is ineffective, insufficient, or inaccurate, it will not take you to the level you want — observability. 

In 2016, OpenTracing became a Cloud Native Computing Foundation (CNCF) project, and in 2018, Google open sourced OpenCensus. These standards complemented each other, aiming to make observability easy and widely adopted. However, having the community divided to maintain both projects would lead to poor adoption, contribution, and support. To avoid this, in 2019, it was announced that both projects would converge into OpenTelemetry and join the CNCF.

OpenTelemetry (OTel) quickly became the de facto standard for flexible full-stack observability in cloud-native applications. Its vendor-neutral standards, libraries, integrations, APIs, and software development kits (SDKs) give developers an independent specification for telemetry. As with any open-source software, the maturity level of each component will depend on the language and the interest taken by that particular community — the more popular the language or the framework, the more support and maturity it'll reach. 

Section 3

OpenTelemetry Architecture

OpenTelemetry provides a library framework that receives, processes, and exports telemetry, which requires a back end to receive and store the data. In the following diagram, you can see how all elements work together, and we'll go into more detail about each one.

Figure 1: OpenTelemetry pipeline

Source: Schema based on "OpenTelemetry: beyond getting started"

APIs and SDKs

OpenTelemetry APIs define how applications speak to one another and are used to instrument an application or service. They are generally available for developers to use across popular programming languages (e.g., Ruby, Java, Python). Because they are part of the OpenTelemetry standard, they will work with any OpenTelemetry-compatible back-end system, eliminating the need to re-instrument in the future. The SDK is also language specific, providing the bridge between APIs and the exporter. It can sample traces and aggregate metrics.

Collector

The OpenTelemetry Collector is like a bakery: Regardless of how the raw ingredients are processed, you can still shape your bread in whatever way you fancy. This means you don't need to alter your code to send data into whatever back end you use for storage and visualization. 

Figure 2: Inside the OTel Collector pipeline

The Collector's job is to process, filter, aggregate, and batch telemetry, giving developers greater flexibility for receiving, shaping, and sending data to multiple back ends. It works with two primary deployment models:

  • As an Agent that lives within the application or in the same host as the application, acting as a source of data for the host (by default, OpenTelemetry assumes a local collector is available)
  • As a Gateway working as a data pipeline that receives, exports, and processes telemetry

Figure 3: Collector Agent and Gateway setup

The Collector consists of three components: receivers, processors, and exporters.

Receivers (e.g., Jaeger, Prometheus) are in charge of pushing or pulling the applications' signals by listening for calls on particular ports on the Collector. They work with both gRPC and HTTP protocols. A complete list of receivers for specific scenarios or frameworks can be found on GitHub.

Processors sit between receivers and exporters; they enable us to shape the data by filtering, formatting, and enriching it before it goes through the exporter to a back end. Common use cases include data sanitization to remove sensitive or private information, exporting metrics from spans, or deciding which signals are saved to the back end. There are many supported processors available, or you can develop your own. They work sequentially, so the configuration order is important. Although processors are not required, some might be recommended based on the data source.

Exporters can push or pull data into one or multiple configured back ends or destinations (e.g., Kafka, OTLP). They work by transforming the data into a different format if needed and sending it to the endpoint defined. An exporter creates a layer of separation between instrumentation and the back-end configuration so users can switch back ends without re-instrumenting the code. It supports either the HTTP or gRPC protocol. Popular exporters include Jaeger, Prometheus, and Zipkin, along with a vast list of other options. 

To configure the three Collector components, we must specify the parts that will compose our pipeline. We can do so by writing the configuration in a YAML format and stating what elements will be configured in the Collector using the service section, as shown in the example below:

 
1
# otel-collector-config.yml
2
receivers:
3
 otlp:
4
   protocols:
5
     http:
6
       endpoint: 0.0.0.0:4318
7
     grpc:
8
       endpoint: 0.0.0.0:4317
9
processors:
10
 batch:
11
   timeout: 1s
12
exporters:
13
 logging:
14
   loglevel: info
15
 extensions:
16
 health_check:
17
 pprof:
18
   endpoint: :1888
19
 zpages:
20
   endpoint: :55679
21
service:
22
 extensions: [pprof, zpages, health_check]
23
 pipelines:
24
   traces:
25
     receivers: [otlp]
26
     processors: [batch]
27
     exporters: [logging]


As you can see on the configuration file above, we set the OTLP receiver to add HTTP and gRPC endpoints in the collector. To process our data, we use a batch processor that will compress and segment it; it's configurable for batching by time and size. Using the batch processor is highly recommended, as it reduces the number of outgoing connections. We also define two exporters: logging that will print into the console and Jaeger, where we'll send the traces. The service section is where we set up how all the previous elements come together in the pipeline.

We only refer to traces in this example, but we could also have metrics or logs.

OpenTelemetry Protocol 

The OpenTelemetry Protocol (OTLP) is one of the reasons for OpenTelemetry's success. It's an agnostic protocol specification that defines the encoding for data and the transport protocol for sending traces, metrics, and logs. It can send data from the SDK to the Collector and from the Collector to the chosen back end. Using the Collector elements, we can abstract from third-party frameworks by configuring the proper receiver. 

Section 4

OpenTelemetry Key Concepts

All observability journeys must begin with instrumenting an application to emit signals from services as they execute. OpenTelemetry gives you several components that'll help you add proper instrumentation to services and have each operation execution result in one or multiple spans, metrics, or logs. 

Instrumentation 

There are mainly two ways to instrument applications using OpenTelemetry: manual and auto-instrumentation. These become available by adding the OpenTelemetry SDK to your project. Auto-instrumentation makes it possible to collect application-level telemetry without manual changes to the code — it allows tracing a transaction's path as it navigates different components, including:

  • Application frameworks
  • Communication protocols
  • Data stores

Manual instrumentation lets you decide how and where to add observability code to your project. Four instrumentation libraries are available:

  • Core contains all language instrumentation libraries available.
  • Instrumentation adds to the Core library by adding extra language-specific capabilities.
  • Contrib includes additional helpful libraries and standalone utilities that don't fit the scope of the previous two.
  • Distribution adds vendor-specific customization.

Not all languages will separate their instrumentation libraries as above. Some can live within the same repository, while others are split into additional ones.

Languages and Support Status 

OpenTelemetry is a collection of tools, APIs, and SDKs available in multiple languages. Several dedicated groups are working to maintain all these components and their language implementations. Some are dedicated to a vertical, working on signals, while others support the implementations and extensions for languages. Development speed depends on multiple factors like team size and availability, which lead to projects being in various stages of maturity — Draft, Experimental, Stable, and Deprecated. Stable means a project is production-ready and is receiving long-term support.

The following table shows the current maturity status of OpenTelemetry elements for some of the languages it supports:

Table 1: OpenTelemetry code instrumentation state

Language Tracing Metrics Logging
Java Stable Stable Experimental
.NET Stable Stable ILogger: Stable
OTLP log exporter: Experimental
Go Stable Experimental Not yet implemented
JS Stable Development Roadmap
Python Stable Experimental Experimental

Telemetry Sources 

Telemetry data, or signals, are any output collected from the system, and when analyzed together, this output provides a view of the relationships and dependencies of the distributed system. Currently, OpenTelemetry supports three categories of telemetry: logs, traces, and metrics. Hopefully, it will extend support for more signals, like profiling or user data. 

Metrics

A metric is a numerical representation of a value calculated or aggregated for a service captured at runtime (e.g., size of a message broker, number of errors per second, process memory utilization, error rate). The moment one of these measurements is captured is known as a metric event — it comprises not only the measurement but also the time of capture and associated metadata. Application and request metrics are essential indicators of availability and performance. The OpenTelemetry Metrics API processes the raw measurements, summarizing them to give developers visibility into their services' operational metrics. 

In the Metrics API, you have six available instruments that are associated with a specific meter at creation time. These can be synchronous or asynchronous; synchronous instruments are invoked inline with the application code execution, while asynchronous instruments allow the user to register a callback function responsible for reporting the measurements. In this diagram, you can see the operations that the instruments call, as well as the type of value that is captured: 

Figure 4: Metrics API available Instruments

Traces

A trace represents the flow of a single transaction or request as it goes through the system. They provide a holistic view of the chain of events triggered by requests and are defined by a tree of nested spans — one for each unit of work they represent and a parent span. In .NET, you might use the OTel Tracing API or the .NET System.Diagnostics.Activity API that is also supported. Be aware that in the .NET library, the terms used differ from the Tracing API. 

Figure 5: Representation of a trace with a tree of spans

To better understand the objects and actions you will add to your code, let's look at the main concepts that the OpenTelemetry SDK and API will implement for traces:

  • TracerProvider is a factory for Tracers; it's initialized once and lives for the duration of the application's lifecycle. It's the first step in tracing with OpenTelemetry. In some SDKs, a global Tracer Provider already exists (.NET).
  • Tracer creates spans containing supplementary information about what is happening for a given operation. It is created from Tracer Providers, and in some SDKs, a global Tracer already exists (Python, .NET).
  • Trace Exporter sends traces to a back end; it can be standard output like the OpenTelemetry Collector or any open-source or vendor back end of your choice.
  • Trace Context

This is an example of a trace with three spans; the information inside the spans is shown in the next section:

 
38
1
{
2
 "data": [
3
   {
4
     "traceID": "81289be65e00618d84366dfe2f7fc1a2",
5
     "spans": [
6
       {
7
         "traceID": "81289be65e00618d84366dfe2f7fc1a2",
8
         "spanID": "e03e8cca690f81c1",
9
         "operationName": "read_json_from_file",
10
       }
11
       // ...
12
       {
13
         "traceID": "81289be65e00618d84366dfe2f7fc1a2",
14
         "spanID": "75473187e1bc7579",
15
         "operationName": "word-by-language"
16
         // ...
17
       },
18
       {
19
         "traceID": "81289be65e00618d84366dfe2f7fc1a2",
20
         "spanID": "45c0d587ebdddf60",
21
         "operationName": "/words"
22
         // ...
23
       }
24
     ],
25
     "processes": {
26
       "p1": {
27
         "serviceName": "untranslatable-python",
28
         "tags": []
29
       }
30
     },
31
     "warnings": null
32
   }
33
 ],
34
 "total": 0,
35
 "limit": 0,
36
 "offset": 0,
37
 "errors": null
38
}

Spans

In OpenTelemetry, a span includes the following information:

  • Name
  • Start and End Timestamps
  • Span Context is an object that can't be changed after creation, containing:
    • Its own ID
    • Trace ID – a unique 16-byte array that identifies the trace that the span is part of, and all spans contained in that trace share this ID.
    • Trace Flags – present in all traces and, through binary encoded data, provide more details on the trace.
    • Trace State – a key-value list carrying vendor-specific trace information, so multiple tracing systems can participate in a trace.
  • Span Attributes are key-value pairs added to a span to help analyze the trace data. The extra information will help you better understand and search for specific traces.
  • Span Events are typically used to mark a singular point in time during the span's duration, similar to adding an annotation on a span.
  • Span Links associate one span with one or more, implying some relationship; they are optional but an excellent way of associating trace spans.
  • Span Status

Figure 6: Span lifecycle

To help you contextualize and add extra information about what happens during the work that's tracked by a span, OpenTelemetry provides Attributes and Span Events.

This is an example of a span with two events:

 
54
1
{
2
 "traceID": "81289be65e00618d84366dfe2f7fc1a2",
3
 "spanID": "e03e8cca690f81c1",
4
 "operationName": "read_json_from_file",
5
 "references": [
6
   {
7
     "refType": "CHILD_OF",
8
     "traceID": "81289be65e00618d84366dfe2f7fc1a2",
9
     "spanID": "75473187e1bc7579"
10
   }
11
 ],
12
 "startTime": 1659199980429164,
13
 "duration": 143,
14
 "tags": [
15
   {
16
     "key": "otel.library.name",
17
     "type": "string",
18
     "value": "data.file_reader"
19
   },
20
   {
21
     "key": "span.kind",
22
     "type": "string",
23
     "value": "internal"
24
   },
25
   {
26
     "key": "internal.span.format",
27
     "type": "string",
28
     "value": "proto"
29
   }
30
 ],
31
 "logs": [
32
   {
33
     "timestamp": 1659199980429173,
34
     "fields": [
35
       {
36
         "key": "event",
37
         "type": "string",
38
         "value": "Opening data file."
39
       }
40
     ]
41
   },
42
   {
43
     "timestamp": 1659199980429301,
44
     "fields": [
45
       {
46
         "key": "event",
47
         "type": "string",
48
         "value": "Finished reading data file."
49
       }
50
     ]
51
   }
52
 ],
53
 "processID": "p1"
54
}


In OpenTelemetry, the Tracer creates the spans. It's an object that tracks the currently active span while allowing you to create new spans. As spans start and complete, the Tracer dispatches them to the back end you configured on the Collector. 

Logs

A log is recorded as lines of text that describe a timestamped event and can be output in plain text, structured text (like JSON), or binary code. They result from a code execution block and are convenient for troubleshooting systems less prone to instrumentation (e.g., databases, load balancers). OpenTelemetry assumes that any data that doesn't belong to a trace or metric must be a log.

Baggage

As the name hints, Baggage refers to contextual information passed on between spans. It's represented in OpenTelemetry by a key-value store that lives in a Trace Context, making those values available to all spans created within that trace. OpenTelemetry uses Context Propagation to pass around Baggage and exists in all libraries, so you don't have to implement it yourself. Baggage is designed to be language agnostic so that it can travel through stacks. Transporting downstream values that are only available higher in the stack makes it easier to filter when searching in your back end.

Figure 7: Baggage passing between two services

Section 5

Getting Started With OpenTelemetry

Now, with more context about the main concepts, architecture, and components of OpenTelemetry, we are ready to start tracing. We will instrument two APIs; one will be built in .NET and the other in Python. They will be designed to have the same endpoints and the same purpose. It will return untranslatable words that exist only in one language at random or by language. In this diagram, you can follow each API's simple flows:

Figure 8: Untranslatable API flow chart

Different programming language paradigms present us with different challenges, so I've selected to show examples in two languages, Python and .NET — not to highlight the challenges but to demonstrate the consistency of OpenTelemetry across stacks. Please note that all .NET examples are for ASP.NET Core, and the configuration might differ for the .NET Framework.

Configuration

First, imagine that we already have a project created for whatever language we will use with the basic structure. You will install (Python) or add the necessary libraries (.NET) to your project by running the following commands. For Python, if using setuptools, you can add this library as an installation requirement.

Python:

 
1
1
$ pip install opentelemetry-distro


.NET:

 
​x
1
$ dotnet add package OpenTelemetry --prerelease
2
​
3
$ dotnet add package OpenTelemetry.Instrumentation.AspNetCore --prerelease
4
​
5
$ dotnet add package OpenTelemetry.Extensions.Hosting --prerelease


These commands will also add the SDK and API for OpenTelemetry as a dependency.

Collect Traces Using OpenTelemetry

In OTel, we can perform tracing operations on a Tracer. We can obtain it by using GetTracer() in the global Tracer Provider, returning an object that can be used for tracing operations. However, when using auto-instrumentation and depending on the language, that might not be necessary.

Add a Simple Trace With Automatic Instrumentation

Not all frameworks offer automatic instrumentation, but OpenTelemetry advises using it for those that do. Not only does it save lines of code, but it also provides a baseline for telemetry with little work. It works by attaching an agent to the running application and extracting tracing data. When considering auto-instrumentation, remember that it's not as flexible as manual instrumentation and only captures basic signals. 

Let us look at code implementations. Below, we have the basic setup for auto-instrumenting our API.

Python:

 
14
1
# app.py
2
from flask import Flask, Response
3
​
4
app = Flask(__name__)
5
​
6
@app.route("/")
7
@app.route("/home")
8
@app.route("/index")
9
def index():
10
   return Response("Welcome to Untranslatable!", status=200)
11
# Add more actions here
12
​
13
if __name__ == "__main__":
14
   app.run(debug=True, use_reloader=False)


.NET:

 
26
1
// Program.cs
2
using Microsoft.AspNetCore.Builder;
3
using Microsoft.Extensions.DependencyInjection;
4
using OpenTelemetry.Resources;
5
using OpenTelemetry.Trace;
6
​
7
var serviceName = "untranslatable-dotnet";
8
var serviceVersion = "1.0.0";
9
​
10
var builder = WebApplication.CreateBuilder(args);
11
var resource = ResourceBuilder.CreateDefault().AddService(serviceName);
12
​
13
builder.Services.AddOpenTelemetryTracing(tracerProviderBuilder =>
14
   tracerProviderBuilder
15
   .SetResourceBuilder(resource)
16
   .AddSource(serviceName)
17
   .SetResourceBuilder(
18
       ResourceBuilder.CreateDefault()
19
           .AddService(serviceName: serviceName, serviceVersion: serviceVersion))
20
   .AddAspNetCoreInstrumentation()
21
   .AddConsoleExporter()
22
).AddSingleton(TracerProvider.Default.GetTracer(serviceName));
23
​
24
var app = builder.Build();
25
​
26
//… Rest of the setup and actions here


In Python, we don't need to add anything to the code to extract basic metrics, but I'd recommend using the FlaskInstrumentor that adds flask-specific features support. You can add FlaskInstrumentor().instrument_app(app) after instantiating Flask and add extra configurations as needed. 

In .NET, we need to configure necessary OpenTelemetry settings as the exporter, instrumentation library, and constants. Like in Python, adding the OpenTelemetry.Instrumentation.AspNetCore package will provide extra features specific to the framework, adding to the base instrumentation library. The instrumentation library for ASP.NET Core will automatically create spans and traces from inbound HTTP requests.

To run our applications with automatic instrumentation and start collecting and exporting telemetry, run the commands below.

Python:

 
8
1
$ python3 -m venv .
2
$ source ./bin/activate
3
$ pip install .
4
$ opentelemetry-bootstrap -a install
5
$ opentelemetry-instrument \
6
   --traces_exporter console \
7
   --metrics_exporter console \
8
   flask run


.NET:

 
1
1
$ dotnet run Untranslatable.Api.csproj


These commands will start the instrument agent and set up the specific instrumentation libraries. Now, a trace will be printed to the console whenever we send a request. We can see the examples of output below.

Python:

 
38
1
{
2
 "name": "/words",
3
 "context": {
4
   "trace_id": "0x55072f6cc00531a489613e782942f75a",
5
   "span_id": "0x28135f1ccf37d85f",
6
   "trace_state": "[]"
7
 },
8
 "kind": "SpanKind.SERVER",
9
 "parent_id": null,
10
 "start_time": "2022-07-28T10:14:38.951442Z",
11
 "end_time": "2022-07-28T10:14:38.952775Z",
12
 "status": {
13
   "status_code": "UNSET"
14
 },
15
 "attributes": {
16
   "http.method": "GET",
17
   "http.server_name": "127.0.0.1",
18
   "http.scheme": "http",
19
   "net.host.port": 8000,
20
   "http.host": "127.0.0.1:8000",
21
   "http.target": "/words?language='es'",
22
   "net.peer.ip": "127.0.0.1",
23
   "http.user_agent": "python-requests/2.28.1",
24
   "net.peer.port": 58618,
25
   "http.flavor": "1.1",
26
   "http.route": "/words",
27
   "http.status_code": 200
28
 },
29
 "events": [],
30
 "links": [],
31
 "resource": {
32
   "telemetry.sdk.language": "python",
33
   "telemetry.sdk.name": "opentelemetry",
34
   "telemetry.sdk.version": "1.12.0rc2",
35
   "telemetry.auto.version": "0.32b0",
36
   "service.name": "unknown_service"
37
 }
38
}


.NET:

 
20
1
Activity.TraceId:       e5e958c3cf3cfb4819605c102cdcfeba
2
Activity.SpanId:        b75dd2c4abb36412
3
Activity.TraceFlags:        Recorded
4
Activity.ActivitySourceName: OpenTelemetry.Instrumentation.AspNetCore
5
Activity.DisplayName: words
6
Activity.Kind:      Server
7
Activity.StartTime:   2022-07-28T10:10:42.9292690Z
8
Activity.Duration:  00:00:00.0004600
9
Activity.Tags:
10
    http.host: localhost:7104
11
    http.method: GET
12
    http.target: /words
13
    http.url: http://localhost:7104/words?language=pt
14
    http.user_agent: python-requests/2.28.1
15
    http.route: words
16
    http.status_code: 200
17
   StatusCode : UNSET
18
Resource associated with Activity:
19
    service.name: untranslatable-dotnet
20
    service.instance.id: d715f73f-3147-4708-aec6-98bd75a3ad77


Notice that in Python, the traces have many empty unknown values by not adding any configuration.

Add Manual Instrumentation 

Manual instrumentation means adding extra code to the application to start and finish spans, define payload, and add counters or events. You can use client libraries and SDKs available for many programming languages. Manual instrumentation and automatic instrumentation should walk hand in hand as they complement each other. Instrumenting your application with intention will augment the automated instrumentation and provide better and deeper observability. The following implementation will add traces to the APIs' methods:

Python:

 
36
1
# app.py
2
# the libraries you already had
3
from opentelemetry import trace
4
from opentelemetry.sdk.resources import SERVICE_NAME, Resource
5
from opentelemetry.sdk.trace import TracerProvider
6
from opentelemetry.sdk.trace.export import BatchSpanProcessor, ConsoleSpanExporter
7
from opentelemetry.instrumentation.flask import FlaskInstrumentor
8
​
9
resource = Resource(attributes={SERVICE_NAME: "untranslatable-python"})
10
​
11
tracer_provider = TracerProvider(resource=resource)
12
trace.set_tracer_provider(tracer_provider)
13
tracer = trace.get_tracer(__name__)
14
trace.get_tracer_provider().add_span_processor(
15
   BatchSpanProcessor(ConsoleSpanExporter())
16
)
17
​
18
app = Flask(__name__)
19
FlaskInstrumentor().instrument_app(app)
20
​
21
@tracer.start_as_current_span("welcome-message")
22
@app.route("/")
23
def index():
24
   return Response("Welcome to Untranslatable!", status=200)
25
​
26
@app.route("/words/random", methods=["GET"])
27
def word_random():
28
   with tracer.start_as_current_span("random-word"):
29
       data = read_json_from_file()
30
       words = json.dumps(data)
31
       random_word = random.choice(words)
32
​
33
   return Response(random_word, mimetype="application/json", status=200)
34
​
35
if __name__ == "__main__":
36
   app.run()


.NET differs from other languages that support OpenTelemetry. The System.Diagnostics API implements tracing, reusing existing objects like ActivitySource and Activity to comply with OpenTelemetry under the hood. For consistency, I've used the OpenTelemetry Tracing Shim so that you can learn to use OpenTelemetry concepts. If you want to see an implementation using Activities, you can check this repo.

.NET:

 
67
1
// UntranslatableController.cs
2
using System.Linq;
3
using System.Threading;
4
using Microsoft.AspNetCore.Mvc;
5
using OpenTelemetry.Trace;
6
using Untranslatable.Api.Controllers.Extensions;
7
using Untranslatable.Api.Models;
8
using Untranslatable.Data;
9
using Untranslatable.Shared.Monitoring;
10
​
11
namespace Untranslatable.Api.Controllers
12
{
13
   [ApiController]
14
   [Route("words")]
15
   [Produces("application/json")]
16
   public class WordsController : ControllerBase
17
   {
18
       private readonly IWordsRepository wordsRepository;
19
       private readonly Tracer tracer;
20
​
21
       public WordsController(Tracer tracer, IWordsRepository wordsRepository)
22
       {
23
           this.wordsRepository = wordsRepository;
24
           this.tracer = tracer;
25
       }
26
​
27
       [HttpGet]
28
       public ActionResult<UntranslatableWordDto> Get([FromQuery] string language = null, CancellationToken cancellationToken = default)
29
       {
30
           using var span = this.tracer?.StartActiveSpan("GetWordByLanguage");
31
​
32
           Metrics.Endpoints.WordsCounter.Add(1);
33
           using (Metrics.Endpoints.WordsTime.StartTimer())
34
           {
35
               var allWords = Enumerable.Empty<UntranslatableWord>();
36
               using (var childSpan1 = tracer.StartActiveSpan("GetByLanguageFromRepository"))
37
               {
38
                   childSpan1.AddEvent("Started loading words from file...");
39
                   allWords = wordsRepository.GetByLanguage(language, cancellationToken);
40
                   childSpan1.AddEvent("Finished loading words from file...");
41
               }
42
               using (tracer.StartActiveSpan("WordsToArray"))
43
               {
44
                   var result = allWords.Select(w => w.ToDto()).ToArray();
45
                   return Ok(result);
46
               }
47
           }
48
       }
49
​
50
       [HttpGet]
51
       [Route("random")]
52
       public ActionResult<UntranslatableWordDto> GetRandom(CancellationToken cancellationToken = default)
53
       {
54
           using var span = this.tracer?.StartActiveSpan("GetRandomWord");
55
​
56
           Metrics.Endpoints.WordRandom.Add(1);
57
           using (Metrics.Endpoints.WordRandomTime.StartTimer())
58
           {
59
               span.AddEvent("GetRandomWord");
60
               var word = wordsRepository.GetRandom(cancellationToken);
61
               span.AddEvent("Done select Random Word");
62
​
63
               return Ok(word.ToDto());
64
           }
65
       }
66
   }
67
}

Store and Visualize Data

Jaeger is a popular open-source distributed tracing tool initially built by teams at Uber and then open sourced once it became part of the CNCF family. It's a back-end application for tracing that allows developers to view, search, and analyze traces. One of its most powerful functionalities is visualizing request traces through services in a system domain, enabling engineers to quickly pinpoint failures in complex architectures. 

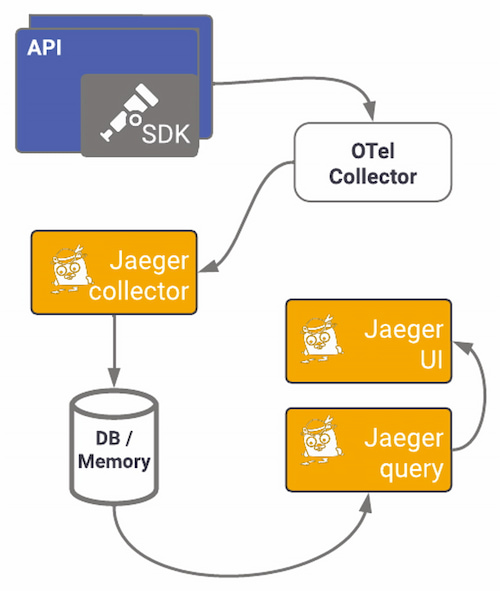
Jaeger provides instrumentation libraries built on OpenTracing standards. Using the specific exporter for Jaeger can offer a quick win on observing your application. Here we will use the OTel exporter and OpenTelemetry's Jaeger exporter to send OTel traces to a Jaeger back-end service. We've seen how the OTel collector works and is set up; the following diagram shows what using Jaeger's specific exporter pipeline looks like:

Figure 9: OTel Collector pipeline

To start visualizing data, you need to set up Jaeger first. You can opt for other setups, but I'll use the all-in-one image to install the collector, query, and Jaeger UI in one container, using memory as default storage (not for production environments). This docker-compose file sets up all components, the network, the ports needed, and the OTel Collector. The ports used in this example are the default ports for each service. Run docker-compose up to start the containers.

 
29
1
version: "3.5"
2
services:
3
 jaeger:
4
   networks:
5
     - backend
6
   image: jaegertracing/all-in-one:latest
7
   ports:
8
     - "16686:16686"
9
     - "14268"
10
     - "14250"
11
 otel_collector:
12
   networks:
13
     - backend
14
   image: otel/opentelemetry-collector:latest
15
   volumes:
16
     - "/YOUR/FOLDER/otel-collector-config.yml:/etc/otelcol/otel-collector-config.yml"
17
   command: --config /etc/otelcol/otel-collector-config.yml
18
   environment:
19
     - OTEL_EXPORTER_JAEGER_GRPC_INSECURE:true
20
   ports:
21
     - "1888:1888"
22
     - "13133:13133"
23
     - "4317:4317"
24
     - "4318:4318"
25
     - "55670:55679"
26
   depends_on:
27
     - jaeger
28
networks:
29
 backend:


You should now have two containers running, one for Jaeger and another for the OTel collector:

 
3
1
NAMES                 STATUS
2
otel_collector-1      Up 23 minutes
3
jaeger-1              Up 23 minutes


If you navigate to http://localhost:16686, you should see Jaeger's UI. Here you'll be able to explore the traces generated by your instrumentation:

Figure 10: Jaeger's user interface

In the top left drop-down menu is the service we created. Services are added to that list when we export traces to Jaeger. As I've mentioned, there are two ways to export telemetry to Jaeger, using the OTLP or directly to Jaeger using one of the supported protocols. We've already seen how to configure the OTLP collector, so now all we have to configure is the Collector to export to Jaeger:

 
30
1
receivers:
2
 otlp:
3
   protocols:
4
     http:
5
       endpoint: 0.0.0.0:4318
6
     grpc:
7
       endpoint: 0.0.0.0:4317
8
processors:
9
 batch:
10
   timeout: 1s
11
exporters:
12
 logging:
13
   loglevel: info
14
 jaeger:
15
   endpoint: jaeger:14250
16
   tls:
17
     insecure: true
18
extensions:
19
 health_check:
20
 pprof:
21
   endpoint: :1888
22
 zpages:
23
   endpoint: :55679
24
service:
25
 extensions: [pprof, zpages, health_check]
26
 pipelines:
27
   traces:
28
     receivers: [otlp]
29
     processors: [batch]
30
     exporters: [logging, jaeger]


However, if setting up a collector seems daunting, or if you want to start small using OpenTelemetry, sending data directly to a back end can offer results reasonably fast without the Collector. Let's start by installing OpenTelemetry's Jaeger exporter. 

Python:

 
1
1
$ pip install opentelemetry-exporter-jaeger


.NET:

 
1
1
$ dotnet add package OpenTelemetry.Exporter.Jaeger


Again, in Python, we install the package on our host or the virtual environment, whereas for .NET, we add it directly as a project dependency. For Python, the package comes with both gRPC and Thrift protocols.

Python:

 
23
1
# app.cs
2
# ... other imports
3
from opentelemetry import trace
4
from opentelemetry.exporter.jaeger.thrift import JaegerExporter
5
from opentelemetry.sdk.trace.export import BatchSpanProcessor
6
from opentelemetry.sdk.trace import TracerProvider
7
from opentelemetry.sdk.resources import SERVICE_NAME, Resource
8
​
9
resource = Resource(attributes={SERVICE_NAME: "untranslatable-python"})
10
​
11
jaeger_exporter = JaegerExporter(
12
   agent_host_name="localhost",
13
   agent_port=6831,
14
   collector_endpoint="http://localhost:14268/api/traces?format=jaeger.thrift",
15
)
16
​
17
tracer_provider = TracerProvider(resource=resource)
18
jaeger_processor = BatchSpanProcessor(jaeger_exporter)
19
tracer_provider.add_span_processor(jaeger_processor)
20
​
21
trace.set_tracer_provider(tracer_provider)
22
tracer = trace.get_tracer(__name__)
23
#... rest of initializations and actions


After installing the package, you can set the exporter in the TracerProvider, which will be configured when tracing starts. Now we will do the same for .NET: After adding the NuGet package to the project, we will configure the exporter. Here we will enable instrumentation using an extension method — AddAspNetCoreInstrumentation — on IServiceCollection and binding the Jaeger exporter.

.NET: 

 
16
1
// Program.cs
2
// ... other imports and initializations
3
var serviceName = "untranslatable-dotnet";
4
var serviceVersion = "1.0.0";
5
​
6
var resource = ResourceBuilder.CreateDefault().AddService(serviceName);
7
builder.Services.AddOpenTelemetryTracing(b => b
8
   // ...  rest of setup code
9
   .AddJaegerExporter(o =>
10
   {
11
              o.AgentHost = "localhost";
12
       o.AgentPort = 6831;
13
       o.Endpoint = new Uri("http://localhost:14268/api/traces?format=jaeger.thrift");
14
   })
15
).AddSingleton(TracerProvider.Default.GetTracer(serviceName));
16
// ...  rest of initializations and actions


Now run your APIs and make some requests. Go to Jaeger's UI, and you should be able to see traces generated by those requests by selecting the service name you specified and the operation you traced. Below, you can see all traces captured within a time window and a trace's detail and the associated spans:

Figure 11: All traces

Figure 12: Trace details

For complex systems and architectures, distributed tracing is invaluable. You can quickly start exporting directly to Jaeger's back end and adding OpenTelemetry auto-instrumentation to get the telemetry data. With Jaeger, it's easier to find where the problem occurred than through logs, allowing you to monitor transactions, perform root cause analysis, optimize performance and latency, and visualize service dependencies.

Common Pitfalls of Migrating Legacy Applications to OpenTelemetry 

Your services are probably already emitting telemetry data bound to some observability back end. Changing your observability architecture can be very painful:

  • Re-instrumenting is time consuming
  • Data will change
  • Telemetry data must continue to flow, not allowing blind stops in the system
  • Traces have to remain linked

To migrate sequentially and as seamlessly as possible, you can use the OpenTelemetry Collector as a proxy between your services and the back ends you use. The Collector can replace most telemetry services, removing the need for separate services for processing and transmitting signals, making them redundant. Its telemetry pipeline's flexibility lets you configure any compatible back end or service while keeping your code agnostic. 

Suppose you want to start migrating all your applications slowly. In that case, the Collector can translate any input into the output you need; you can move an application to OpenTelemetry and send data to the same back end. Note that when changing instrumentation libraries, the output produced changes, so you might have to adjust your dashboards and alerting systems. 

Section 6

Conclusion

Correlation does not equal causation — we must interpret the meaning of every correlation. But who has the time? OpenTelemetry aims to simplify data collection to focus on data analysis and processing while creating a standard to abstract from the previous proprietary and in-house solutions. Collecting and reviewing the data takes time; automating this process is a massive win for observability.

As of writing this Refcard, below is the status of OpenTelemetry Signals:

Figure 13: Timeline of OpenTelemetry Signals status

With 93 pull requests per week and over 450 companies backing up and maintaining the project, it provides access to an extensive set of telemetry collection frameworks. Having the community's backing means that you'll have to wait for a shorter period from the need identification to the supply. By not having product or profit concerns, the community can respond promptly and offer support for new technologies without waiting for vendors' support.

By standardizing how frameworks and applications collect and send observability data, OpenTelemetry helps solve the challenges created by the different stacks and back ends, giving teams a vendor-neutral, portable, and pluggable solution that is easily configured with open-source and commercial solutions alike.

Additional resources:

  • OpenTelemetry Documentation – https://opentelemetry.io/docs
  • OpenTelemetry DevStats Dashboard – https://opentelemetry.devstats.cncf.io/d/8/dashboards
  • OpenTelemetry implementation status per language – https://github.com/open-telemetry/opentelemetry-specification/blob/main/spec-compliance-matrix.md
  • OpenTelemetry Twitter – https://twitter.com/opentelemetry
  • "Full-Stack Observability Essentials" Refcard – https://dzone.com/refcardz/full-stack-observability-essentials
  • "Distributed Tracing in ASP.NET Core With Jaeger and Tye, Part 1: Distributed Tracing" – https://dzone.com/articles/distributed-tracing-in-aspnet-core-with-jaeger-and
  • Distributed Tracing Overview – https://www.logicmonitor.com/support/tracing/getting-started-with-tracing
  • "Getting Started With Log Management" Refcard – https://dzone.com/refcardz/log-management

Like This Refcard? Read More From DZone

related article thumbnail

DZone Article

Understanding Open Telemetry and Observability w/ Splunk's Spiros Xanthos
related article thumbnail

DZone Article

OpenTelemetry Moves Past the Three Pillars
related article thumbnail

DZone Article

The Five Tenets of Observability
related article thumbnail

DZone Article

Observability 101: Terminology and Concepts
related refcard thumbnail

Free DZone Refcard

Full-Stack Observability Essentials
related refcard thumbnail

Free DZone Refcard

Getting Started With Log Management
related refcard thumbnail

Free DZone Refcard

Observability Maturity Model
related refcard thumbnail

Free DZone Refcard

Getting Started With OpenTelemetry

ABOUT US

  • About DZone
  • Support and feedback
  • Community research
  • Sitemap

ADVERTISE

  • Advertise with DZone

CONTRIBUTE ON DZONE

  • Article Submission Guidelines
  • Become a Contributor
  • Core Program
  • Visit the Writers' Zone

LEGAL

  • Terms of Service
  • Privacy Policy

CONTACT US

  • 3343 Perimeter Hill Drive
  • Suite 100
  • Nashville, TN 37211
  • support@dzone.com

Let's be friends: