

Reading Playwright Traces When Browser Automation Fails
When browser automation fails, the thrown error is usually three steps removed from the actual cause. Treat the Playwright trace as the source of truth.
Join the DZone community and get the full member experience.
Join For FreeOne error message has been haunting me since I started working with Playwright for browser automation: "Target page, context, or browser has been closed."
At first it seemed actionable, so I went hunting for where it got closed and what closed it. But I didn't find the cause, and it only happened once, so I moved on. The same message turned up two days later from an unrelated cause. This time I was certain I could find the issue. I dove into the infrastructure logs, comparing the failure from two days ago with today's. The first time, a load balancer dropped an idle browser connection after a timeout nobody had documented. The second time, our own cookie-consent-handling code was closing a tab it shouldn't touch. One error string, two completely unrelated issues.
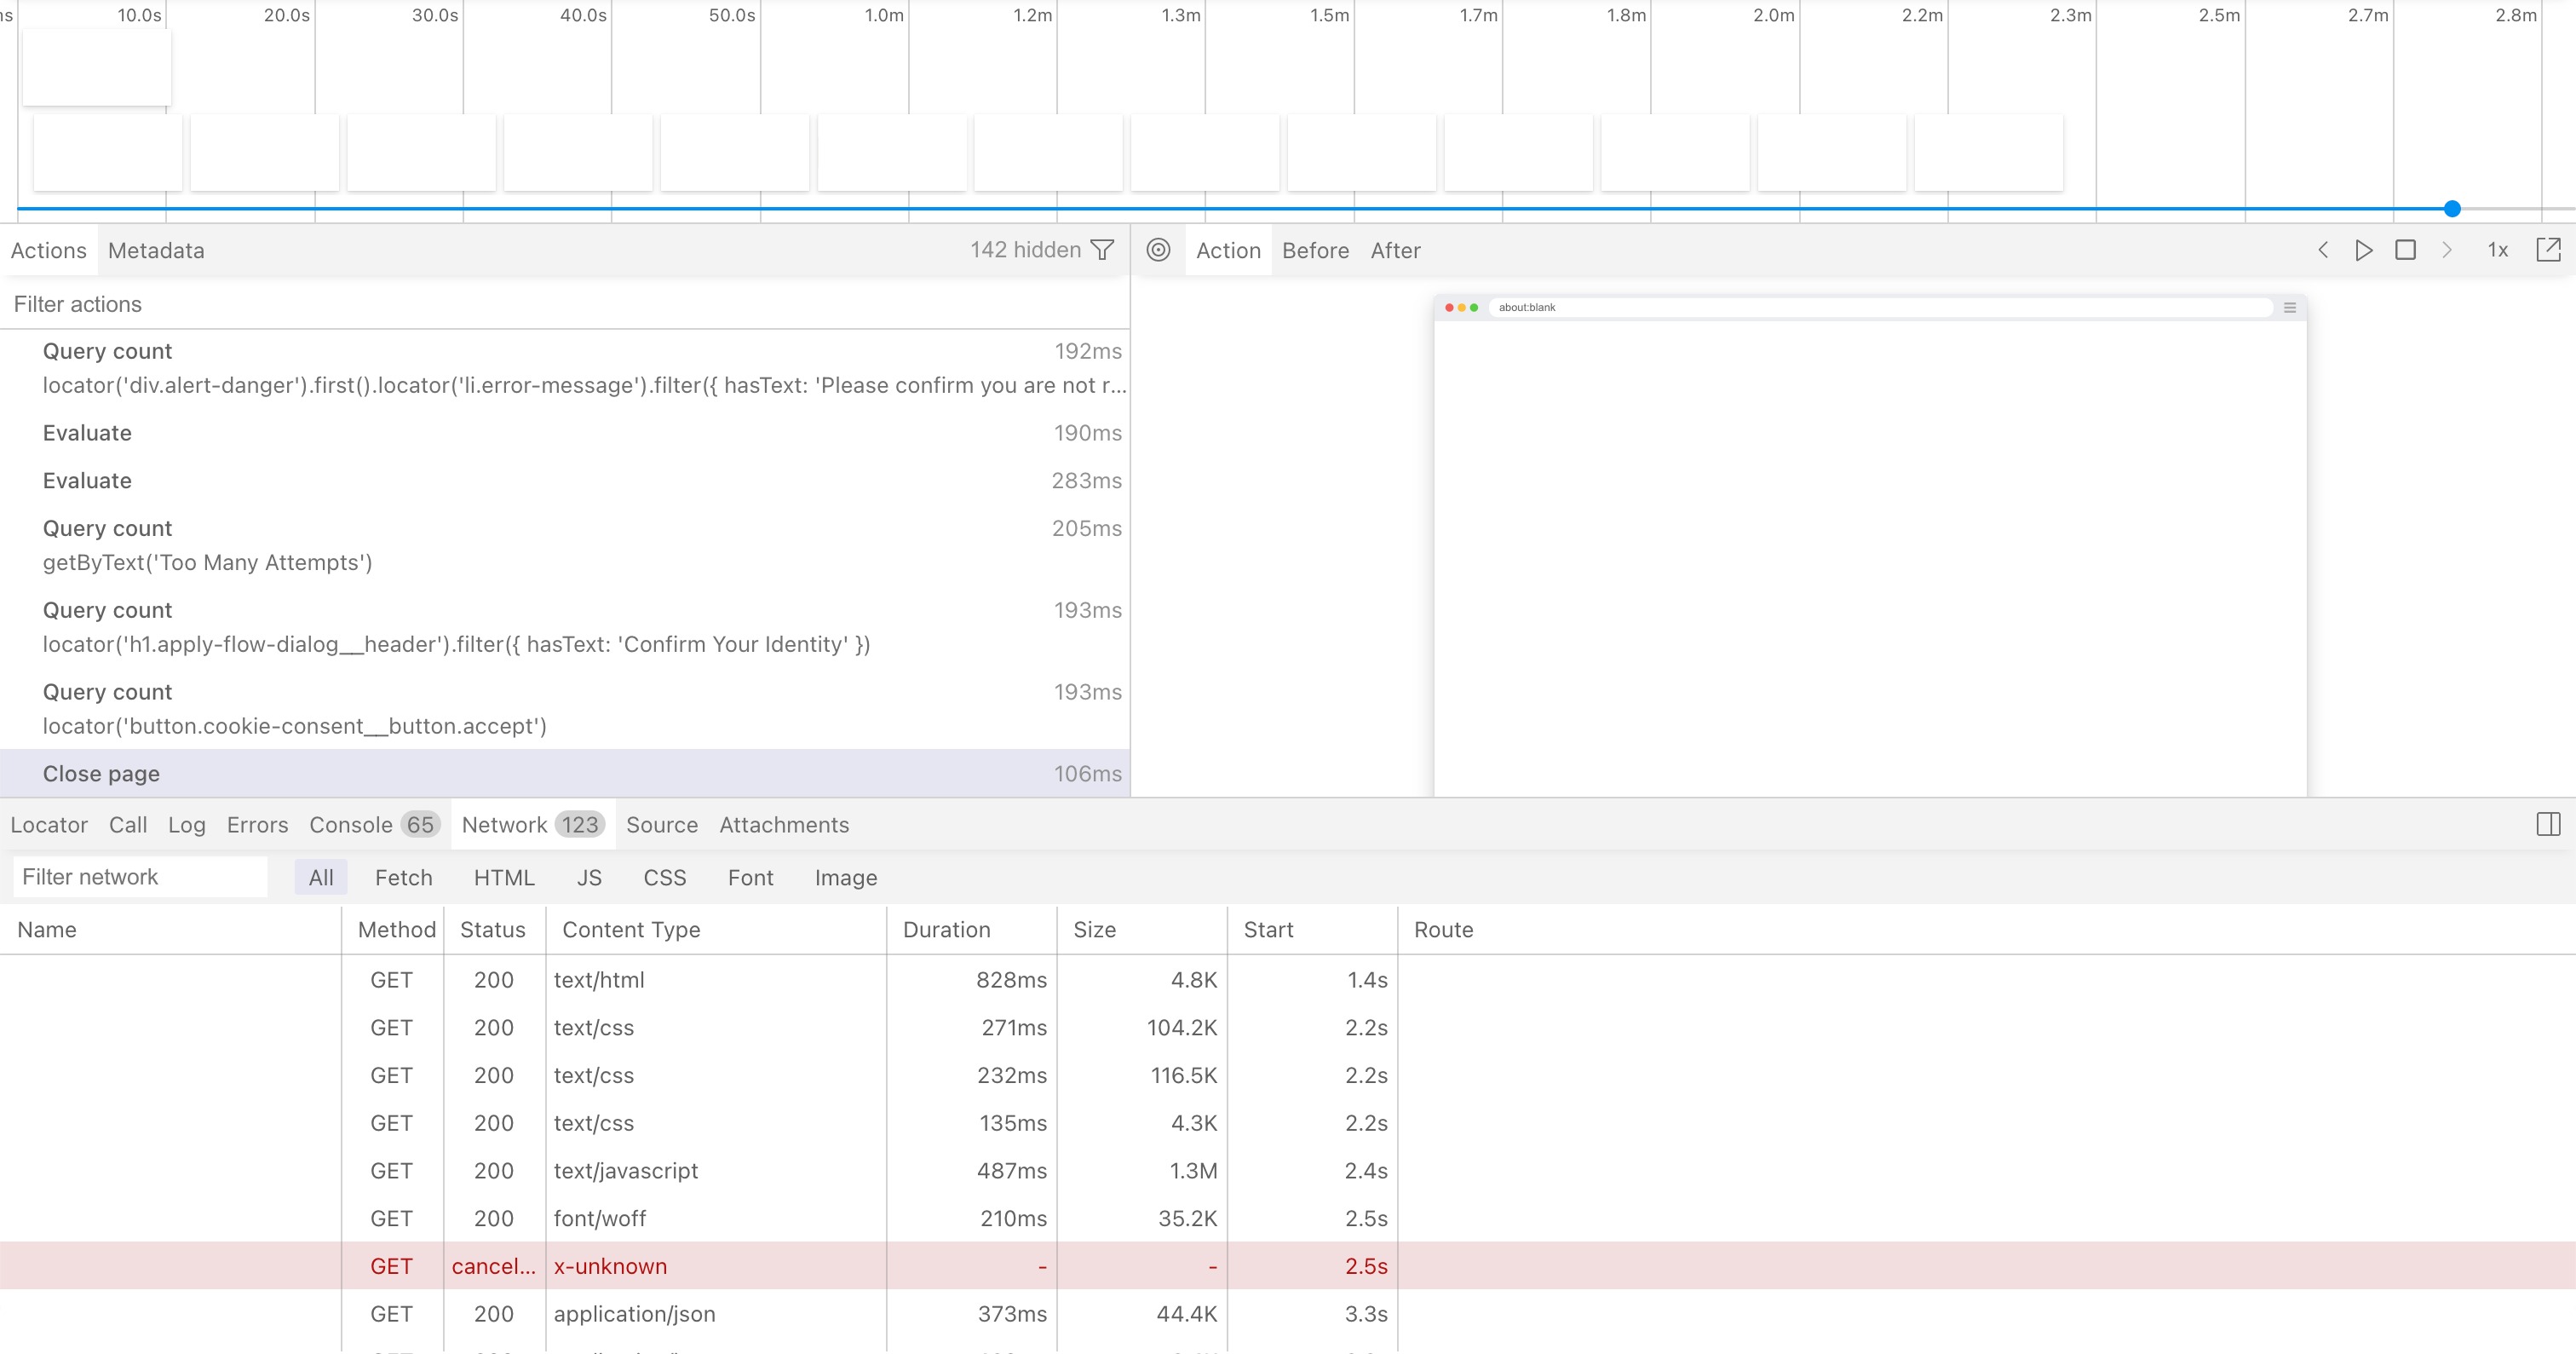
These days, I debug browser automation differently. Unlike in traditional software engineering, the thrown error is often a poor place to start. If you've worked with web pages before, you'll know that a lot of your environment is out of your control. The page breaks, then something downstream of the page breaks, and the exception you finally catch is usually three steps removed from what actually went wrong.
The real story lives in the Playwright trace. A trace is a few megabytes of mostly useless data wrapped around the few hundred lines that matter. The Trace Viewer GUI is nice for a single run, but it does not scale when you are triaging dozens of failures, or reading traces from a script.
Two years of browser flakiness later, here is my practical advice: what is actually in a trace, and the handful of things I pull out of every one.
What Is a Trace Zip
When you invoke tracing.start({ screenshots: true, snapshots: true }), Playwright builds a zip, written to disk once the browser closes. For our automations, one trace from a single run can come to 5.1 MB:
trace.trace      1.2 MB   JSONL event stream (the actions we took)
trace.network    388 KB   JSONL network snapshots (HAR-equivalent)
trace.stacks     104 KB   source-mapped call stacks
resources/       ~3.4 MB  276 screenshot JPEGs, 40 DOM snapshots, 41 source files, 1 HTML
The 276 screenshots are most of the file and provide minimal diagnostic value (more on that later). If you debug a trace by scrolling through screenshots, you are spending your attention on the cheapest data in the bundle, and taking the slowest path to a fix.
The Core Things Worth Analyzing
trace.trace contains JSON-lines. Most of them are noise you can ignore. The following are your sources of truth for what actually happened:
The Action Timeline
Playwright stores before and after pairs on each action (Frame.click, Frame.fill, etc.). Each pair is a replayable record of what your code did, which arguments it used, and what came back.
This is where you can catch a click that "succeeded" but landed on the wrong HTML node, or a fill that Playwright reported as successful but never actually changed the page.
const KEEP = new Set([
  "Frame.click", "Frame.fill", "Frame.evaluateExpression", "Page.goto",
])

for await (const line of readline.createInterface({
  input: createReadStream("trace.trace"),
})) {
  const e = JSON.parse(line)
  if ((e.type === "before" || e.type === "after") && KEEP.has(e.method)) {
    console.log(e.type, e.method, e.params?.selector ?? "", e.error ?? "")
  }
}
pageError Events
A pageError is an error thrown by the page's own JavaScript, and crucially, it never reaches your application logger. These exist only in the trace, and they are often the real cause sitting behind a generic timeout. For example, in one trace, the single highest-signal piece of information I found looked like this:
{
  "type": "event",
  "method": "pageError",
  "params": { "error": { "error": {
    "name": "SecurityError",
    "message": "Failed to set the 'cookie' property on 'Document': Access is denied for this document.",
    "stack": "..."
  } } },
  "pageId": "page@..."
}
Pair this with the generic error your application ends up logging, for example, "element not found", and the root cause becomes clear: the form's own script threw, so the element you were waiting for never rendered. Your Playwright selector may have been fine the whole time.
Console Errors
console events also live in this JSON-line file: messages the page itself wrote to its console, not your application's own logs. It also includes the severity (e.g. messageType === "error"). These are the quiet failures that do not throw, but still break the page underneath you.
Network
trace.network is essentially a HAR file. It contains the full history of network requests, and it is what surfaces a 4xx request that failed because of an incomplete captcha solve.
for await (const line of readline.createInterface({
  input: createReadStream("trace.network"),
})) {
  const n = JSON.parse(line)
  const status = n.response?.status
  if (status && status >= 400) {
    console.log(status, n.request?.method, n.request?.url)
  }
}
Screenshots: You Need One, Not 276
Screenshots are the most expensive part of the trace, and the thing you lean on most in the trace UI. As soon as you (or an agent) are analyzing traces in batches, you do not need 276 frames. You need a handful of curated ones. Grab the screencast frames closest to the actions around the failure timestamp, and you have the relevant visual context 99% of the time. The very last screenshot is often not enough on its own; pull the handful that sit nearest to a Playwright action.
Ideally, match the screenshot's timestamp to the before event of the failing action, and you have a picture of exactly what the page looked like when it broke, including cookie banners and everything else that shows up in pixels and nowhere in the logs.
Putting It All Together
I usually pull the data in this order, ready to hand to an LLM:
- The last action in the timeline, combined with the application logs. Answers "What were we trying to do?"
pageErrorand console errors near that timestamp. Answers "Did the page itself break?"- Network responses >= 400, checked against timestamps so you don't over-index on transient failures (most pages have failing requests that are non-terminal). Answers "Is the surface error hiding a backend failure?"
- Curated screenshots. Answers "What visual context helps with resolving the issue?"
Steps 1 to 3 settle most failures and never require going multimodal when using an agent to debug your issues.
The great thing is that none of this requires special observability tooling. It is all sitting in a file Playwright already writes. All you need is a bit of data transformation. Using it changed my debugging and time-to-resolution completely.
Opinions expressed by DZone contributors are their own.
Comments